
Every trading platform offers a sentiment widget of some kind. Most of them get read badly, and a few get read as though they printed the future.
This guide covers the market sentiment indicators worth a place in a routine. For each one it explains what the number measures, how stale it already is, and where the honest limit sits.
What Market Sentiment Indicators Actually Do
Start with the job description. These tools describe how participants sit and how they feel, nothing more.
Context, Never a Trigger
A price chart tells you what happened. A sentiment read tells you who did it and how crowded that side has become.
Knowing the crowd is heavily long does not tell you what happens next. It tells you what could happen quickly if the crowd changes its mind.
So the output belongs in your sizing and your expectations. Entry rules should still come from price and from your own plan.
Reading the Panel Above
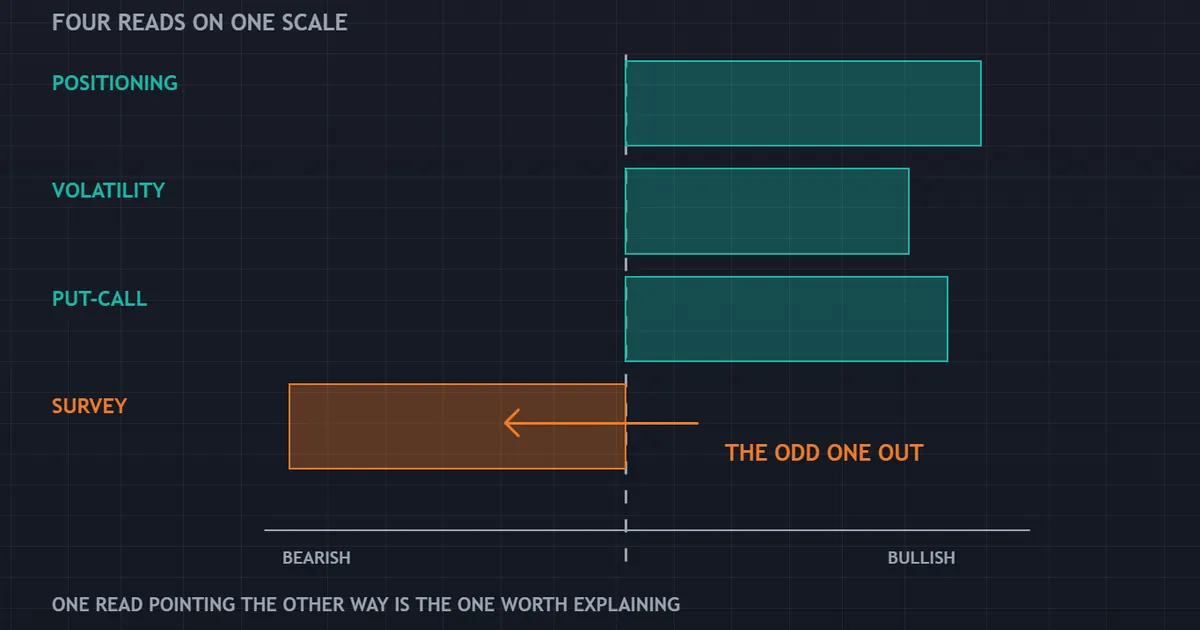
The panel shows four reads stacked together. Three agree, and one points the other way.
That situation arrives constantly. Reads disagree because they measure different groups of participants over different windows.
Treat disagreement as useful information rather than as a fault. It usually means the move has not yet convinced everybody.
Sentiment in Plain Words
Strip out the jargon and this gets simple. A price tells you where a market trades right now.
A sentiment read tells you who owns it. That is the whole idea.
Why the Owner Matters
Think of a crowd on one side of a boat. The boat still floats, so nothing looks wrong.
Then a wave hits. Everyone moves at once, and the boat tips much further than the wave alone would tip it.
Markets work the same way. A one-sided book turns a small shock into a big move.
Why It Cannot Tell You When
Crowds sit on one side for a long time. Some sit there for months.
No read tells you which wave will hit, or when. So you learn how far a market could fall, but not the day it starts.
The Two Jobs It Can Do
Use it to size a trade. A crowded market can swing wide, so take less risk per trade.
Use it to set your hopes. In a crowded market, plan for a fast move rather than a slow one.
Do not use it to pick a side. That is the one job it cannot do.
Positioning: The COT Report
The Commitments of Traders report remains the most cited positioning source in retail circles. It also carries the most misunderstanding.
What It Actually Covers
The CFTC publishes it, and it covers regulated futures markets. Currency futures, not spot forex, sit behind every currency line in the report.
Spot forex trades over the counter, across many separate venues. No central body collects a complete record of it, so no equivalent report exists.
Futures positioning still proxies the wider market reasonably well. Large speculators in currency futures tend to lean the same way as their spot books.
The Timing Problem
Here is the detail most articles skip. The snapshot comes from the close of business on Tuesday, and publication follows on Friday afternoon.
So the newest figure you can read already describes a market three days old. By Monday it describes the previous week.
That delay rules out any short-term use. Positioning works as a slow weekly gauge of crowding, and it fails completely as a timing tool.
How to Read It Sensibly
Track the net position of large speculators against its own history. Extremes matter more than the raw number.
Our guide to the COT report works through the categories and the arithmetic behind each column.
Retail Long-Short Ratios
Brokers publish the split between long and short clients. Charting platforms often show the same figures.
Whose Book Are You Reading?
Each figure covers one broker’s own customers. A second broker with a different clientele can publish a very different split on the same afternoon.
Retail flow also forms a modest share of daily turnover. So a lopsided reading describes one corner of the market, not the market itself.
The Fade and Its Limits
Retail crowds do lean the wrong way at turning points often enough to be noticed. That observation gets stretched into a system, and there it breaks.
An eighty percent long reading can sit unchanged for weeks while price climbs. Our deep dive on retail sentiment in forex shows both outcomes from the same crowded setup.
Volatility Gauges
Volatility pricing measures fear more directly than any survey. Two versions exist.
The Equity Volatility Index
This index reads option prices on a US equity index. It contains no currency data at all, and its relevance runs through the risk channel.
Rising demand for equity protection usually accompanies wider de-risking. Funding currencies and havens catch that flow.
Our guide to the VIX in forex covers the mechanism and the places where the link fails.
Currency Option Volatility
The better tool for a currency trader gets far less attention. Implied volatility quoted on a specific pair describes the expected range for that pair.
Some data providers publish it freely, and a few brokers show it on request. It answers the same question as the equity gauge, about the instrument you actually trade.
The Dollar Index as a Sentiment Read
The dollar index measures the reserve currency against a fixed basket. Traders use it as a broad risk gauge, with reason.
Why It Works as a Barometer
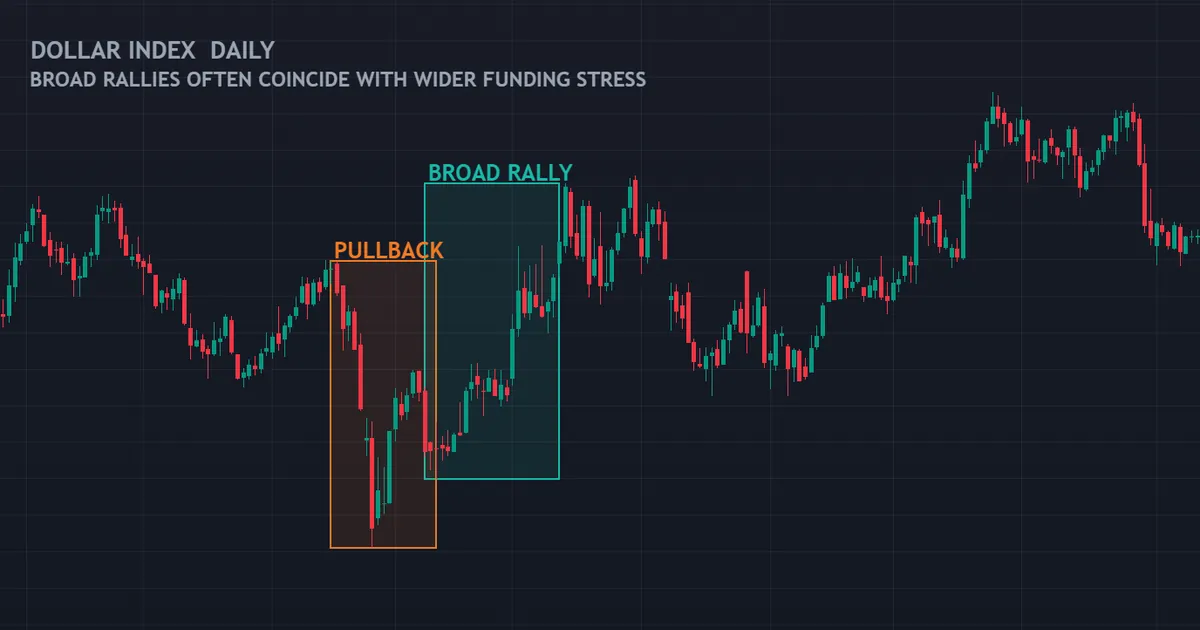
Global funding runs largely in dollars. When credit tightens anywhere, demand for dollars rises regardless of what the United States did.
So a broad dollar rally alongside falling equities usually signals stress rather than American strength. Our guide to the dollar index in forex covers the basket weights and the quirks.
Where It Misleads
The basket leans heavily on the euro. A euro-specific story therefore moves the index without saying anything about global risk appetite.
Check a trade-weighted measure or a couple of individual pairs before concluding anything. One number covering many currencies hides more than it shows.
Risk Barometer Crosses
Some pairs express the risk trade almost purely. They make excellent free sentiment gauges.
Why Crosses Beat Dollar Pairs
A commodity currency against a funding currency removes the dollar from the equation. What remains is appetite for yield against demand for safety.
Those crosses move earliest and furthest during de-risking. Traders watch them the way equity traders watch credit spreads.
Reading Them Alongside a Haven
One leg alone can mislead. A currency falls for domestic reasons regularly enough that a single chart proves little.
Pair the cross with gold. Both legs moving together in the classic pattern confirms a genuine risk episode.
Havens: Gold, the Yen and the Franc
Haven demand is the oldest sentiment read of all. It also carries the clearest caveats.
Gold as the Reference
Gold answers to no central bank and pays no yield. Money moves into it when confidence in paper assets drops.
It reacts to real yields as well, which muddies the read. A gold rally on falling real yields tells a different story from a gold rally on a headline.
The Currency Havens
The yen and the franc behave as havens for structural reasons. Both come from creditor nations with low domestic rates.
Neither behaves that way reliably. Our guide to safe haven currencies covers the occasions when the pattern failed outright.
Options Reads: Risk Reversals and Put-Call
Option markets reveal positioning more honestly than surveys. Two measures matter for currencies.
Risk Reversals
A risk reversal compares the price of an upside option with the equivalent downside option. A negative reading means downside protection costs more.
That skew shows which direction traders fear. It updates continuously, which puts it well ahead of any weekly report.
The Put-Call Ratio
Equity option markets publish the ratio of put volume to call volume. High readings signal defensive positioning.
The link to currencies runs through the same risk channel as the volatility index. Treat it as background colour rather than as a currency read.
Surveys and Fund Manager Reads
Several institutions poll investors regularly. Results reach the public with a lag.
What Surveys Add
Surveys capture opinion rather than money. Somebody can report bearishness while staying fully invested, and frequently does exactly that.
So the gap between stated views and actual positioning carries the real information. Extreme pessimism with heavy long positions describes a fragile market.
What Surveys Miss
Sample sizes stay small, and respondents self-select. Weekly publication adds another delay on top.
Use them for the extremes only. Middling survey readings carry almost no information worth acting on.
Open Interest and Volume
Futures markets publish both figures daily. Together they show whether money is entering or leaving.
The Basic Split
Volume counts contracts traded in a session. Open interest counts contracts still outstanding at the end of it.
Rising price with rising open interest suggests new money backing the move. Rising price with falling open interest suggests short covering instead.
The Spot Forex Gap
Spot forex has no central open interest figure, for the same reason it has no central volume figure. Our guide to open interest explains the mechanics and the workarounds.
Credit Spreads and Bond Yields
Credit markets often move before currencies do. They deserve more attention than they get from retail traders.
What Spreads Show
The gap between corporate and government borrowing costs measures appetite for risk directly. Widening spreads mean investors want compensation for holding anything uncertain.
That widening usually precedes weakness in high-yield currencies. Nothing about the relationship is precise, yet the direction of travel matters.
Yields as the Fundamental Leg
Falling government yields alongside falling equities describe a flight to quality. Falling yields alongside rising equities describe something else entirely.
Reading the two together separates a genuine scare from a routine pullback.
Download the complete indicator database
Put these concepts on your charts. One email unlocks the full library of 1,380+ indicators with compiled MT4 and MT5 files, plus my TradingView scripts. No paywall, no spam, unsubscribe any time.
Get free access to my indicator database
One email unlocks 1,380+ free MT4, MT5 and TradingView indicators — the complete library. No single-tool download; you get the whole database.
What Every Sentiment Read Shares
Different tools, same handful of weaknesses. Five of them apply across the whole list.
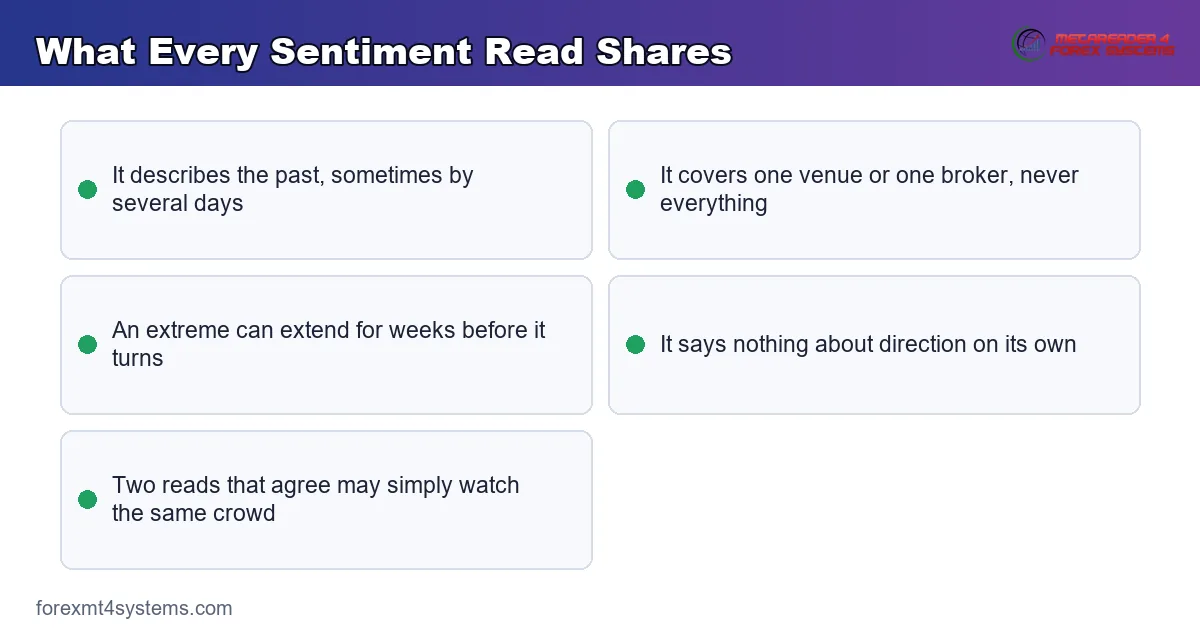
None of these weaknesses makes the tools useless. Together they explain why sentiment belongs in the context column rather than in a rule.
A Quick Comparison
Freshness varies enormously across the list. That single property decides how each read can be used.
| Read | Coverage | How fresh | Honest use |
|---|---|---|---|
| COT report | Regulated futures | Tuesday data, Friday release | Weekly crowding gauge |
| Retail long-short | One broker’s clients | Live or near-live | Colour, with heavy caveats |
| Equity volatility index | US equity options | Live in US hours only | Risk climate context |
| Currency implied volatility | The pair itself | Live | Expected range and event pricing |
| Risk reversals | The pair itself | Live | Direction of fear |
| Haven prices | Global | Live | Confirming a risk episode |
| Surveys | A small panel | Weekly or monthly | Extremes only |
| Credit spreads | Corporate bonds | Daily | Early warning |
Notice how few of them update fast enough for a trading decision. Live reads earn a place in a session routine, and the rest belong in a weekly review.
The One-Minute Summary
Here is the whole guide in one block. Read it before the detail, or instead of it.
- COT report. Futures positioning from the CFTC. Tuesday snapshot, Friday release, so treat it as a weekly crowding gauge and nothing faster.
- Retail long-short. One broker’s client book. Useful as colour, misleading as a market-wide claim, and never a stand-alone entry rule.
- Equity volatility index. Option pricing on a US equity index. No currency content at all, and its link to your pair runs through the risk channel.
- Currency implied volatility. Option pricing on the pair itself. The most directly useful read on this list, and the least discussed.
- Risk reversals. The price gap between upside and downside options. Shows which direction the market fears, and updates live.
- Dollar index. The reserve currency against a fixed basket. A broad rally with weak equities usually means funding stress.
- Risk barometer crosses. A commodity currency against a funding currency, with the dollar taken out. The cleanest free read available.
- Havens. Gold, the yen and the franc. Confirming legs, never a signal on their own.
- Surveys. Opinion rather than money. Worth reading only at the extremes.
- Open interest. Contracts still outstanding in futures. Shows whether new money backs a move, with no spot forex equivalent.
- Credit spreads. The extra yield demanded from corporate borrowers. Frequently the earliest warning of the lot.
Where the Numbers Come From
Sources matter as much as readings. Knowing the origin tells you the delay.
- Regulators. The CFTC publishes the futures positioning report each week, with explanatory notes describing every column.
- Exchanges. Futures venues publish volume and open interest for every contract at the end of each session.
- Option desks. Implied volatility and skew come from banks and data vendors, and free versions exist for the majors.
- Brokers. Retail long-short splits come from a broker’s own book, on that broker’s own schedule.
- Survey houses. Polls of investors and fund managers, published weekly or monthly with a lag.
- Price itself. Havens, crosses and the dollar index carry no delay at all, which is their main advantage.
Combining Them Without Fooling Yourself
More tools rarely means more information. Overlap causes most of the trouble.
Watch for Hidden Duplication
An equity volatility gauge, a put-call ratio and a credit spread all read the same underlying mood. Stacking three of them feels like confirmation and delivers repetition.
Pick one read per idea instead. One positioning read, one volatility read and one haven read cover the ground.
Decide the Use Before You Look
Contrarian and confirming uses point opposite ways from the same number. Choose after the fact and you will pick whichever version backs the trade you already wanted.
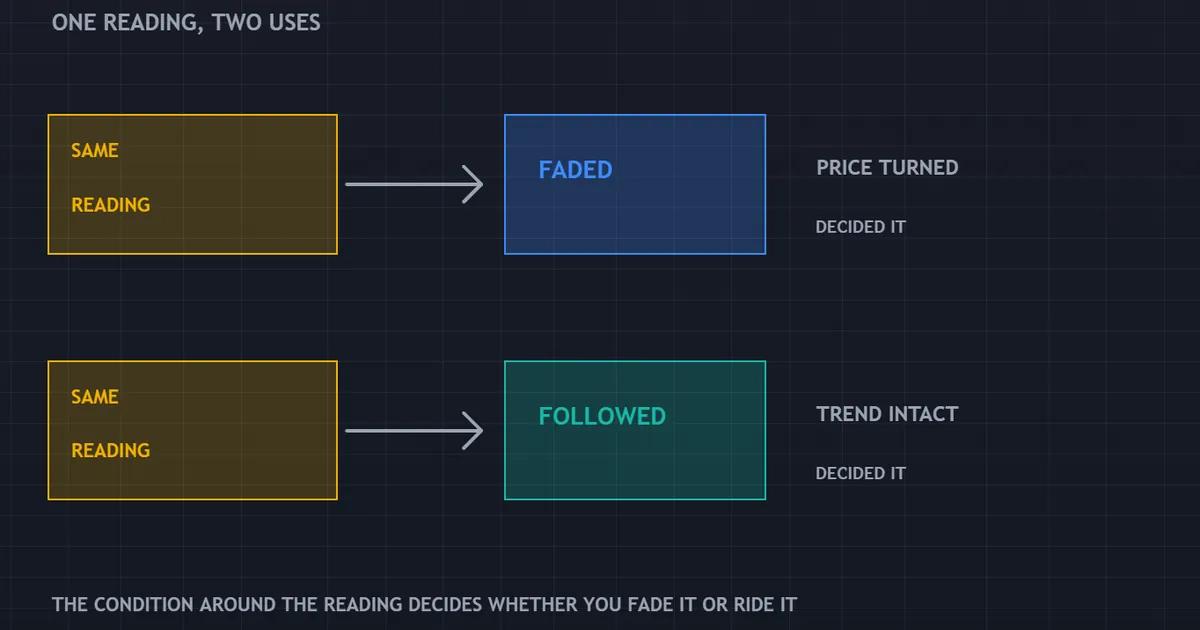
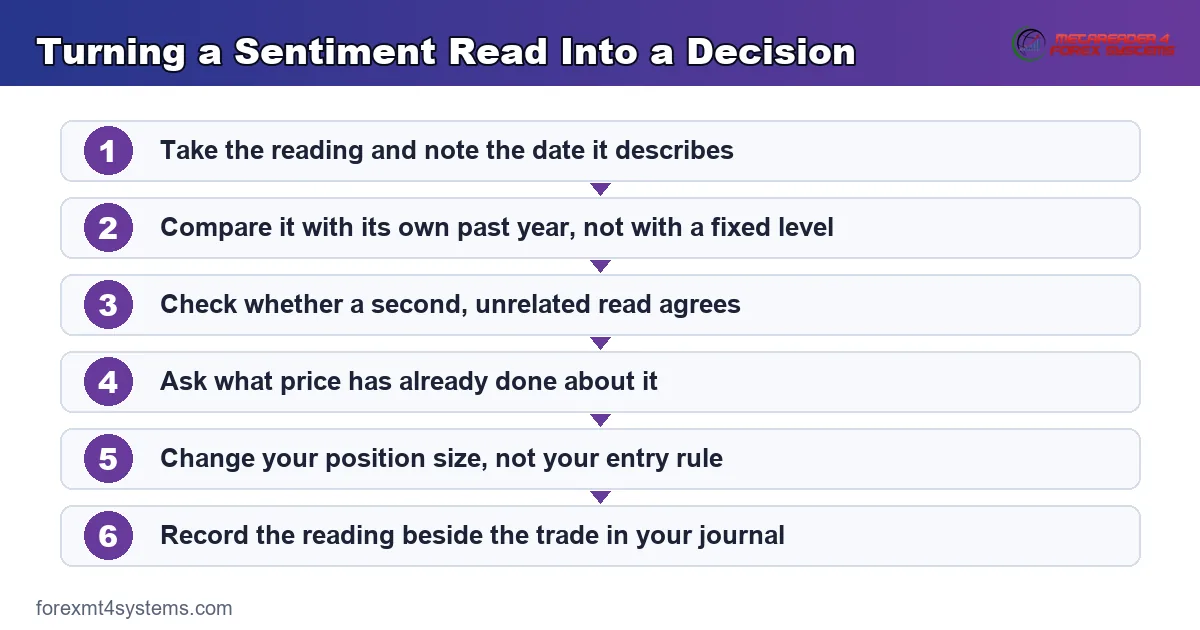
Write the rule down first. Fade an extreme only when price has already turned, and follow the crowd only while the trend still holds.
Keep the Chart in Charge
Price remains the only read with no delay at all. Our guide on how to combine indicators covers the overlap problem in a technical context.
For a live cross-market view of which currencies are strong today, our free currency strength meter compares them all at once.
Building a Small Dashboard
Three reads beat ten. Pick one from each group below and then stop.
- One positioning read. The weekly futures report covers this for the major currencies.
- One volatility read. Implied volatility on your main pair, or the equity gauge if that is all you can reach.
- One haven read. Gold, or a single yen cross, checked at the same time each day.
Write the three numbers in the same place every session. The habit takes a minute, and the record pays for itself later.
Common Mistakes
Four errors show up constantly. Each has a one-line fix.
Treating Weekly Data as Live
Positioning reports describe a market several days gone. Never place an intraday trade on a Tuesday snapshot published on Friday.
Calling One Broker the Market
A retail split covers that broker’s clients and nobody else. Compare two sources before drawing any conclusion.
Fading an Extreme on Sight
Crowded gets more crowded regularly. Wait for price to confirm the turn before acting on any extreme reading.
Adding Tools Instead of Rules
Six overlapping gauges produce noise and false confidence. Our currency strength indicators library shows how a single well-chosen read beats a crowded screen.
Ignoring the Calendar
Sentiment shifts fastest around scheduled events. Our free economic calendar shows what is coming before the mood changes.
FAQ
Which sentiment read is the most useful?
For a currency trader, implied volatility on the pair itself, because it updates live and describes the instrument you trade. Positioning data ranks second, though only as a slow weekly gauge. Retail long-short figures rank last, since each one covers a single broker’s client book rather than the market as a whole.
Does the COT report cover spot forex?
No. It covers regulated futures markets, and the currency lines describe currency futures contracts. Spot forex trades over the counter with no central record, so no complete equivalent exists. Futures positioning still proxies the wider market reasonably, provided you remember what the data actually counts.
Can I trade purely on sentiment?
Not sensibly. Every read on this list describes the past, most of them by hours or days, and none contains a timing mechanism. A crowded market can stay crowded far longer than a leveraged position survives. Use these tools to adjust size and expectations, and leave entries to price.
How often should I check them?
Live reads suit a short check at the start of each session, and the weekly reports suit a weekend review. Anything more frequent adds screen time without adding information, because the underlying data has not changed. Consistency matters more than frequency here.
Are paid sentiment services worth the cost?
Judge them by what they add rather than by their presentation. Institutional flow data and option skew genuinely come from sources a retail trader cannot reach. Repackaged broker splits and survey summaries usually do not, and the free versions of those already exist.
Do these tools work the same on every pair?
No. Positioning data exists for the major currencies and thins out badly beyond them, and option volatility quotes follow the same pattern. Crosses without a liquid futures contract have almost no positioning history worth reading. For those pairs, price-based reads such as havens and barometer crosses do most of the work.
What about social media sentiment scores?
They measure chatter rather than money. Volume of posts tracks attention loosely, and attention differs from exposure. Some funds use text data seriously, with far better inputs than a public feed. Treat a free social score as entertainment until you have tested it against your own records.
Should a beginner bother with any of this?
Start with one read and one habit. Check a haven price before each session and note whether the mood looks calm or stressed. That single question improves position sizing more than a screen full of gauges, and it costs nothing to maintain.
How do I know whether any of this improves my results?
Record the readings beside each trade and review them in batches. Split your results by risk climate, then compare how your method behaved in calm conditions against stressed ones. Look at average loss size as well as the count of trades. Fifty trades hint at a pattern, and several hundred start to support a conclusion. Results are not guaranteed; past performance is not indicative of future results.
External references
- For background on this concept, see Risk Reversal at Investopedia.
- For broader market context, see The CBOE Put-Call Ratio in the BabyPips Forexpedia.
- The mechanism behind that index, and the limits of what it measures, is documented in VIX FAQs at Cboe.

About the author
Written by Dominic Walsh, a Forex trader and MT4/MT5 indicator, Expert Advisor and script developer. Every tool on forexmt4systems.com is tested on live charts before release and ships with ready-to-use compiled MT4 (.ex4) and MT5 (.ex5) files. Learn more about the trader and developer behind this site.
How we build, test and correct every tool: Editorial & Testing Policy. Trading carries risk; see the disclaimer.