
Type what is COT report into a search box and you meet two kinds of answer. One treats the file as a window into smart money, and the other treats it as noise.
Neither description survives contact with the document itself. So this guide walks through what the report contains, who compiles it, when it lands, and what it plainly cannot tell you.
What Is COT Report Data, Exactly?
COT stands for Commitments of Traders. The Commodity Futures Trading Commission publishes it every week, and it counts open positions in United States futures markets.
Note the word futures. The file covers exchange-listed contracts, not the over-the-counter spot market where most currency trading happens.

The panel above shows the shape of a typical week. Three groups sit around one zero line, some net long above it and some net short below it.
Three Groups, One Zero Line
The classic version splits traders into commercials, non-commercials and non-reportables. Each group holds longs and shorts, and the net figure simply subtracts one from the other.
Commercials hedge a business exposure. Non-commercials trade for speculative gain, and non-reportables sit below the reporting threshold entirely.
Net Position Is the Headline Number
Almost every chart you meet plots the net figure for one group. It answers a narrow question: across reporting traders in that category, does the long side or the short side dominate?
That number carries no price in it. A group can hold a huge net position at any level, so the chart tells you about crowding rather than about value.
Open Interest Sits Underneath
Open interest counts every contract still open in that market. It rises when new money enters and falls when traders close out.
Reading net position without open interest can mislead you. Our guide to open interest covers why the two belong together.
Who Gets Counted and How
The classification looks tidier on a chart than it is in practice. Understanding the plumbing keeps you from over-reading a category label.
The Reporting Threshold
Only traders holding more than a set number of contracts appear in the reportable columns. That level differs by contract and the Commission adjusts it over time.
Everyone below the threshold lands in the non-reportable bucket. That group therefore mixes small speculators with anyone whose position simply stayed modest.
Categories Come From Registration
A trader’s category reflects how the firm describes its own business. A bank hedging client flow files as a commercial, even when part of that book behaves speculatively.
So the labels approximate motive rather than measuring it. Treat commercial as a rough proxy for hedging, not as proof of it.
Clearing Members Supply the Data
Clearing members and futures commission merchants report positions upward. The Commission then aggregates them, applies the categories and prepares the file.

The flow above traces that path from Tuesday’s close to Friday’s release. Each stage adds a little time, and the total lag matters more than most articles admit.
Futures, Not Spot Forex
This distinction causes more confusion than any other. Currency futures trade on an exchange, mostly at the Chicago Mercantile Exchange, in standard contract sizes with a set expiry.
Spot forex works differently. It trades over the counter between banks, brokers and funds, with no central exchange and no public position register.

The chart above shows gold on a weekly scale. Gold is one of the markets the report genuinely covers, through the contract listed on a United States exchange rather than through the price drawn here.
How Big Is the Gap?
Global currency turnover runs into trillions of United States dollars a day across spot, forwards and swaps. Listed currency futures account for a small slice of that activity.
So the report samples a corner of the market. A useful corner, since the participants are large and the data is public, but a corner all the same.
Reading a Currency Contract
Each currency future quotes against the dollar. A long euro contract therefore expresses a long euro and short dollar view at the same time.
That makes dollar positioning readable across several contracts at once. Our note on the dollar index covers the same idea from the price side.
Why Hedgers Distort the Picture
A commercial holding a large short future may hold an offsetting exposure elsewhere. The report shows one leg and never shows the other.
So a record commercial short does not mean an institution expects a decline. It may simply mean a business locked in a price for something it already owns.
The Report Formats You Will Meet
The Commission publishes several versions. Picking the wrong one wastes an afternoon, so know which is which.
| Format | Categories used | Typical use |
|---|---|---|
| Legacy | Commercial, non-commercial, non-reportable | The version most charts and articles quote, available in futures only and futures plus options |
| Disaggregated | Producer or merchant, swap dealer, managed money, other reportable | Physical commodity markets, where the swap dealer split adds real information |
| Traders in Financial Futures | Dealer, asset manager, leveraged funds, other reportable | Currency, equity index and rate contracts, and the closest thing to a fund positioning read |
| Supplemental | Adds an index trader column | A set of agricultural contracts only |
For currencies, the financial futures version usually rewards the extra effort. Leveraged funds behave differently from asset managers, and the legacy file blends them together.
How to Read a Single Week
Open the file and four columns do the work. Longs, shorts, the change since last week and open interest.

The comparison above sets what the file contains against what readers often assume. Most disappointment with this data starts in the right-hand column.
Start With the Change
The weekly change tells you more than the absolute level. A group adding heavily to one side describes an active decision that week.
Levels drift slowly, so a static reading updates rarely. Changes give the series its texture.
Then Look at the History
A net figure means little without context. Compare it against the past year, then against the past three years, before calling anything extreme.
Some markets sit structurally net short in one category. In those cases, the level is normal and only the deviation carries information.
Finally, Check Open Interest
Rising open interest alongside a rising net long suggests fresh money entering. Falling open interest alongside the same move suggests one side closing out instead.
Those two situations look identical on a net position chart. They describe different market states, though, so the extra column earns its place.
Download the complete indicator database
Put these concepts on your charts. One email unlocks the full library of 1,380+ indicators with compiled MT4 and MT5 files, plus my TradingView scripts. No paywall, no spam, unsubscribe any time.
Get free access to my indicator database
One email unlocks 1,380+ free MT4, MT5 and TradingView indicators — the complete library. No single-tool download; you get the whole database.
The Timing Problem Nobody Advertises
Here sits the fact most introductions skip. Tuesday’s close supplies the snapshot, and the file goes out on Friday afternoon, Eastern time.
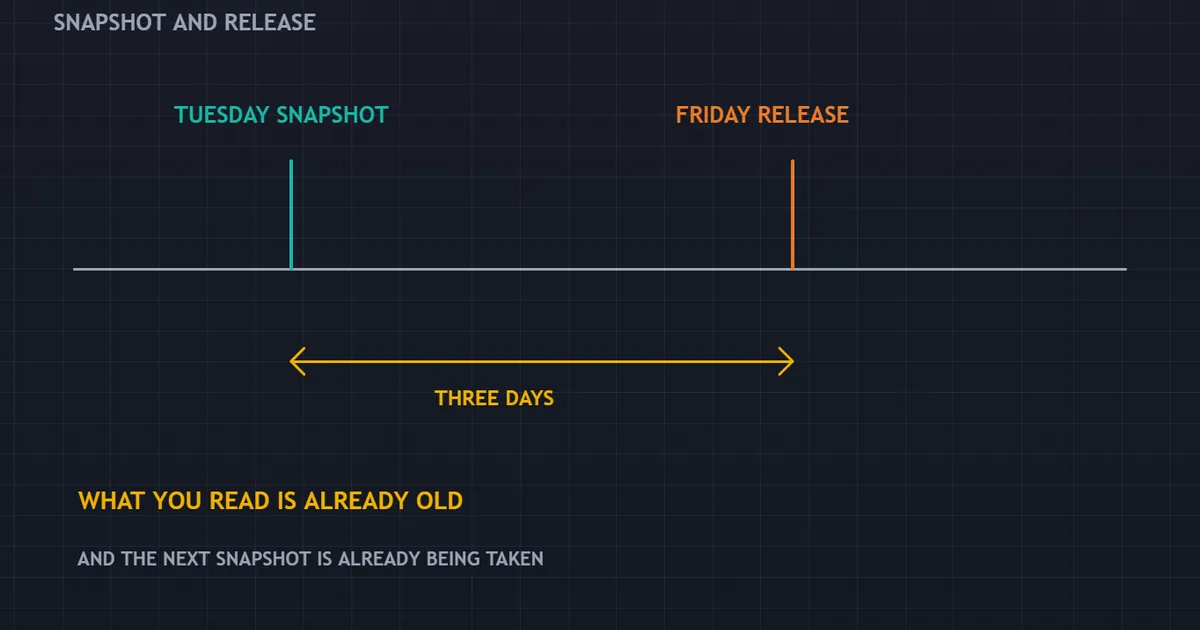
That panel marks both points on one timeline. Three days separate them, so the newest data you can read describes a market that has already moved on.
What Can Happen in Three Days
Plenty. A central bank meeting, an inflation print or a geopolitical shock can all land inside that window.
Large traders adjust quickly when they need to. The file will show that adjustment next Friday, not today.
The Lag Compounds Over a Week
By the following Wednesday, you are working from data that is more than a week old. That is fine for a slow structural read, and useless for a short-term decision.
Match your holding period to the data’s speed. A position held for hours has nothing to gain from a weekly positioning file.
Publication Can Slip
Holidays shift the release. Government shutdowns have delayed the series for weeks at a time, and the backlog then arrives in a burst.
Check the schedule rather than assuming it. Our economic calendar helps you place the release next to the events around it.
Where to Find the File
The Commission hosts every release on its own site. You pay nothing, and you need no account to read it.
Two shapes exist. One is a short text page, and the other is a long data file you can open in a sheet.
The Short Text Page
That page lists each market in turn. Under each one you see longs, shorts and the change since last week.
It reads well on screen. It also makes a poor base for your own history, since you must copy it by hand.
The Full Data File
The long file holds every market and every week in one place. Open it in a sheet and you can chart any column you like.
Start with one market and one column. A wall of numbers helps nobody in week one.
Charts Built by Other Sites
Many sites plot the series for you. That saves time, and it hides two choices you ought to make yourself.
They pick the report format, and they pick how much to smooth the line. Both choices change the shape of what you end up looking at.
The Columns in Plain Words
Here is the whole file, stripped of jargon. Seven terms cover it.
| Column | Plain meaning |
|---|---|
| Long | The number of contracts that group holds on the buy side in that market this week |
| Short | The number of contracts that group holds on the sell side in the same market |
| Net | Long minus short, the single figure most charts plot for one group |
| Change | How much each column moved since the snapshot one week earlier |
| Open interest | Every contract still open in that market, counted once rather than twice |
| Spreading | Contracts held long and short at the same time, usually across different expiry months |
| Non-reportable | Everything below the reporting level, worked out as the balance rather than counted directly |
Two Ways to Read the Same Week
Take a week where a fund group adds heavily to the long side. Two readings then sit in front of you.
The Careless Reading
Funds are long, so the currency should rise. That reading treats a count as a forecast.
It also ignores the lag. Those buys happened days ago, and price has already moved since then.
The Careful Reading
Funds added length into a rise, which is normal for that group. The crowd on that side is now larger than it was.
So a shock in the other direction would meet more sellers. That is a note about risk, not a call on price.
What You Write Down
One line will do. The long side grew, and the level now sits near the top of its past year.
Next week you check whether it grew again. Over time those lines build a picture that no single chart hands you.
What This Report Cannot Tell You
Being clear about the limits makes the data more useful, not less. Five things sit outside its reach entirely.
- Direction. The file counts contracts. It carries no forecast, and nothing in it says where a currency goes next.
- Intent. A position may hedge a business, express a view, or offset something the report never sees.
- Timing. A crowded reading can stay crowded for months, and it can grow more crowded before it unwinds.
- Spot exposure. Over-the-counter positions never enter the file, so the largest part of the currency market stays invisible.
- Leverage or pain. Contract counts say nothing about the capital behind them or the losses a group is carrying.
Treat the report as context rather than as an instruction. Context helps you frame a decision, and it never makes the decision for you.
Common Mistakes When Reading the File
Five errors account for most bad readings. Each one has a simple correction.
Calling It Forex Positioning
The data covers listed futures. Describing it as the market’s position overstates the coverage by a wide margin.
Treating Commercials as Smart Money
Hedgers are not forecasters. They lock in prices for business reasons, and their timing often looks poor precisely because timing was never the point.
Ignoring the Contract Size
A contract count is not a dollar amount. Different currencies carry different contract sizes, so raw net figures across markets do not compare directly.
Reading One Week in Isolation
Single weeks contain noise, rolls and expiry effects. A trend across several weeks means considerably more than any one print.
Expecting a Signal
This point deserves repeating because it causes real losses. Positioning describes the crowd, and a crowded position can become far more crowded before it turns. Our guide to using the COT report works through that problem properly.
A Sensible Weekly Routine
Fifteen minutes on a Saturday covers it. Consistency matters more than depth here.
Pull the Same Report Every Week
Pick one format and stay with it. Switching between legacy and financial futures versions makes your own history useless.
Save the numbers in a sheet as you go. Three months of your own records beat any chart you find online.
Record Three Numbers Per Market
Net position, the weekly change and open interest. Nothing else earns its place at the start.
Add columns later if a question demands them. Most people collect too much data and read none of it.
Write One Sentence of Interpretation
Force yourself to summarise what changed and what it might mean. Then note plainly where you could be wrong.
Review those sentences after a month. The exercise teaches you far more than the raw series does, and our note on reading the economic calendar pairs naturally with it.
Keep It Separate From Execution
Positioning belongs in your background notes, not in your entry rules. Chart-level decisions still come from price and from tools like our indicator library.
Mixing the two produces confusion under pressure. Slow context and fast execution work better when they stay in separate places.
How Long Before the Data Tells You Anything?
Give it three months at least. One week is noise, and a month is barely a sample.
Build Your Own Record
Write down the same three numbers each week. Then add one line on what you think they mean.
After twelve weeks you can look back. You will see how often your reading matched what price then did.
Keep the Day Fixed
Read it on the same day each week. Saturday works well, since the file is out and the market has closed.
A fixed slot beats a burst of effort. Skipping three weeks and then reading six at once teaches you very little.
Do Not Grade Yourself on Price
Your notes should ask whether the crowd grew or shrank. Whether price rose is a separate question.
Mixing the two turns a slow context tool into a scoring game. That habit ends in a forecast, and a forecast is exactly what this file cannot support.
Where Commercials and Non-Commercials Actually Differ
The two headline groups behave in opposite ways by design. Knowing why keeps you from reading either one badly.
Commercials Lean Against Price
Hedgers sell into strength and buy into weakness, because that is what hedging requires. Their net position therefore drifts against a long trend almost mechanically.
That pattern looks prophetic in hindsight at turning points. It looks disastrous through the middle of a strong trend, and both impressions come from the same behaviour.
Non-Commercials Lean With Price
Speculative money follows momentum more often than it fights it. Net length tends to build as a move extends.
So the two series usually mirror each other. A detailed treatment lives in our comparison of commercial and non-commercial traders.
Neither Group Is a Signal
Both groups contain skilled participants and both contain poor timing. Attaching a label like smart money to either one imports an assumption the data does not support.
Small Traders Are a Leftover, Not a Group
The third column holds everyone under the reporting level. Nobody counts those traders one by one.
Their figure comes out as a balance. Take open interest, subtract the reportable longs and shorts, and what remains lands in that column.
So the small trader line carries the most noise of the three. It also gets quoted the most often, usually as proof that the crowd is wrong.
Treat it gently. A number built from a subtraction deserves less weight than a number built from a count.
Any error in the other two columns lands here as well. That alone should slow you down before quoting it.
FAQ
What is COT report data used for in forex?
Traders use it as slow background context on how large futures participants are positioned in currency contracts. It suits weekly or monthly framing, since the snapshot is several days old before anyone reads it. It does not suit intraday decisions, and it covers listed futures rather than the much larger over-the-counter market.
Who publishes the COT report and when?
The Commodity Futures Trading Commission publishes it. The snapshot reflects positions at Tuesday’s close, and the file normally goes out on Friday afternoon, Eastern time. Holidays shift that schedule, and long delays have happened during government shutdowns.
Does the COT report cover spot forex?
No. It covers positions in exchange-listed futures and options, mostly on the Chicago exchanges. Spot forex trades over the counter with no central register, so nobody publishes an equivalent file for it. Currency futures positioning acts as a sample of large participant behaviour, nothing more.
Is a record net position a reversal signal?
No. An extreme reading tells you a position is crowded, which raises the potential for a sharp unwind at some point. It says nothing about when, and extremes routinely become more extreme first. Fading a crowded position on that basis alone is a way to lose money slowly.
Which report format should a forex trader use?
The Traders in Financial Futures version usually fits currencies best, because it separates leveraged funds from asset managers and dealers. The legacy version blends those participants into one non-commercial column. Whichever you choose, stay with it, so your own week-to-week comparisons stay valid.
Can positioning data improve my trading on its own?
On its own, rarely. It works better as one input beside price structure, the calendar and your own risk rules, and it works best over horizons measured in weeks. Treat any strong claim about positioning predicting the next move with scepticism, and test the idea on your own records before it touches your sizing. Results are not guaranteed; past performance is not indicative of future results.
External references
- For background on this concept, see Commitments of Traders at the CFTC.
- For broader market context, see Commitments of Traders on Wikipedia.

About the author
Written by Dominic Walsh, a Forex trader and MT4/MT5 indicator, Expert Advisor and script developer. Every tool on forexmt4systems.com is tested on live charts before release and ships with ready-to-use compiled MT4 (.ex4) and MT5 (.ex5) files. Learn more about the trader and developer behind this site.
How we build, test and correct every tool: Editorial & Testing Policy. Trading carries risk; see the disclaimer.