
Positioning data draws a large following in forex, and most of it rests on one distinction. The cot report commercial vs non commercial split separates hedgers from speculators in the futures market.
That split is genuinely useful. It is also slower, narrower and blunter than most articles admit, so this guide covers the mechanism first and the limits second.
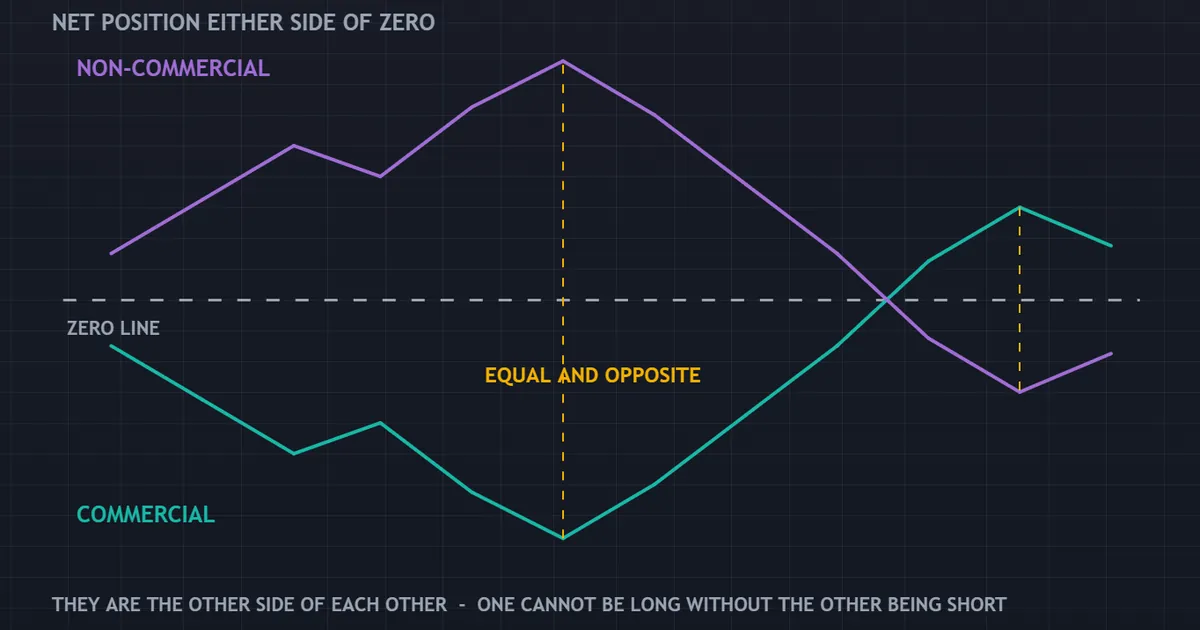
The panel above makes the first point visually. Two net position lines sit either side of a zero line, and they move as mirror images, because one group must hold what the other group sheds.
COT Report Commercial vs Non Commercial: What the Split Means
The Commodity Futures Trading Commission sorts large traders into categories. The legacy version of the report uses three of them.
Two carry the labels in the heading above. The third catches everyone too small to report.
Commercial Traders Hedge a Business
A commercial trader uses futures to offset an exposure that already exists. An airline locks in fuel cost. A miller locks in wheat cost. A bank offsets currency risk it took on elsewhere.
Their motive is not a forecast. They sell into strength and buy into weakness, because the cash side of the business pushes them that way.
So commercials often look contrarian. That appearance is a by-product of hedging, not a view on direction.
Non Commercial Traders Speculate
A non commercial trader holds futures for gain and nothing else. Managed futures funds, macro funds and large individual speculators all land in this bucket.
This group tends to follow trends. When a currency runs, their net position usually grows in the same direction.
That is the useful part. Their net figure is a rough gauge of how crowded a directional bet has become.
The Third Group Nobody Quotes
Below the reporting threshold sits everyone else. The CFTC calls these nonreportable positions, and the press calls them small traders.
Their number is a residual. It is whatever remains after the reportable categories, so treat it as arithmetic rather than insight.
Small does not mean wrong, either. The residual simply carries no information about who those traders are or why they hold what they hold.
How the Weekly File Reaches You
The production schedule matters more than the categories. Miss it and you will read stale numbers as if they were live ones.
- Tuesday close. The snapshot freezes at the end of Tuesday trading.
- Reporting firms file. Clearing members and brokers send position data to the CFTC.
- The CFTC compiles and checks. Categories, thresholds and contract markets all get sorted.
- Friday afternoon. The file appears publicly, usually at half past three Eastern time.
- You read it. By then the market has traded for three more days.
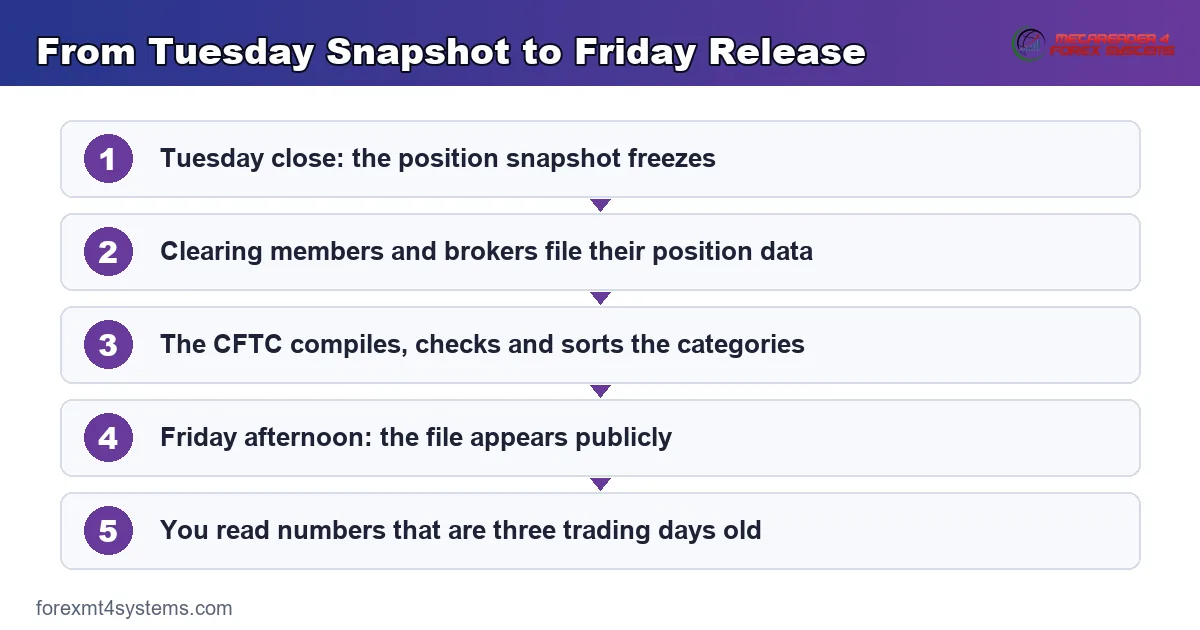
Step five is the honest one. A holiday week can push the release later still, so the gap between snapshot and reader sometimes stretches further.
Nothing about that schedule is a flaw. It only becomes a flaw when somebody treats a Friday file as a description of Friday.
Why the Two Lines Mirror Each Other
Futures are a closed system. Every long contract has a short contract facing it, so the net positions of all categories sum to zero.
That fact produces the shape in the first panel. When speculators build a large net long, somebody holds the matching short, and in most markets that somebody wears the commercial label.
So the two lines are not two independent opinions. They are one number seen from both sides.
This is where a lot of commentary goes wrong. Writers describe commercials as the smart money and speculators as the crowd, then treat the mirror as a signal.
The mirror is an accounting identity. It would appear even if both groups traded at random.
A Worked Example of a Crowded Bet
Numbers make this easier to hold on to. Take a currency contract with two hundred thousand contracts of open interest.
Say the speculative column shows a net long of forty thousand. That is a fifth of the market leaning one way.
Now let the same market grow to four hundred thousand contracts over five years. A net long of forty thousand is only a tenth of it.
The headline number has not moved at all. The crowding behind it has halved.
So a raw figure can hit a record while the pressure behind it falls. Divide by open interest and the record often disappears.
What a Stretched Reading Feels Like
Crowding shows up in behaviour as well as in a table. Good news stops lifting price. Bad news drops it hard.
That asymmetry is the practical tell. Once everyone who wanted the trade already holds it, only sellers are left to arrive.
Still, the timing stays unknown. The same asymmetry can run for weeks before anything breaks.
Futures, Not Spot Forex
Here is the point that most sentiment articles skip. The COT report covers regulated futures markets, and spot forex is not one of them.
Spot currency trades over the counter, across bank books and broker books that publish nothing. No central register of positions exists, so no equivalent file can exist either.
Currency futures do trade on a US exchange, and those contracts appear in the report. They are a slice of the currency market, not a census of it.
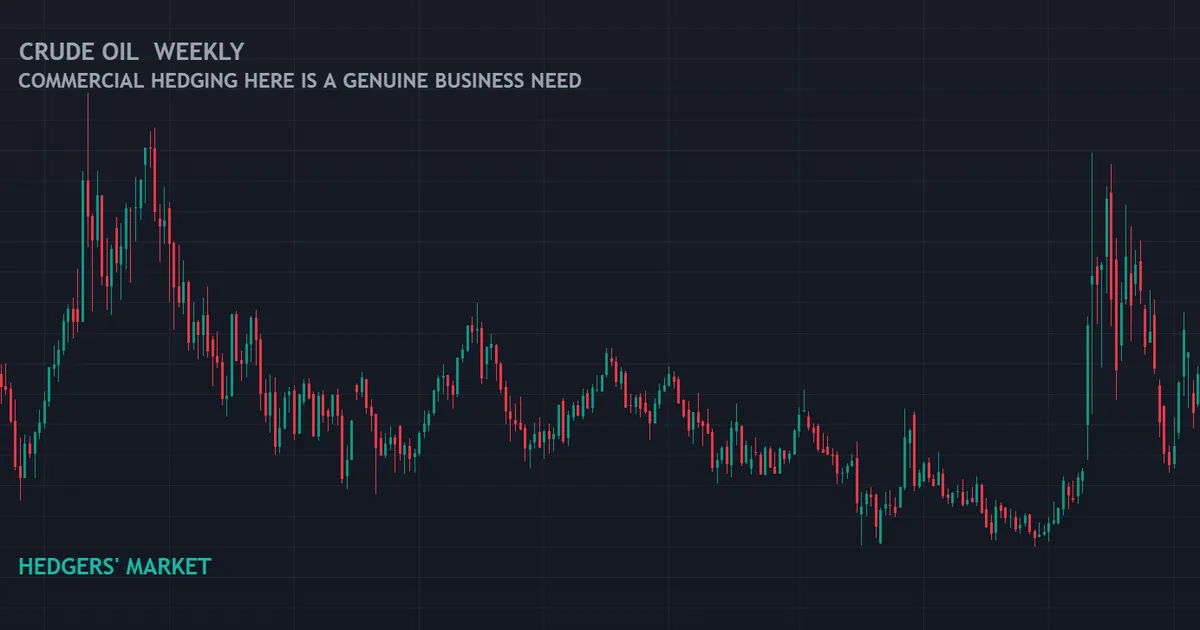
Crude oil weekly is the clearest place to see the commercial motive at work, which is why the chart above uses it rather than a currency. Producers and refiners hedge real barrels there, and their hedging need does not disappear when price moves against them.
Currencies work differently. The commercial bucket in a currency contract is dominated by dealers and banks, not by producers with physical inventory.
What the Currency Contracts Actually Show
Currency futures quote against the dollar in almost every case. A net long euro futures position is therefore a short dollar position wearing a different hat.
That makes the report a dollar sentiment tool as much as a single currency tool. Line the majors up together and the common factor usually stands out.
Legacy Report or Financial Futures Report
Two versions cover currency contracts. The legacy report gives you the familiar commercial and non commercial columns.
The Traders in Financial Futures report splits the same market four ways instead: dealers, asset managers, leveraged funds and other reportables. Leveraged funds is the closest thing to the speculator column, and asset managers behave very differently.
Read both if you have time. The finer split explains a surprising amount of what the legacy version blurs together.
Contracts, Not Money
Positioning appears in contracts. It does not appear in exposure, in leverage, or in the size of the account behind it.
So a record net long tells you about contract counts. Open interest has grown over decades, which means old records and new records are not strictly comparable.
Normalise before you compare. Many analysts express the net figure as a share of total open interest for exactly that reason.
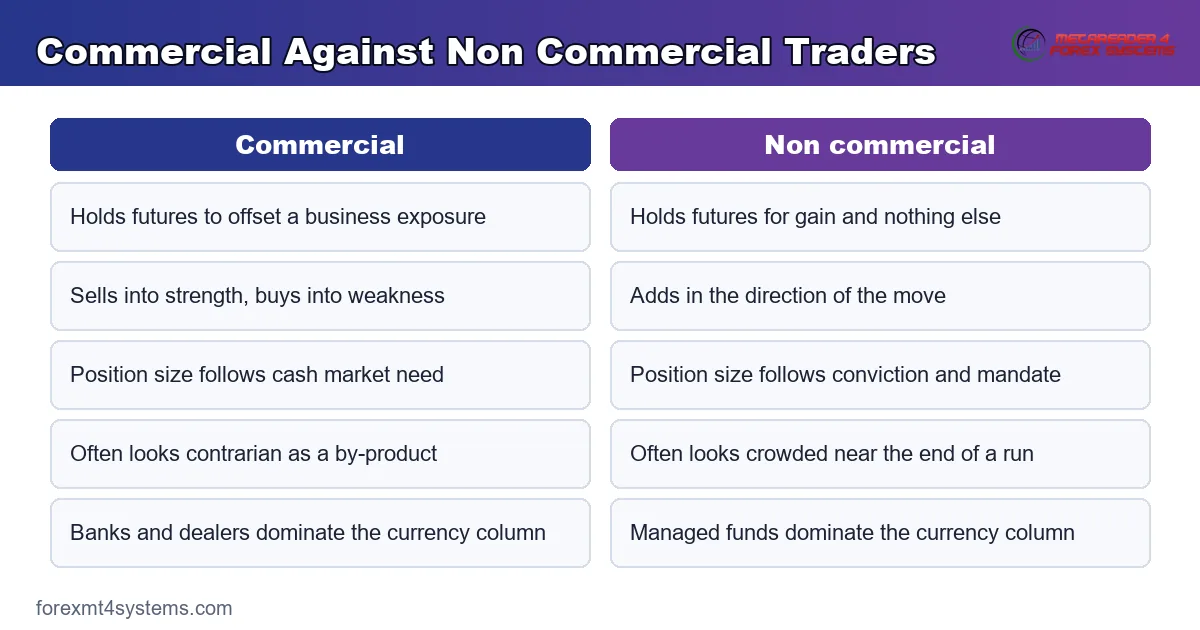
The comparison above sets the two groups side by side on motive, behaviour and timing. Read it as a description of incentives, never as a ranking of who is right.
Reading Positioning Without Fooling Yourself
Positioning is context. It tells you where the crowd already sits, and it says nothing about the next move.
An Extreme Can Get More Extreme
This is the failure that costs the most money. A crowded speculative long can grow for months after it first looks stretched.
Fading a crowded reading is a bet on timing, and the data offers no timing. Traders who tried it in the strong dollar stretches of recent decades will recognise the feeling.
So treat an extreme as a warning about position size, not as an entry. The reading changes how much you risk far more usefully than it changes your direction.
The Data Is Late by Design
Three trading days pass between the snapshot and your screen. In a quiet week that barely matters, and in a central bank week it matters a great deal.
Check what happened after Tuesday before you act on anything. A sharp Thursday reversal can invalidate the file before you open it.
One Week Means Very Little
The change matters more than the level. A single weekly print sits inside a lot of noise, so most readers smooth it or watch the trend across several weeks.
Extremes are relative, too. A net long that looks huge against one year of history can look ordinary against five.
Download the complete indicator database
Put these concepts on your charts. One email unlocks the full library of 1,380+ indicators with compiled MT4 and MT5 files, plus my TradingView scripts. No paywall, no spam, unsubscribe any time.
Get free access to my indicator database
One email unlocks 1,380+ free MT4, MT5 and TradingView indicators — the complete library. No single-tool download; you get the whole database.
Who Hedges and Who Speculates
Categories are easier to remember as roles. Three roles cover almost every position in a futures market.
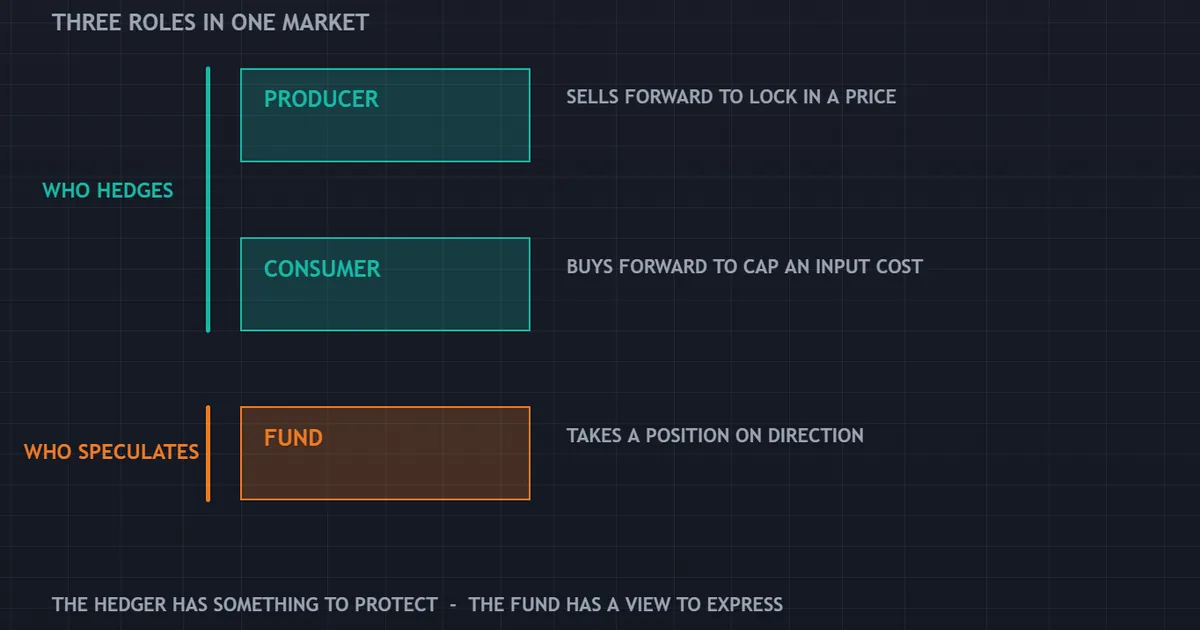
Producers sell forward to protect revenue. A consumer buys forward to protect input cost, and a fund takes the other side because it wants the price risk.
Each role generates a different pattern of behaviour. The producer keeps selling into rallies whatever the chart says, while the fund needs a reason and usually finds it in momentum.
Currency markets blur these roles. Banks and dealers sit in the commercial column while running positions that look nothing like a farmer’s hedge.
A Weekly Routine That Fits the Data
Slow data suits a slow routine. Fifteen minutes once a week is enough for most traders.
Saturday, Not Friday Night
Give yourself a day. Reading the file after the weekly close removes the urge to act on it immediately.
Pull the net figure for the currencies you trade. Then note the change from last week, and nothing else.
Write the Number Down
Keep the readings in one place over time. A simple log turns a weekly number into a series, and only a series shows you an extreme.
Our trade journal works for this as well as for trades. Add a positioning column and the context sits beside your own decisions.
Pair It With the Calendar
Positioning explains the fuel. The calendar explains the spark, so the two belong together.
Check the week ahead in our economic calendar before you draw any conclusion. A crowded position into a policy meeting is a very different situation from the same reading into a quiet week.
How Positioning Interacts With Price
The same reading means different things at different points in a move. Three stages cover most of it.
Early in a Trend
The speculative net grows from a low base. Price rises, and the position rises with it.
Little to fade at that stage. The move still has room, because most of the money has yet to commit.
Late in a Trend
Now the net figure flattens near the top of its own range. Price edges higher, and each push finds fewer new buyers.
Watch for the split between the two. Price sets a new high while the net position refuses to follow.
The Unwind
When a crowded position turns, it can turn quickly. Speculators leave through the same door, so the move often looks larger than the news behind it.
Nobody can call that date in advance. You can only note that the fuel is there.
Finding and Reading the File Itself
The CFTC posts the data on its own site each week. Short format text, long format text and spreadsheets all sit together.
Start with the short format for a single market. It fits on one page, and the columns carry plain labels.
The Columns That Matter
Look for long, short and the change from the week before. Net is simply long minus short, and most sites work it out for you.
Spreading gets its own column. It counts contracts held long and short at once in different months, so it says nothing about direction.
Put It Under a Chart
A table is hard to judge by eye. Plot the net figure below price and the relationship shows up in seconds.
Several charting platforms carry the series already. If yours does not, a weekly spreadsheet does the job well enough.
What the Report Cannot Show
Four blind spots sit inside the data. Each one is structural, so no amount of care removes it.
Hedges Held Somewhere Else
A fund can hold futures against an options book, a bond position or a share portfolio. The file shows the futures leg on its own.
So a large net short is not always a bearish view. Sometimes it is the hedge on something the file never sees.
Everything That Happens Midweek
Positions change every day. The file keeps one moment each week and drops the rest.
Conviction Behind the Contracts
Two funds can hold identical contract counts with completely different plans. One sits for a year, and the other leaves on Monday morning.
The Rest of the Currency Market
Futures are a small share of daily currency turnover. Most trading happens between banks and their clients, where nobody reports a position to anyone.
Common Mistakes With This Report
Five errors account for most of the damage. Each has a plain correction.
Treating Commercials as Smart Money
Hedgers are not forecasters. They are businesses managing an exposure, and their position often loses money on purpose, because the cash side gains.
Applying It to Spot Pairs Directly
Futures positioning is a proxy for the wider market. Useful, yes, and complete, no.
Chasing the Record Headline
Records make good copy. Without normalising for open interest they mostly measure how much the market has grown.
Ignoring the Three-Day Gap
Read the price action between Tuesday and Friday first. The file describes a market that no longer exists in quite that form.
Reading the Label Instead of the Behaviour
The category name is a regulatory classification, not a description of skill. A firm lands in the commercial column because of what it does for a living, and that is all the label promises.
So watch what a column does across several weeks. Behaviour over time tells you far more than the word at the top of it.
Using It Alone
Positioning answers one question: how crowded is this? Combine it with our notes on what open interest measures and with price itself, or the reading floats free of anything testable.
Positioning Is Not Retail Sentiment
Two very different numbers both get called sentiment. Keep them apart.
The COT file measures large futures traders on a regulated exchange. A broker’s long-short split measures that broker’s own clients and nobody else.
One is a weekly regulatory return with published rules. The other is a snapshot of one company’s book, and it will differ from the next company’s.
Different Crowd, Different Meaning
Retail books tend to lean against trends. Futures speculators tend to lean with them, so the two readings often point opposite ways on the same day.
Neither one is the market. Both describe a subset, and those subsets barely overlap.
Our guide to retail sentiment in forex covers the broker side properly. Read the two together and the picture gets wider than either gives alone.
Three Questions Before You Act on a Reading
Positioning invites quick conclusions. These three questions slow them down.
How Crowded Is It Really?
Express the net figure as a share of open interest first. Then compare it with several years of its own history, because a record in raw contracts is often ordinary once you scale it.
What Happened After Tuesday?
Pull up the chart for Wednesday, Thursday and Friday. A sharp move inside that window may already have flushed out the position the file describes.
What Would Change My Mind?
Write that answer down before you place anything. A crowded reading with no invalidation level is only an opinion with a chart attached to it.
Then size the trade to fit the answer. Our position size calculator turns a stop distance into a lot size in a few seconds, which keeps a context read from quietly becoming an oversized bet.
Where This Fits in a Wider Sentiment Read
No single input decides anything. Positioning is one of four or five, and it happens to be the slowest.
Volatility measures fear in near real time. Retail broker splits describe one book of business. Flows into safe assets describe institutional caution.
Our guide to what the COT report is covers the file itself in more detail, and the walkthrough on how to use the COT report takes it step by step. For the currencies that respond most to commodity hedging flows, our note on commodity currencies is the natural next stop.
If you want chart tools that plot this kind of context alongside price, the indicator library is the place to browse. Use them as inputs, never as answers.
FAQ
Does the COT report cover spot forex?
No. It covers futures and options on regulated US exchanges, and spot forex trades over the counter with no central position register. Currency futures give you a proxy for institutional positioning, and that proxy is a slice of a far larger market.
When is the data from, and when does it appear?
The snapshot freezes at Tuesday’s close. The CFTC publishes it on Friday afternoon, usually at half past three Eastern time, so the numbers are already three trading days old when you read them. Holiday weeks can push the release back further.
Should I fade an extreme in non commercial positioning?
Not on the reading alone. A crowded position can become more crowded for months, and the report gives you no timing at all. Most traders get more value from using an extreme to reduce size than from using it to pick a turn.
Which version should a currency trader read?
Start with the legacy report for the familiar two-column split, then look at the Traders in Financial Futures version. It separates leveraged funds from asset managers, and those two groups often move in opposite directions inside the single non commercial number.
Why do commercials and speculators always move in opposite directions?
Because futures are a closed system. Every long contract faces a short contract, so the net positions across all categories add up to zero. The mirror image in the charts is an accounting identity, and it would appear even if both groups traded at random.
Can positioning data time an entry?
It cannot. Positioning is weekly, lagging and partial, so it belongs in the same box as any other slow context input. Use it to judge how crowded a trade already is, then let your own rules handle entry, exit and size. Results are not guaranteed; past performance is not indicative of future results.
External references
- For background on this concept, see Commitments of Traders Explanatory Notes at the CFTC.
- For broader market context, see Commercial Corporations in the BabyPips Forexpedia.

About the author
Written by Dominic Walsh, a Forex trader and MT4/MT5 indicator, Expert Advisor and script developer. Every tool on forexmt4systems.com is tested on live charts before release and ships with ready-to-use compiled MT4 (.ex4) and MT5 (.ex5) files. Learn more about the trader and developer behind this site.
How we build, test and correct every tool: Editorial & Testing Policy. Trading carries risk; see the disclaimer.