
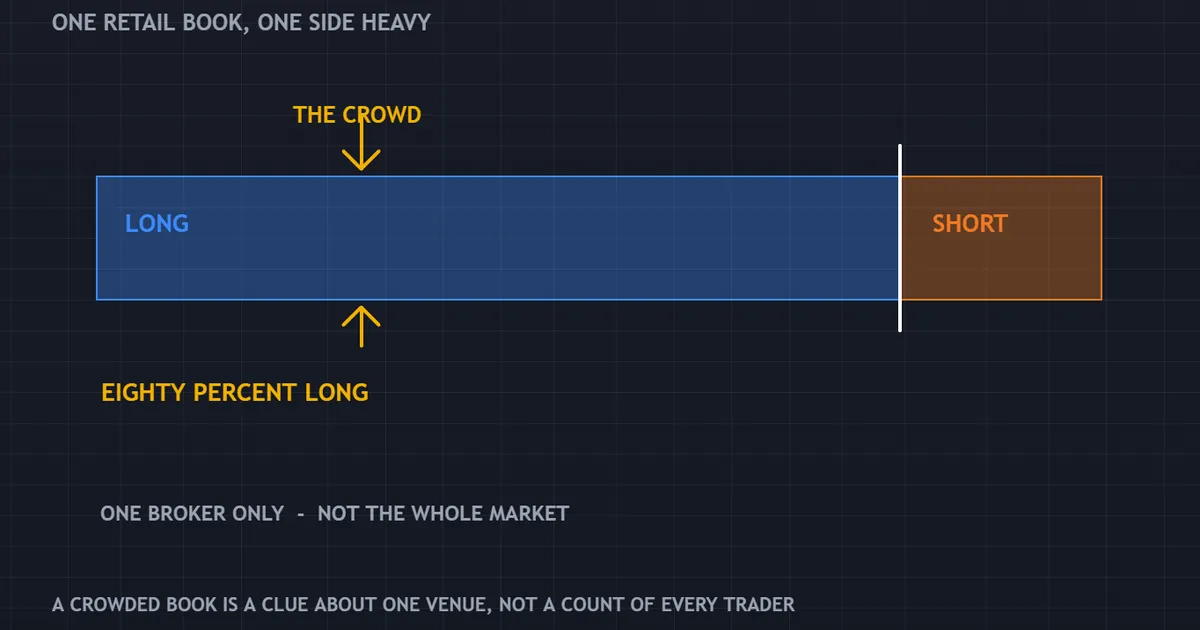
Most retail brokers publish a long-short split for their own clients. When four traders in five sit on the same side, the chart usually tells a different story.
That gap explains the pull of retail sentiment in forex. It works as a crowd meter rather than a signal, and the difference matters far more than most articles admit.
What Retail Sentiment in Forex Actually Measures
A sentiment feed counts live positions inside one broker’s client book. Then it reports the share sitting long against the share sitting short.
So the number describes a group of traders, not the market. One broker’s book is a sample, and a small one at that.
Interbank turnover in currencies runs into trillions each day. Retail accounts contribute a sliver of that, spread across hundreds of firms.
What the Percentage Counts
Most feeds count positions rather than money. Two hundred tiny longs and two huge shorts can still print as ninety-nine percent long.
Other feeds weight by volume instead. So read the methodology note before you compare one provider with another.
Then check how often the figure refreshes. A number updated twice a day describes a market that moved on hours ago.
Why Brokers Publish It
Sentiment data pulls traffic, and traffic brings new accounts. That is a fair motive, though it shapes what appears on the page.
Nobody promotes the dull middle. Feeds highlight the extremes, because a sixty-forty split makes for weak marketing.
The Sample Problem in One Line
Each broker sees only its own clients, and those clients differ by region, leverage cap and account size. Two feeds can disagree on the same pair in the same hour.
Treat any single feed as one opinion poll with a small panel. Our guide to market sentiment in forex covers the wider set of inputs that surround it.
Where the Numbers Come From
Three sources dominate, and they measure quite different things. Mixing them up is the first mistake.
Broker Client Books
These are the familiar long-short percentages. They cover spot positions held by retail clients at one firm, updated through the day.
Coverage is narrow but current. That combination makes them useful for short horizons and useless for anything structural.
Compare two providers on the same pair for a week. The gap between them is a fair measure of how much noise a single feed carries.
Futures Positioning
The Commitments of Traders report covers currency futures, not spot forex. The CFTC takes the snapshot on a Tuesday and releases it on the Friday.
So the figures you read are already several days old. Our breakdown of the COT report works through the categories and the lag in detail.
Order Book Snapshots
A few platforms show pending orders clustered above and below price. That view hints at where stops and limits sit.
Again, it covers one venue only. Still, it answers a different question from the long-short split, so the two sit well together.
The Contrarian Idea, Stated Honestly
The theory is simple. A crowded position holds fuel, because every trader already long has to sell eventually.
When almost everyone leans one way, buying pressure has largely spent itself. Then a small push against the crowd triggers exits, and those exits push price further.
That mechanism is real. Short squeezes and long liquidations happen exactly like this in every market with leverage.
Notice what the idea rests on, though. It needs the crowd to be leveraged, visible and forced out, and only the first of those three is certain.

Why It Is Not a System
A crowded reading tells you about supply and demand for exits. It says nothing about timing, and timing decides whether you survive the trade.
An extreme can also get more extreme. Eighty percent long can become ninety percent long while price grinds another two hundred pips against the crowd.
So the honest framing is a condition, not a trigger. It changes what you look for, not what you click.
The Missing Half of the Book
Every retail long has a counterparty. That side may be the broker’s own book, a liquidity provider or a hedger with a very different motive.
Nobody publishes that half. Fading the visible side means guessing about the invisible one.
How the Unwind Actually Happens
Crowded positions rarely unwind politely. The sequence is mechanical, and it repeats across every leveraged market.

Stage One: Quiet Accumulation
Price drifts gently against the crowd while the reading climbs. Nobody feels much pain yet, so nobody closes.
Losses at this stage look like normal noise. That is exactly why the position keeps growing instead of shrinking.
Stage Two: Margin Pressure
Then a faster move lands, and account equity falls towards the maintenance level. Some traders add funds, others cut, and a few hit an automatic close.
Those forced exits are orders in the same direction as the move. So the move accelerates without a single new opinion behind it.
Stage Three: The Flush
The last stretch tends to be quick and ugly. Stops fill in clusters, spread widens, and the reading swings back towards balance within hours.
Anyone who faded early sat through stages one and two first. That is the part most sentiment write-ups quietly skip.
Why the Shape Repeats
Leverage compresses the time available to be wrong. So the same pattern turns up in currencies, index futures and crypto alike, with different labels attached.
Knowing the shape does not date it. You still need price to tell you which stage the market has reached.
Why the Broker Model Matters
The feed you read comes from a firm with exposure of its own. That does not make the number dishonest, though it does shape what it covers.
Where the Other Side Sits
Some brokers pass client orders straight out to liquidity providers. Others hold a share of them internally and manage the net exposure themselves.
A published long-short split describes client positions under either model. The firm’s own hedging never appears in it.
What That Changes for You
Very little, provided you read the number as a client survey. Trouble starts when traders treat it as a window onto institutional flow.
It is close to the opposite of institutional flow. The clue sits in the name of the feed.
When Fading the Crowd Adds Something
Certain conditions raise the odds that a crowded reading matters. None of them turn it into a standalone method.
Extremes That Persist
A single day at eighty percent long means little. Two weeks there, while price falls the whole time, describes a crowd that keeps averaging into a loser.
Persistence is the quality worth tracking. Take a daily note of the reading and watch its shape over a month.
Agreement With Another Read
A crowded retail position matters more when futures positioning leans the same way. Two independent samples pointing at the same imbalance is a stronger statement than one.
Volatility helps too. Rising volatility with a one-sided book usually means somebody is already under pressure.
A Level Price Has to Break
Crowded readings often cluster around obvious levels, because obvious levels attract obvious entries. So the exits cluster there as well.
Then the fade becomes a normal trade with normal risk. You need a level, an invalidation point and a reason to act today rather than next week.
When Fading the Crowd Fails
The failures follow a pattern, and it is worth naming them plainly.
Strong Trends
Retail books tilt against trends by habit. Traders sell strength and buy weakness, so a long trend keeps the crowd short for months.
Fading that crowd means buying with the trend, which is fine. Fading it in reverse, by selling because everyone is short, walks straight into the move.
Policy-Driven Moves
When a central bank shifts course, positioning stops mattering for a while. Rate expectations reprice, and the crowd is simply irrelevant to that flow.
Check the calendar before you fade anything. Our economic calendar flags the releases that override sentiment entirely.
The Slow Bleed
Sometimes the crowd is early rather than wrong. Price drifts for weeks, the reading stays extreme, and your fade dies from a thousand small costs.
Swaps, spread and time all take a share. A trade that is right in month three can still close in month one.
Building a Rule Around a Sentiment Reading
If you use this data, use it as a filter. A filter removes trades; it does not create them.
- Define the extreme in advance. Pick a threshold, such as seventy-five percent on one side, and write it down before you look at the chart.
- Require persistence. Demand three consecutive daily readings above that threshold, so a single noisy print cannot start a trade.
- Wait for price to confirm. A break of the level the crowd has been defending is your entry trigger, not the percentage itself.
- Set invalidation first. Place the stop where the crowded position would be proven right, then size the trade from that distance.
- Cap the exposure. Sentiment trades cluster across correlated pairs, so treat them as one position rather than four.
- Log the outcome either way. Record the reading, the trigger, the result and whether the extreme deepened before it broke.
That last step is the whole exercise. Without a record you are collecting impressions, and impressions favour the trades you remember.

Position Sizing and the Cost of Being Early
Fading a crowd puts you against momentum by design. So the sizing question is sharper here than in a trend trade.
Size for the Wider Stop
A sensible invalidation point sits beyond the extreme, and extremes stretch. That means a wider stop and therefore a smaller position.
Work the maths before the trade with our position size calculator. Then accept the smaller size instead of tightening the stop to justify a larger one.
Scaling In Is a Trap Here
Adding to a losing fade copies the behaviour of the crowd you are fading. The arithmetic is identical, and so is the failure mode.
Decide your total risk once. Splitting an entry is fine; expanding the total after price moves against you is not.
Correlation Multiplies the Bet
Retail books tilt the same way across pairs that share a currency. Three fades against the same currency form one large trade wearing three names.
Check the overlap with our currency strength meter before you open the second one.
Download the complete indicator database
Put these concepts on your charts. One email unlocks the full library of 1,380+ indicators with compiled MT4 and MT5 files, plus my TradingView scripts. No paywall, no spam, unsubscribe any time.
Get free access to my indicator database
One email unlocks 1,380+ free MT4, MT5 and TradingView indicators — the complete library. No single-tool download; you get the whole database.
What This Data Cannot Tell You
Being clear about the limits is what separates a useful filter from a superstition.
| Question | Can a retail long-short feed answer it? |
|---|---|
| Which way will this pair go? | No. It describes current positioning, not future direction. |
| Is the whole market long? | No. It covers one broker’s clients and nobody else. |
| How much money sits on each side? | Usually not. Most feeds count positions, not size. |
| Are those positions hedged elsewhere? | No. A short here may offset a long somewhere else. |
| When will the crowd give up? | No. Margin pressure decides that, and you cannot see it. |
| Is the extreme getting worse? | Yes, if you track the reading over time rather than glancing once. |
Read that table again before you build anything on a single percentage. The one useful column is the last row, and it needs a daily record.

Reading the Feed Over Time
A single glance at a percentage teaches very little. The shape of the series over weeks holds most of the useful information.
Keep Your Own History
Most feeds show today and almost nothing else. So record the daily figure yourself in a spreadsheet, one row per pair.
After a month you can see the resting range for each pair. Then an extreme starts to mean something, because you finally have a baseline.
Watch the Direction of Change
A reading falling from eighty-five towards seventy tells a different story from one climbing to seventy. One crowd is leaving, and the other is arriving.
Direction usually matters more than level. A crowd already heading for the exit has less fuel left to burn.
Pair It With Price, Not With Hope
Plot the reading beside the daily close. Look for stretches where price and positioning move apart, since that divergence is the condition worth studying.
Then mark what happened next on each occasion. Twenty marked episodes will teach you more than any rule of thumb copied from a forum.
A Checklist Before You Fade Anything
Six questions, answered in order, filter out most bad fades.
Is the Reading Actually Extreme?
Compare today with the past three months of the same feed. Some pairs sit at seventy percent long as a resting state, so that level means nothing there.
Has Price Stopped Rewarding the Crowd?
An extreme with price still moving in the crowd’s favour is just a trend with passengers. Wait until the market stops paying them.
Is There an Event in the Way?
Central bank meetings and inflation prints reset positioning within minutes. Trading into one turns your filter into noise.
Where Is Invalidation?
If you cannot name the price that proves the fade wrong, you do not have a trade. You have an opinion about other people.
Does Anything Else Agree?
Futures positioning, volatility and a clean technical level are the usual companions. One supporting read is enough; none is a warning.
Will You Log It?
Keep the reading and the outcome in your trading journal. Twenty entries beat any article on whether this data helps your method.
Common Mistakes
Five habits ruin an otherwise reasonable filter.
Treating One Feed as the Market
The percentage belongs to one broker. Say that out loud each time you look at it, because the framing does the damage.
Fading Every Extreme
Extremes appear constantly across dozens of pairs. Trading all of them converts a filter into a machine for taking the other side of trends.
Ignoring the Trend
A crowd that is short during a long uptrend is not a signal to sell. It is a group of traders being run over, and joining them is not contrarian.
Sizing Up Because the Reading Is Strong
Conviction from a percentage is borrowed conviction. Keep the risk per trade fixed, as our note on risk per trade explains.
Forgetting the Cost of Waiting
Fades often need patience, and patience has a price in swaps and spread. Count that cost before you commit to holding for weeks.
Carry works against you surprisingly often here, because the crowd tends to pile into the side that earns interest. So the contrarian sits on the side that pays it.
Where Sentiment Sits in a Method
Think of it as one line in a wider read, alongside volatility, positioning and the calendar. Our guide on how to read market sentiment assembles the full stack.
For chart-side tools that mark the levels where crowded positions tend to break, browse the MetaTrader indicators library. Levels and volatility measures do the timing work that a percentage cannot.
In short, the crowd meter tells you what other traders have already done. Price still decides what happens next.
FAQ
Does trading against retail sentiment work?
Sometimes, and never on its own. The mechanism behind it is real, because crowded positions must eventually unwind and those exits move price. But the reading carries no timing information, so a fade without a level and a stop is a coin toss with costs attached. Treat it as a filter that removes trades rather than a trigger that starts them.
How reliable is a broker’s long-short percentage?
It is reliable as a description of that broker’s clients and nothing more. Coverage differs by region, leverage rules and account size, so two feeds can disagree on the same pair at the same moment. Check whether the provider counts positions or volume, and check how often the figure updates.
Is the COT report the same thing as retail sentiment?
No. The COT report covers currency futures rather than spot forex, and it groups participants by category instead of by account type. The snapshot is taken on a Tuesday and published on the Friday, so it lags by several days. Retail feeds are current but narrow; COT is broad but slow.
What percentage counts as an extreme?
There is no fixed number, which is why comparing against the same feed’s own history matters. Some pairs sit near seventy percent long as a normal state, so that level says nothing there. Pick a threshold, check it against the past three months, and demand that it persists for several days.
Can I automate a sentiment fade?
You can automate the mechanics, though the data pipeline is the hard part. Feeds update slowly, formats change without notice, and history is rarely available for testing. Any rule built on a few months of readings rests on a very small sample, so keep expectations modest and the position size small.
Why do retail traders end up so one-sided?
Two habits do most of it. Traders take profits quickly and hold losers, which leaves the losing side open and visible in the data. They also prefer buying dips and selling rallies, so a sustained trend automatically parks the crowd on the wrong side of it.
Should I use sentiment on every pair?
No. Restrict it to liquid pairs where the feed has enough accounts to mean anything. Exotic pairs produce jumpy percentages from a handful of positions, and those swings look dramatic while carrying no information at all.
Do institutions look at retail positioning?
Some desks watch it, mainly as one input among dozens. They are not waiting for a broker’s client percentage to tell them what to do, though a very lopsided retail book does flag where stops may sit. The idea that a percentage on a public page steers large flow gets the causation backwards.
Which pairs give the cleanest readings?
Majors with deep participation give the steadiest series, simply because more accounts feed the average. A crowded reading there reflects a genuine tilt across thousands of positions. On thin crosses the figure can jump twenty points overnight on a handful of trades, so the swings look meaningful while carrying nothing.
How long should I test this before trusting it?
Longer than feels comfortable. Record the reading, the trigger, the outcome and whether the extreme deepened first, then review after fifty trades rather than five. A short sample will flatter or condemn the idea at random. Results are not guaranteed; past performance is not indicative of future results.
External references
- For background on this concept, see Sentiment Indicator at Investopedia.
- For broader market context, see Short Squeeze on Wikipedia.
- The Tuesday snapshot and Friday release timing described above is published in Commitments of Traders Release Schedule at the CFTC.

About the author
Written by Dominic Walsh, a Forex trader and MT4/MT5 indicator, Expert Advisor and script developer. Every tool on forexmt4systems.com is tested on live charts before release and ships with ready-to-use compiled MT4 (.ex4) and MT5 (.ex5) files. Learn more about the trader and developer behind this site.
How we build, test and correct every tool: Editorial & Testing Policy. Trading carries risk; see the disclaimer.