
Most guides on how to read market sentiment hand you a gauge and a promise. The gauge is real, and the promise is not, because sentiment describes the mood of a market rather than its next move.
This guide treats it as a reading skill instead. Four inputs, one honest score, and a clear list of the things the score cannot do for you.
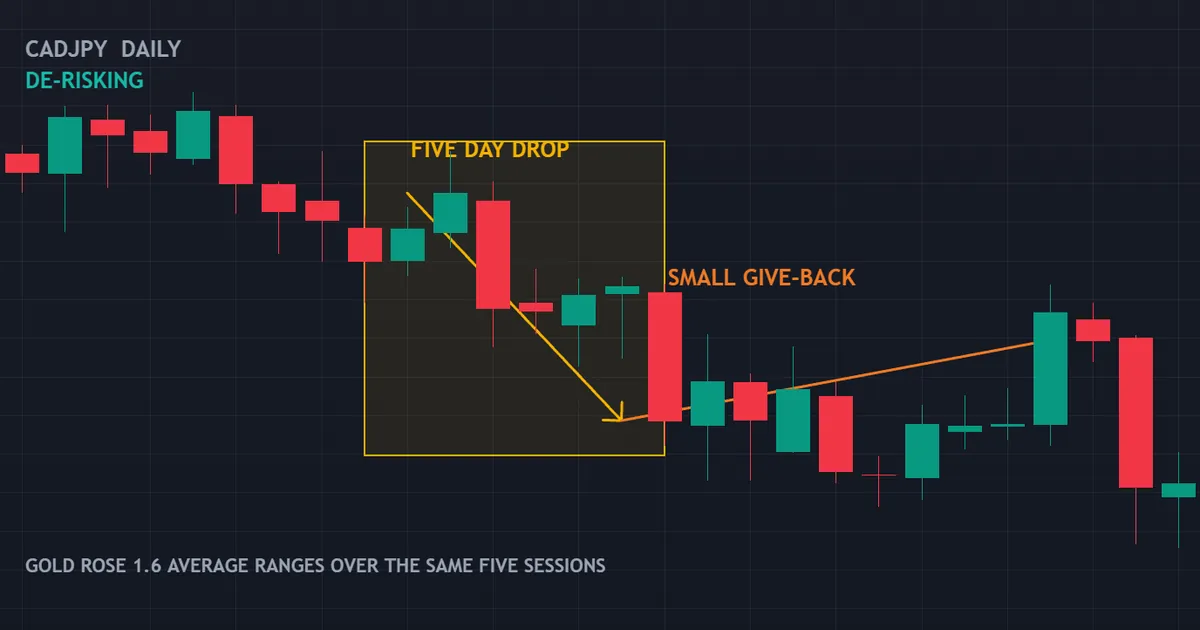
Over 5 days to 2026-06-16, CADJPY moved 2.2 ATR lower while gold moved 1.6 ATR higher — the classic de-risking signature. Over the following 10 bars CADJPY gave part of it back by 0.8 ATR.
Both legs were measured across the same five sessions. A commodity currency fell against the yen while gold rose, and the two moves lined up in time.
That is what a sentiment reading looks like in practice. No forecast appears anywhere in it, and the give-back afterwards was modest, which itself tells you the mood shift had some staying power.
How to Read Market Sentiment: The Four Inputs
Sentiment is not one number. It is a small stack of separate readings that sometimes agree.
Four inputs cover almost everything worth watching. Each answers a different question, and each has a weakness.
Positioning
Positioning answers one question: how crowded is this already? The best public source is the weekly futures file from the CFTC.
The snapshot freezes on Tuesday and appears on Friday afternoon. So the numbers are three trading days old before anyone reads them.
It also covers futures, not spot forex. Spot currency trades over the counter, where no central position register exists at all.
Volatility
Volatility answers how nervous the market is right now. Equity volatility indices update through the day, so this input is the fastest of the four.
Implied volatility in currency options does the same job for FX directly. A jump in short-dated implied volatility says traders expect a wider range soon.
Flows You Can See in Price
Some prices act as sentiment instruments themselves. Gold, government bonds, the yen crosses and the dollar index all fall into that group.
These update continuously and need no report. They are the reason a chart can tell you the mood before any commentary does.
Surveys and Broker Splits
Surveys and retail long-short splits complete the set. Both describe a defined group of people rather than the market as a whole.
A broker’s split shows that broker’s own clients. Another broker will publish a different figure on the same day, so never call one of them the market.
Step One: Fix the Question Before You Look
Vague questions produce confirmation. Decide what you actually want to know first.
Two questions cover most needs. Is the market defensive or confident right now, and how crowded is the trade I am considering?
Why the Order Matters
Traders usually open the chart, form a view, then hunt for sentiment that agrees. That sequence produces agreement every time and teaches you nothing.
Write the question down before the first chart loads. It takes ten seconds and changes what you notice.
Set a Time Horizon
Sentiment inputs run at different speeds. Positioning is weekly, volatility is intraday, and surveys land somewhere between.
Match the input to your holding period. A day trader who leans on a weekly positioning file has mismatched the tool to the job.
Step Two: Take the Readings in Order
An order stops you cherry-picking. The same sequence every time makes the readings comparable week to week.
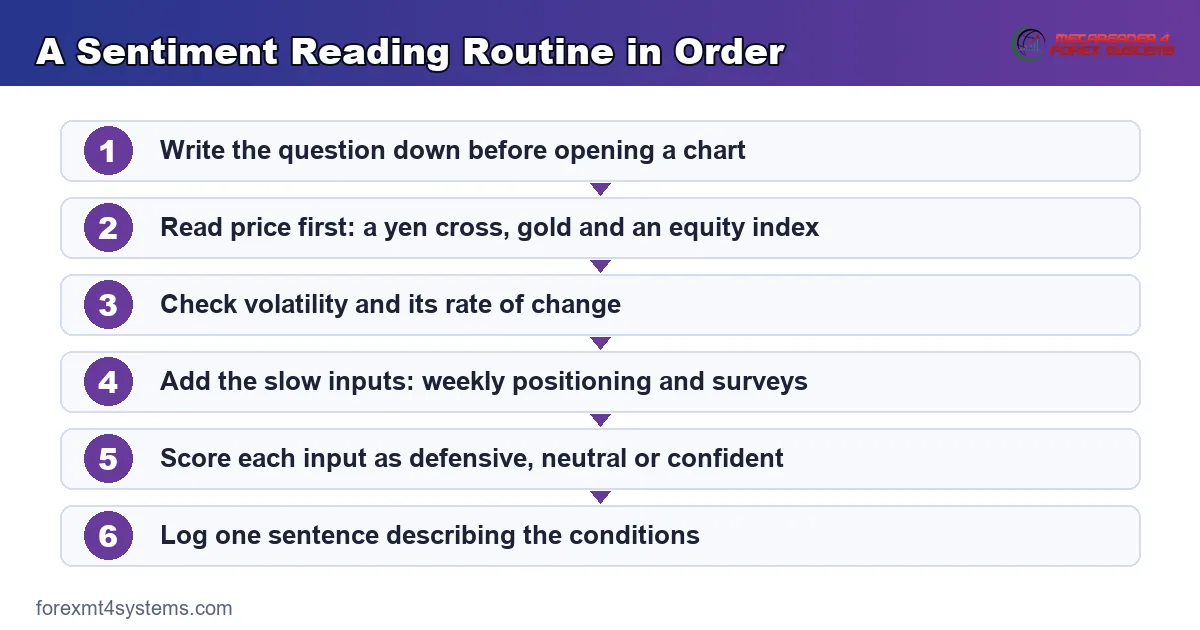
The routine above runs from fastest input to slowest. Start with what price is doing now, then work outwards to the reports.
Start With Price
Open a yen cross, gold and an equity index. Three charts, thirty seconds, and the state is usually obvious.
Agreement across all three is a clear read. Disagreement means the market sits between states, which is useful information rather than a failure.
Then Check Volatility
A rising volatility index confirms a defensive tone. A drifting, low reading confirms a confident one.
Watch the rate of change more than the level. A fast jump from a low base moves markets harder than a high reading that has sat still for weeks.
Then Add the Slow Inputs
Positioning and surveys come last, because they change least. They tell you how much fuel sits behind the current state.
Use our rundown of sentiment indicators to choose which ones to track. Two or three used consistently beat ten checked at random.
Where a Flight to Safety Shows Up First
One chart deserves its own step. The dollar index aggregates the world’s demand for the currency almost everything else is priced against.
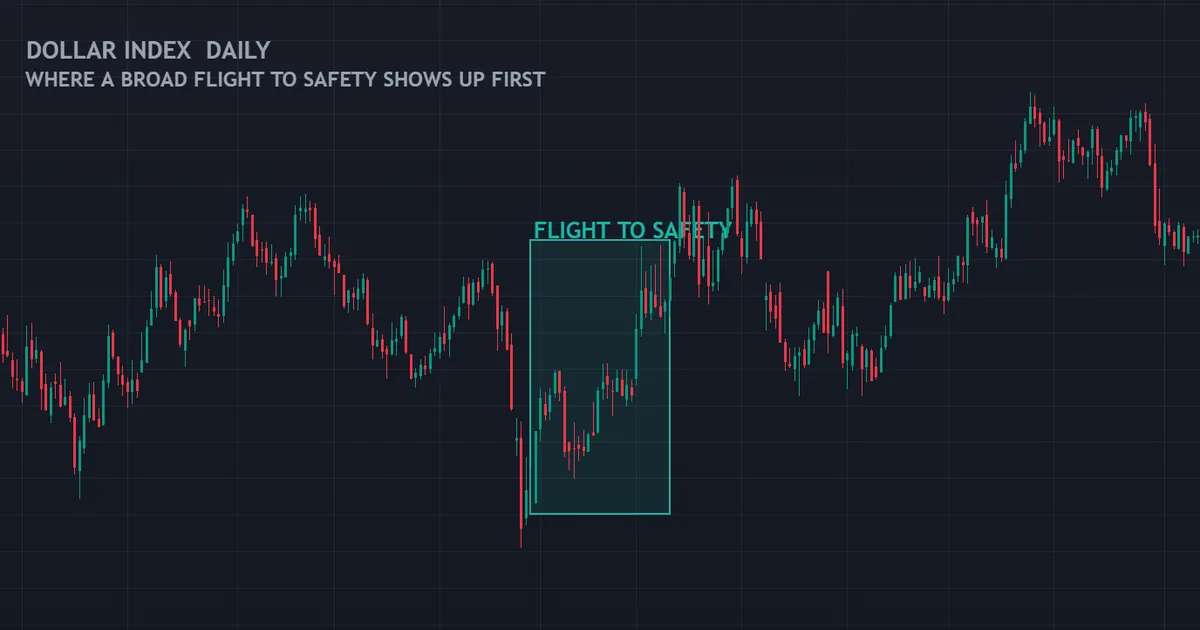
A daily dollar index chart tends to react early when caution spreads. Global borrowing and global trade both run through the dollar, so a scramble for safety turns into a scramble for dollars.
The relationship is not clean in every episode. The dollar also rallies on strong domestic growth, which is a confident state rather than a fearful one.
So read the dollar alongside gold rather than on its own. Both rising together points at caution, while the dollar rising as gold falls usually points at growth and rate expectations instead.
Cross-Check With a Strength Reading
An index blends many pairs into one line. Sometimes you want to see which currency is really doing the work.
Our currency strength meter splits the move by currency. That distinction matters when one leg drags an index around on its own.
Where Each Input Actually Comes From
Sources matter as much as method. Here is where each of the four readings lives.
The Positioning File
The CFTC publishes the Commitments of Traders data on its own site every week. Short format text, long format text and spreadsheets all appear together on the Friday.
Many charting platforms carry the series already. Plotting the net figure under price beats reading a table by a wide margin.
Volatility Readings
Equity volatility indices quote continuously through the session. Currency option desks publish implied volatility and risk reversals, though retail access to those is patchy.
A simple substitute exists on any chart. Average true range on a daily chart tracks realised volatility well enough for a mood read.
Broker Sentiment Pages
Several brokers publish a live long-short split for popular pairs. Read two of them side by side at least once, so the size of the disagreement stops surprising you.
Sample size is the hidden problem. A pair with few clients trading it produces a split that swings on very little activity.
Surveys and Commentary
Weekly institutional surveys and analyst polls round out the set. They move slowly and describe a professional subset, so they suit a weekly review rather than a morning glance.
Two Worked Reads
Method makes more sense with examples. Neither of these ends in a prediction.
A Defensive Read
Suppose gold is rising, yen crosses are falling and an equity index is down for a third day. Volatility has jumped from a low base, and last week’s positioning file showed a large speculative long in a growth currency.
Score it: three defensive, one crowded. The read is a defensive tone with real fuel behind a possible unwind.
Now note what follows from that. Trend continuation setups in growth currencies deserve smaller size, and stops need room for faster moves.
A Confident Read
Now flip it. Gold drifts lower, yen crosses climb steadily, volatility sits quiet and positioning shows nothing extreme.
Score it: three confident, one neutral. The read is a calm risk-seeking state with no crowding to worry about.
The practical consequence is different. Staircase moves suit patient trend entries, and the main risk is a scheduled event rather than a positioning unwind.
What Neither Read Says
Neither example names a price or a direction for tomorrow. Both describe conditions, and conditions change how you trade rather than what you predict.
Step Three: Score the Agreement
Four inputs will rarely agree completely. A simple score handles that better than a debate with yourself.
A Three Level Score
Mark each input as defensive, neutral or confident. Then count.
Three or four in one direction is a clear state. Two against two is a genuine neutral, and it deserves smaller positions rather than a forced opinion.
Weight by Speed
Give live prices more weight than a weekly report. When the fast inputs and slow inputs disagree, the fast ones usually describe today better.
Positioning still matters in that case. It tells you how violent a reversal could be if the fast inputs turn out to be right.
Record the Score
One line per day is enough. Over a quarter that column explains a lot about which of your setups work in which conditions.
Our trade journal holds it beside your trades. That pairing is where the habit starts paying for itself.
What Sentiment Can and Cannot Tell You
This section is the one most articles skip. Getting it right protects you from the rest of the internet.
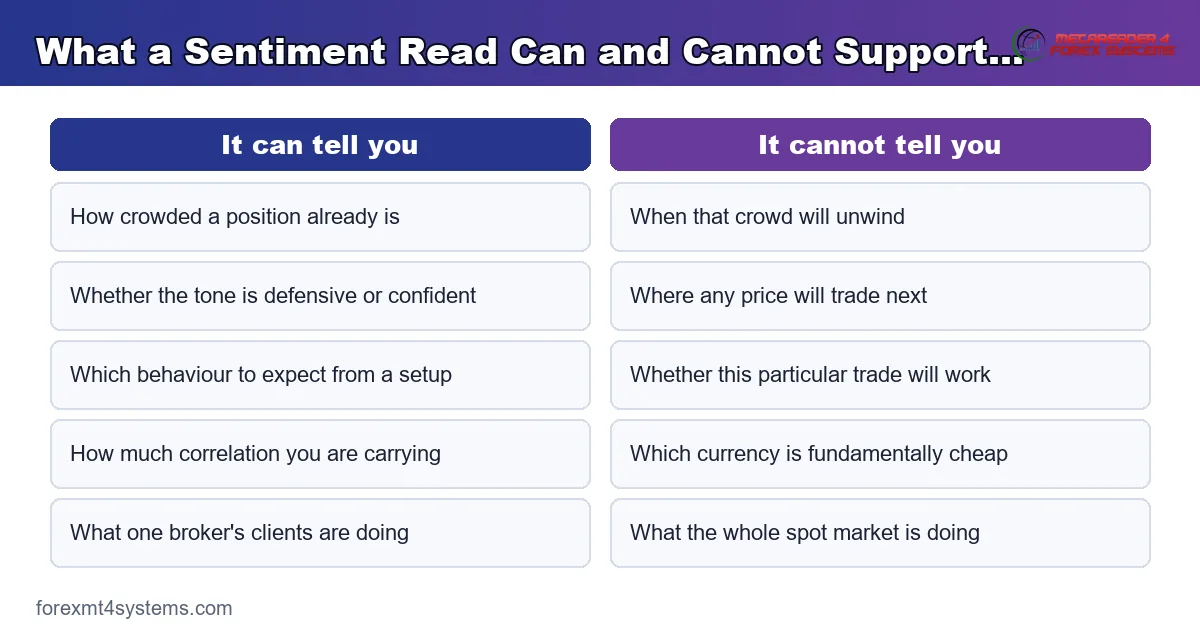
The comparison above splits the honest claims from the overreach. Everything on the left is measurable, and everything on the right requires knowledge nobody has.
It Cannot Time Anything
A crowded position can get more crowded for months. Fading an extreme is a bet on timing, and no sentiment input supplies timing.
Present both outcomes to yourself honestly. The reversal happens sometimes, and the continuation happens sometimes, and the reading alone does not separate them.
It Cannot Speak for the Whole Market
Every source covers a subset. Futures data covers exchange traders, broker splits cover one client base, surveys cover whoever answered.
Spot forex has no census. Any claim about what the market is positioned for is an estimate built from proxies.
It Cannot Replace Your Rules
Sentiment sets the weather. Entries, stops and size still come from a plan you wrote when nothing was happening.
Download the complete indicator database
Put these concepts on your charts. One email unlocks the full library of 1,380+ indicators with compiled MT4 and MT5 files, plus my TradingView scripts. No paywall, no spam, unsubscribe any time.
Get free access to my indicator database
One email unlocks 1,380+ free MT4, MT5 and TradingView indicators — the complete library. No single-tool download; you get the whole database.
Stack the Inputs Into One Read
The end product should fit in a sentence. Anything longer will not survive a busy morning.
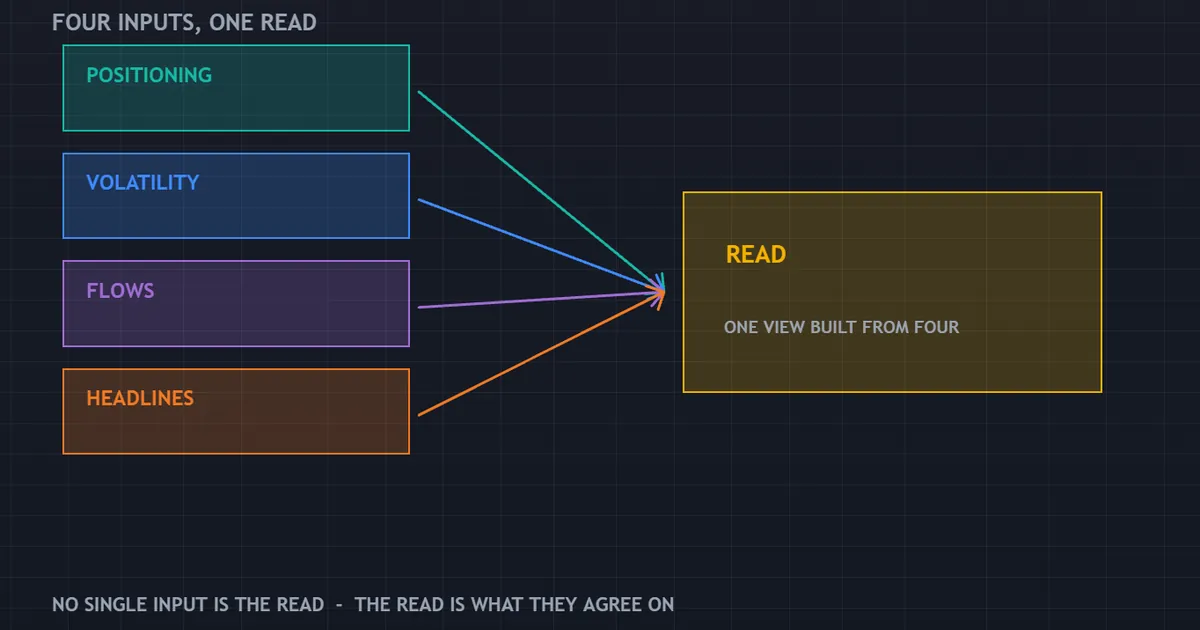
The panel above shows the stack: four inputs feeding a single read at the bottom. Nothing in that structure predicts a price, and the read simply describes the conditions you are trading into.
Write the sentence in plain words. Defensive tone, crowded short dollar positioning, volatility rising, headlines quiet is a complete read.
Then act on it through size and setup choice. Traders who act on it through direction alone tend to give the gains straight back.
Common Mistakes When Reading Sentiment
Six errors do most of the damage. Each has a straightforward fix.
Treating a Broker Split as the Market
One broker’s book is one broker’s book. Compare two providers on the same day and the difference usually settles the argument.
Reading the Positioning File as Live Data
Check what happened after Tuesday before acting. A sharp move later in the week may already have cleared the crowd the report describes.
Using Futures Data as Spot Data
Currency futures are a proxy for institutional positioning. Useful, and not the same thing as the spot market.
Mistaking an Extreme for a Signal
Extremes describe fuel, not ignition. Use them to cut size, and let something testable decide direction.
Adding Inputs Until One Agrees
Ten sources will always contain one that supports your view. Pick your inputs in advance, then live with what they say.
Ignoring the Calendar
Scheduled events reset the mood on purpose. Scan our economic calendar before you conclude that a quiet tone will hold.
Sentiment Extremes and What They Really Mean
Extremes get more attention than anything else in this subject. They deserve a careful definition.
Extreme Compared With What
A reading is only extreme against its own history. Compare the current figure with several years of the same series, not with a number somebody quoted online.
Scale matters too. Positioning expressed as a share of open interest ages far better than a raw contract count, because markets grow over time.
Both Outcomes Are Real
Sometimes a crowded position unwinds and price snaps back. Sometimes the crowd is simply early, and the trend runs for another quarter.
Honest study of this shows both outcomes clearly. Anyone presenting only the reversals has selected their examples.
What to Do With One
Treat an extreme as a risk parameter. It changes how much you are willing to lose on a trade, and it does not choose the trade for you.
A Fifteen Minute Weekly Routine
Daily reading takes five minutes. The weekly version takes fifteen and does the deeper work.
Saturday Morning
Pull the week’s positioning changes for the currencies you trade. Note the direction of change rather than the absolute level.
Then mark the week’s volatility path. Rising, falling or flat is enough detail.
Compare Against Your Own Results
Open your trade log beside the readings. Look for the conditions where your setups did well and the conditions where they stalled.
That comparison is the real payoff. Most traders discover their edge is condition-dependent long before they discover anything about the market.
Plan the Week Ahead
Decide in advance which state would make you trade smaller. Writing that rule down beats making the call while a position is open.
Check the timeframe alignment too. Our guide to multi-timeframe analysis pairs naturally with a weekly sentiment habit.
Reading Sentiment on a Single Pair
Broad sentiment covers the market. Sometimes you need it for one instrument instead.
Split the Pair
Every quote holds two currencies. Ask which side is driving, because the answer changes the trade completely.
A falling cross can mean the base currency is weak or the quote currency is strong. Those two situations behave very differently after the first move.
Check the Correlated Neighbours
Look at two or three pairs that share a currency. If all of them agree, the driver sits in the shared leg.
Disagreement points at something local. That is often the more interesting finding.
Then Check the Crowd
Positioning on one pair is harder to source than the broad picture. Futures data exists only for the currencies with listed contracts, so several crosses have no direct read at all.
Build the view from the legs in that case. A cross made of two currencies with futures data can be approximated from both sides, and the approximation is rough enough to treat with care.
Retail splits are useful here, with the usual caveat about whose book you are reading. Our guide to retail sentiment in forex covers what those figures can and cannot support.
How the Read Fits a Trading Plan
A reading that changes nothing is a hobby. Three places in a plan can genuinely use it.
Position Size
This is the main one. A crowded, defensive state justifies a smaller position for the same setup, because the tail risk is larger than usual.
Write the adjustment as a rule with numbers in it. Half size in a hostile state beats a vague intention to be careful.
Setup Selection
Different conditions suit different rules. Breakout entries tend to fare better in decisive states, and mean reversion entries tend to fare better in flat ones.
Your own log settles which is true for you. Nobody else’s results transfer cleanly to your setups.
Stop Placement
Defensive states move faster and gap more often. Wider stops with smaller size handle that combination better than tight stops at full size.
Weekend exposure belongs in the same thought. Headlines land while the market is shut, and a gap ignores your stop level entirely.
Tools That Help and Tools That Distract
Plenty of software claims to read sentiment for you. Some of it genuinely saves time.
Worth the Screen Space
Anything that plots a slow series beside price earns its place. Positioning under a chart, volatility beside it, strength across a basket.
Our MT4 indicator library covers the charting side. Treat every one of them as an input rather than an instruction.
Usually a Distraction
Dashboards that blend everything into one arrow hide the disagreement. Disagreement between inputs is the most useful signal the stack produces.
Alerts on every reading create noise as well. Sentiment moves slowly, so a daily glance beats a stream of notifications.
One Screen, Not Six
Keep every sentiment input on a single layout. Switching between tabs invites you to keep looking until something agrees with the position you already hold.
Fix the layout once and leave it alone for a quarter. Changing the tools every few weeks destroys any chance of comparing one month with another.
The Volatility Piece
Equity volatility is the input most forex traders underuse. Our guide to using the VIX in forex explains where it helps and where the link is weaker than people assume.
FAQ
What is the fastest way to read market sentiment each morning?
Open a yen cross, gold and an equity index, then note whether all three agree. That takes under a minute and captures the live mood better than any report. Add a volatility reading if you want one number to log.
Is retail sentiment data reliable?
It is reliable about the broker publishing it and nothing more. Each provider shows its own client book, so two brokers can report very different splits on the same day. Treat it as one narrow input rather than a picture of the market.
How often should positioning data be checked?
Once a week matches the release schedule. The file freezes on Tuesday and appears on Friday, so checking it more often simply shows you the same numbers again. Note the change from the previous week rather than the level alone.
Can sentiment tell me when a trend will reverse?
No. An extreme reading shows a crowded position, and crowded positions can grow for months before anything breaks. Sentiment is better used to adjust position size than to pick turning points.
Does sentiment work the same on every pair?
Not evenly. Yen crosses and commodity currencies respond strongly to shifts in risk appetite, while some pairs are driven mostly by local policy or politics. Test each pair you trade against your own readings before you assume the relationship holds.
Should sentiment override a technical setup?
It should inform the setup rather than override it. A valid pattern in a hostile sentiment state deserves a smaller position, not a cancelled one, and the decision belongs in your written rules rather than in the moment. Results are not guaranteed; past performance is not indicative of future results.
External references
- For background on this concept, see About the Commitments of Traders Reports at the CFTC.
- For broader market context, see VIX Index FAQs at Cboe.

About the author
Written by Dominic Walsh, a Forex trader and MT4/MT5 indicator, Expert Advisor and script developer. Every tool on forexmt4systems.com is tested on live charts before release and ships with ready-to-use compiled MT4 (.ex4) and MT5 (.ex5) files. Learn more about the trader and developer behind this site.
How we build, test and correct every tool: Editorial & Testing Policy. Trading carries risk; see the disclaimer.