
Most guides on how to use COT report data skip straight to the fun part. They show a chart, mark an extreme, and imply that a turn followed.
Real use looks slower and duller than that. So this guide sets out a weekly routine, then spends just as long on what the data cannot do.
How to Use COT Report Data Without Overreaching
Start with the honest job description. The Commitments of Traders file tells you how crowded one side of a futures market has become, as of last Tuesday.
That is context. It is not an entry, an exit or a target, and treating it as one is where most readers go wrong.
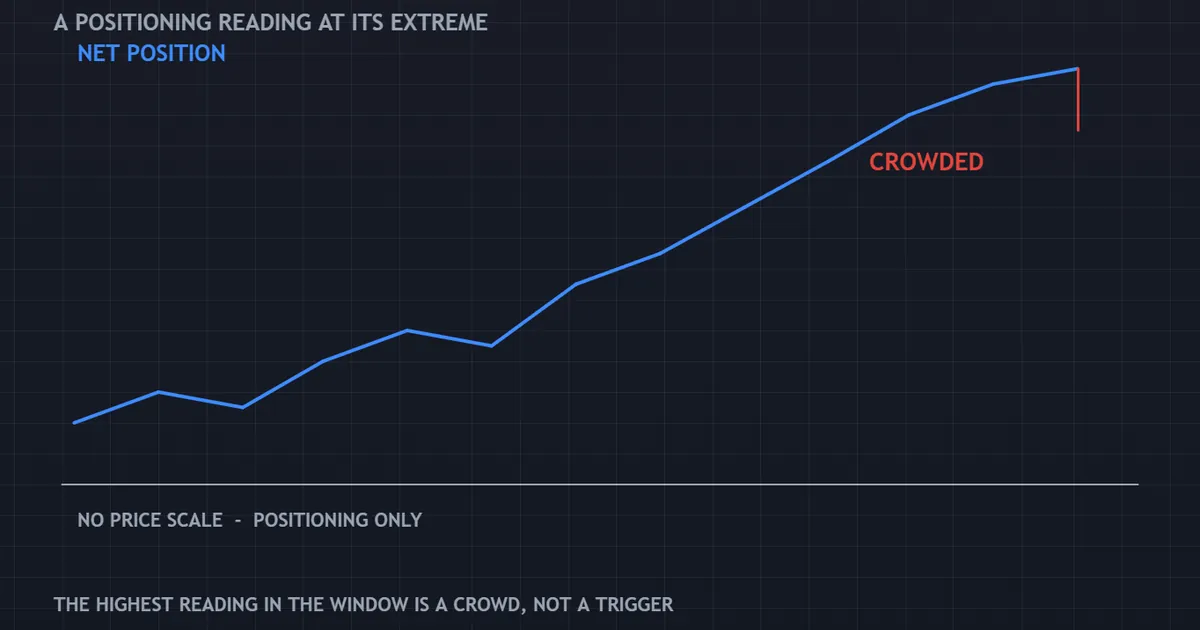
The panel above marks a net position line at its most crowded point in the window. Notice the missing price scale, because crowding and price are two separate questions.
Context Changes Size, Not Direction
Here is a rule worth adopting early. Positioning should influence how much you risk, and price should decide which way you face.
Crowded conditions raise the odds of a sharp unwind. So they argue for a smaller position, not for a trade against the trend.
The Data Runs on a Weekly Clock
The snapshot lands on Tuesday and the file lands on Friday. Nothing about that suits a fast decision.
Match the tool to the horizon. Weeks and months work well. Hours do not.
It Covers Futures, Not Spot
Currency futures trade on an exchange in the United States. Spot forex trades over the counter, and no public register of those positions exists.
Our explainer on what the COT report contains covers that split in detail. Read it first if the categories are new to you.
Step One: Pick One Report and Stick With It
Consistency beats coverage at the start. Two choices matter, and both should stay fixed for months.
Choose the Format
For currencies, the Traders in Financial Futures version splits leveraged funds from asset managers. The older legacy version merges them into one speculative column.
Either works. Switching between them halfway through ruins your own history, though, so decide now.
Choose Futures Only or Futures Plus Options
Both versions exist for each report. The combined file includes options on a delta-adjusted basis.
Pick one and label your sheet clearly. Comparing a combined figure against a futures-only figure produces a jump that means nothing at all.
Choose Two or Three Markets
Follow a handful, not everything. Two currency contracts plus one commodity contract gives you plenty to learn from.
Depth beats breadth in the first year. You want to know one series well enough to notice when it behaves oddly.
Step Two: Turn the Numbers Into a Series
A single week tells you very little. Value appears once you can see the same figure across a long stretch.
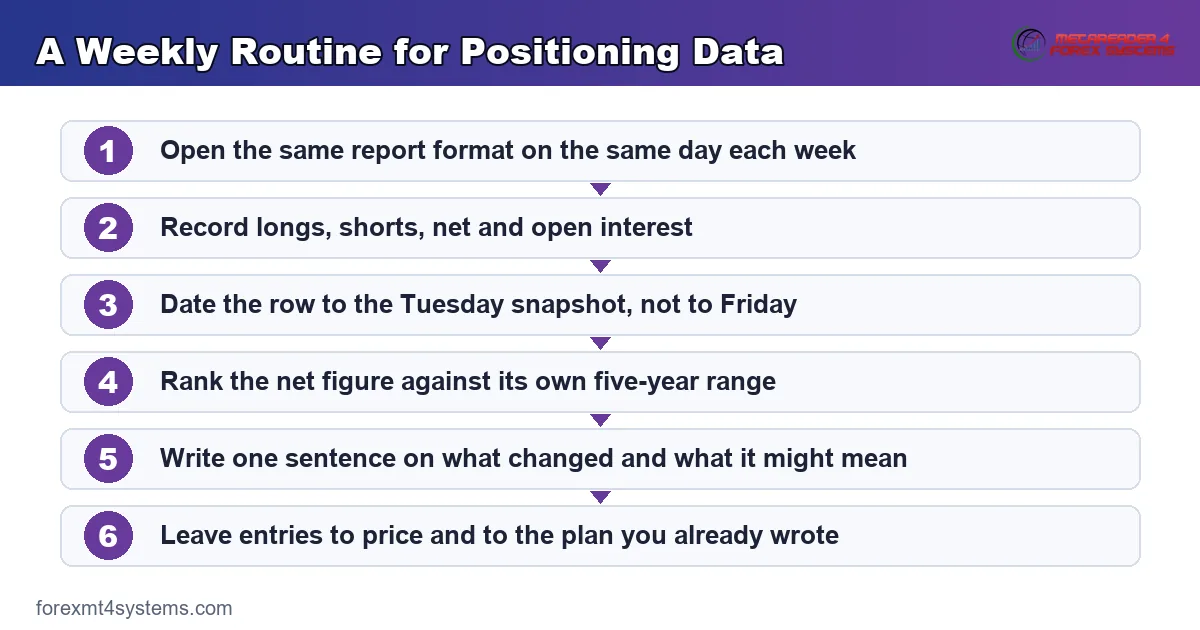
The flow above lays out the routine. Fifteen minutes a week keeps it running, and the record becomes useful after roughly three months.
Record Four Numbers
Longs, shorts, net and open interest. Nothing else belongs in your sheet at the start.
Add the weekly change as a fifth column if your sheet can work it out for you. Typing a derived number by hand invites errors.
Chart the Net Figure
Plot net position under the price of the same market. Keep the two panes aligned on the same dates.
Misaligned dates cause more false conclusions than any other habit here. The positioning point belongs on Tuesday, not on the Friday you read it.
Watch Open Interest Alongside
Rising open interest with a rising net long means new money joined that side. Falling open interest with the same move means the other side simply left.
Both look identical on a net chart. So the extra column earns its space in the sheet.
Step Three: Judge an Extreme Honestly
Everyone wants to know when a reading counts as extreme. The answer needs a range, not an opinion.
Use the Series Against Itself
Compare this week’s net figure against its own history over one, three and five years. A percentile rank does that job with one sheet function.
Absolute numbers mislead across markets. Contract sizes differ, and open interest grows over the years, so raw counts do not compare.
Beware the Structural Level
Some categories sit net short in a market as a matter of routine. Producers hedge, so their column rarely turns positive.
In those markets, only the deviation matters. A hedger short reading tells you nothing on its own.
Set the Bar High
Treat the top and bottom five per cent of the five-year range as genuinely extreme. Anything looser fires far too often.
Extremes ought to feel rare. If your definition flags a reading every month, the definition is doing no work.
Then Wait
An extreme is a starting point, not a trigger. Our note on trading against the crowd explains why the waiting part matters most.
Reading a Commodity Currency
Currencies tied to exports behave in a recognisable way. Their futures positioning often swings with risk appetite and with the commodities behind them.
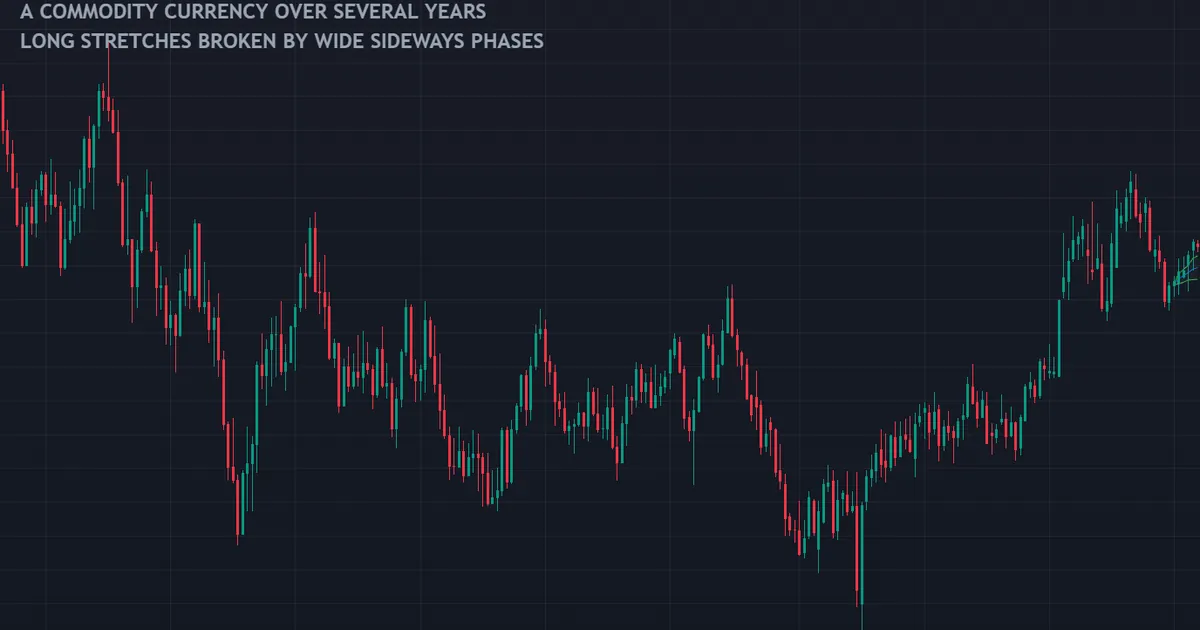
The chart above shows a commodity currency on a weekly scale across several years. Long directional stretches alternate with wide sideways phases, and it is inside those stretches that crowded positioning persists longest.
Why the Swings Run Deep
Funds treat these pairs as an expression of global growth. When appetite turns, the same participants often move together.
Net positioning therefore travels a long way from the middle. Our note on commodity currencies covers the underlying links.
Why That Cuts Both Ways
Deep swings make extremes easier to spot. They also make those extremes last longer than a patient trader expects.
A crowded reading can persist for a quarter. Nothing in the file tells you which week the crowd starts to leave.
Pair the Read With Price Structure
Weekly charts and weekly positioning belong together. Our guide to multi-timeframe analysis shows how to keep the two horizons from contaminating each other.
Step Four: Combine It With Price, Never Instead of Price
This step separates a useful habit from an expensive one. Positioning sets the background, and price still triggers everything.
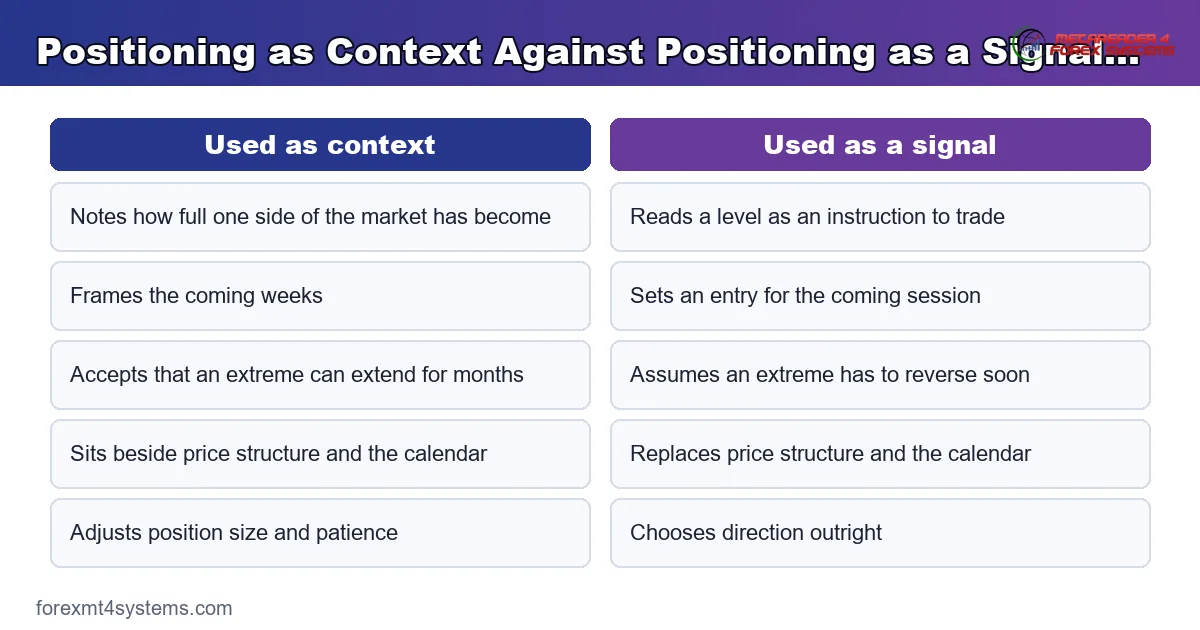
The comparison above sets the two approaches beside each other. Read the right column as a description of how accounts get damaged.
What a Context Reading Looks Like
Suppose funds hold their largest net long in three years while price grinds higher. Your note says one thing: the crowd on that side is unusually large.
You then trade the trend with a smaller size than usual. Nothing about the note tells you to sell.
What a Signal Reading Looks Like
The same reading gets turned into a short. Price grinds higher for another two months, and the position bleeds the whole way.
The reading was correct and the trade was still wrong. Crowded does not mean finished.
Where the Trigger Should Live
Let price structure decide. A weekly close back through a level, a failed high, a shift in the swing pattern, whatever your plan already uses.
Write that trigger into your plan before you look at the data. Our guide to building a trading plan covers how to fix rules in advance.
Download the complete indicator database
Put these concepts on your charts. One email unlocks the full library of 1,380+ indicators with compiled MT4 and MT5 files, plus my TradingView scripts. No paywall, no spam, unsubscribe any time.
Get free access to my indicator database
One email unlocks 1,380+ free MT4, MT5 and TradingView indicators — the complete library. No single-tool download; you get the whole database.
Why Fading a Crowd Is Not a System
The contrarian story sells well because it flatters the reader. Someone else is the crowd, and you are the clever one.

The panel above shows the awkward case, where positioning and direction disagree for a long stretch. Both lines are real, and one of them will test your patience.
Extremes Can Get More Extreme
A record net long can become a larger record next week. Nothing in the mechanics prevents it.
Trends persist because participation keeps growing. So the very condition that looks unsustainable is often the fuel.
The Unwind Has No Schedule
Crowded positions do unwind eventually. Eventually can mean next week or next year, and the file offers no clue which.
A trade needs a stop and a horizon. Neither comes out of a positioning chart.
You Are Not Fading the Whole Market
Remember the coverage limit. You are fading reportable futures traders in one contract, not global currency flow.
Plenty of offsetting exposure sits outside the file. Our comparison of sentiment against fundamentals takes that argument further.
Nobody Publishes a Forecast From This
We will not tell you where a currency goes next, and neither should anyone reading the same file. The data supports statements about crowding and nothing beyond that.
What the Groups Mean in a Currency Contract
Category names sound grander than they are. Four labels cover the financial futures report, and each one has a plain job.
Dealers
Banks and their intermediaries sit here. They warehouse risk for clients, so their book often shows the mirror image of everyone else.
Read this line as the offset, not as a view. A large dealer short usually means clients wanted to be long.
Asset Managers
Pension funds and similar institutions land in this bucket. Their positions move slowly, because their mandates move slowly.
Sharp weekly swings are rare here. When one appears, it is worth a note in your sheet.
Leveraged Funds
This group holds the fastest speculative money in the file. Hedge funds and commodity trading advisers make up most of it.
For crowding questions, this is the line to watch. It builds with a trend and unwinds hard when the trend breaks.
Other Reportables
Everything else above the reporting level lands here. Corporates and smaller institutions share the column.
It rarely tells you much on its own. Still, it belongs in your sheet, because the four columns should add up.
Three Questions Before You Trust a Positioning Chart
Charts you find online hide their choices. Ask three questions before you believe one.
Which Report Is This?
Legacy and financial futures versions produce different lines for the same market. Neither is wrong, and mixing them is.
If the chart does not say, treat the line as decoration. You cannot rebuild a series you cannot identify.
Is Anything Smoothed or Indexed?
Many charts show an index rather than a raw net figure. That index usually scales the reading against a lookback window.
Change the window and the picture changes with it. A reading at the top of a three-year range may sit mid-pack over ten years.
Where Is the Date Stamped?
Some charts plot the reading on the Friday of release. Others plot it on the Tuesday snapshot.
The difference is three days of price. That gap is enough to make a lagging series look prescient, so check it before drawing any conclusion.
Mistakes That Cost Real Money
Six errors show up again and again. Each one has a plain correction.
- Trading the release. The data is already three days old on Friday, so nothing about the release moment deserves a position.
- Comparing raw counts across markets. Contract sizes differ, so a percentile rank against each market’s own history is the only fair comparison.
- Reading one week alone. Rolls, expiry effects and reporting quirks all sit inside a single print, and a multi-week trend removes most of that noise.
- Calling hedgers smart money. Commercial positions follow business needs, so their timing looks poor by design through a strong trend.
- Ignoring the small trader column. That figure comes from a subtraction rather than a count, so it carries the errors from every other column.
- Letting it override your plan. A weekly context note has no business changing a trade you already sized and placed.
None of those mistakes come from stupidity. They come from wanting a slow tool to answer a fast question.
A Weekly Checklist You Can Actually Keep
Print this, or copy it into your journal template. It takes a quarter of an hour.
| Step | What you do | Why it matters |
|---|---|---|
| 1 | Open the same report format for your chosen markets | Mixing formats breaks your own history and creates fake jumps |
| 2 | Copy longs, shorts, net and open interest into the sheet | Four columns cover every question worth asking in the first year |
| 3 | Date the row to the Tuesday snapshot, not to Friday | Aligned dates stop you crediting the data with moves it never saw |
| 4 | Rank the net figure against its own five-year range | A percentile travels across markets where a raw count does not |
| 5 | Write one sentence on what changed this week | Forced summary exposes the weeks where nothing happened at all |
| 6 | Note where the reading could be misleading you | Naming the weakness in advance is what keeps context from becoming a signal |
| 7 | Leave your entry rules untouched | Positioning adjusts size and patience, never direction |
Review the whole sheet once a quarter. Log the outcome next to each note in your trade journal so the habit earns its place or gets dropped.
A Worked Example of the Weekly Note
Words on method only go so far. Here is what a finished note looks like across three weeks of one series.
Week One
Leveraged funds add to the long side for a fourth week running. The net figure now sits in the upper part of its three-year range.
Open interest rose as well, so new money joined rather than shorts leaving. The note reads: crowd building, trend intact, size normal.
Week Two
Funds add again, and the net figure reaches its highest point in three years. Price made a new high inside the same week.
Now the note changes. Crowd at an extreme, trend still intact, size reduced for new entries.
Notice what did not change. The entry rules stayed identical, and no short appeared anywhere in the plan.
Week Three
Funds trim slightly while price holds. Open interest falls, which points to positions closing rather than fresh selling.
The note reads: crowd easing from an extreme, no structural change on price. Still no trade comes from the file itself.
What the Three Weeks Taught
The record now holds a small story rather than three numbers. Stories are what you review later, and numbers alone are not.
Repeat that for a year and you own something rare. Most traders quoting this data have never kept a note like it.
Keep the wording dull on purpose. Dry notes age well, while dramatic ones read as embarrassing forecasts six months later.
Then reread the whole set each quarter. Patterns in your own language show up faster than patterns in the numbers.
Where Positioning Fits in a Wider Process
One weekly file cannot carry a strategy. It sits in a stack with several other inputs, and it sits near the bottom.
Price Comes First
Structure, trend and level decide the trade. Everything else adjusts the details around that decision.
Our forex strategy library covers the mechanics of that layer properly.
The Calendar Comes Second
Scheduled events explain most of the sharp moves in a week. Positioning explains how violent the reaction might be, which is a different question.
A crowded market meeting a surprise release produces the moves people remember. Neither ingredient alone does it.
Positioning Comes Third
Use it to answer one question. Is one side unusually full right now, by this market’s own standards?
Then let that answer nudge your size. That is the whole contribution, and it is worth having.
Your Own Record Comes Last
After six months, check whether your notes helped. Compare the weeks where you flagged crowding against what your account actually did.
Drop the habit if it added nothing. A tool that survives that test is worth far more than one you kept out of loyalty.
What Good Looks Like After a Year
You will know the normal range of two or three series by feel. That alone stops you calling every mild reading extreme.
You will also know how your own account behaves in crowded conditions. Some traders trim size and sleep better, while others find the note distracting.
Both answers are fine. The point of the record is to find out which one describes you, rather than copying somebody else’s routine.
FAQ
How to use COT report data if I trade intraday?
Mostly, you do not. The snapshot is three days old at release and more than a week old by midweek, so it cannot inform a session decision. If you want one use, let a crowded reading push you towards smaller size during that week, and leave your entries alone.
What counts as an extreme reading?
Rank the current net figure against the same market’s own history, then treat roughly the top or bottom five per cent of a five-year range as extreme. Absolute contract counts do not compare across markets, and open interest grows over time. If your threshold fires monthly, it is set too loose.
Should I trade against a crowded position?
Not on the reading alone. An extreme tells you the potential unwind could be sharp, and it says nothing about timing, so a crowded position can grow more crowded for months. Wait for price structure to turn, then size for the possibility that you are early.
Which group should I follow in currency contracts?
Leveraged funds usually give the cleanest read on speculative crowding in currency futures, with asset managers as a slower second series. Dealers act as the offset and mostly mirror the others. Follow one group consistently rather than switching to whichever fits your view this week.
Does positioning data work better in some markets?
It tends to look most informative in markets with deep futures participation and clear hedging flows, such as major commodities. Currency contracts sample a smaller part of a much larger over-the-counter market, so the read is thinner. Judge that for yourself across your own records rather than taking anyone’s word for it.
Can I build a strategy on this data alone?
No, and the attempt usually ends badly. The file is weekly, lagged, limited to listed futures, and silent on price, so it cannot supply entries, stops or targets. Use it as background that adjusts patience and size, and keep the trading decisions where they belong. Results are not guaranteed; past performance is not indicative of future results.
External references
- For background on this concept, see The COT Report in the BabyPips Forexpedia.
- For broader market context, see Contrarian Investing at Investopedia.
- The Tuesday reporting date and the trader categories behind that file are defined in Commitments of Traders Disaggregated Explanatory Notes at the CFTC.

About the author
Written by Dominic Walsh, a Forex trader and MT4/MT5 indicator, Expert Advisor and script developer. Every tool on forexmt4systems.com is tested on live charts before release and ships with ready-to-use compiled MT4 (.ex4) and MT5 (.ex5) files. Learn more about the trader and developer behind this site.
How we build, test and correct every tool: Editorial & Testing Policy. Trading carries risk; see the disclaimer.