
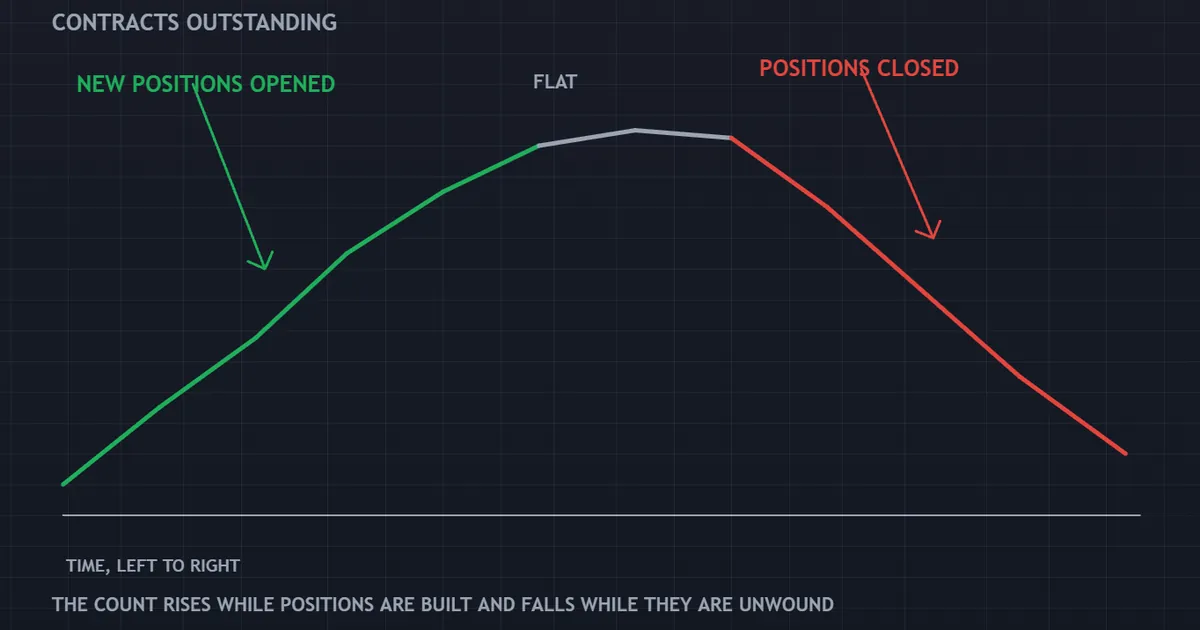
Two traders open a futures position against each other, and a counter ticks up by one. Two traders close, and it ticks back down.
That counter answers what is open interest. It records how many contracts remain live at the end of a session, and nothing else.
What Is Open Interest, Exactly?
Open interest counts contracts that remain open. Neither side has closed the position, and the contract has not yet expired.
Each contract counts once, not twice. One long and one short together make a single unit of open interest.
A Stock, Not a Flow
Think of a reservoir rather than a river. Volume measures the water flowing through today, while open interest measures how much sits in the tank.
So volume resets to zero each session. Open interest carries forward, day after day, until traders close or the contract dies.
Where You See It
Exchanges publish the figure for every listed contract. Futures on currencies, gold, oil and stock indices all carry one.
The number appears beside volume on most data feeds. It also appears in the weekly positioning report from the CFTC.
Why the Count Matters
Open interest tells you how much money has committed to the market. A market with many live contracts holds many people who must eventually get out.
That exit is a future order. So the figure describes fuel, not direction.
Fuel is worth knowing about all the same. A crowded contract can move fast when the exits start, and an empty one rarely does.
How One Trade Changes the Figure
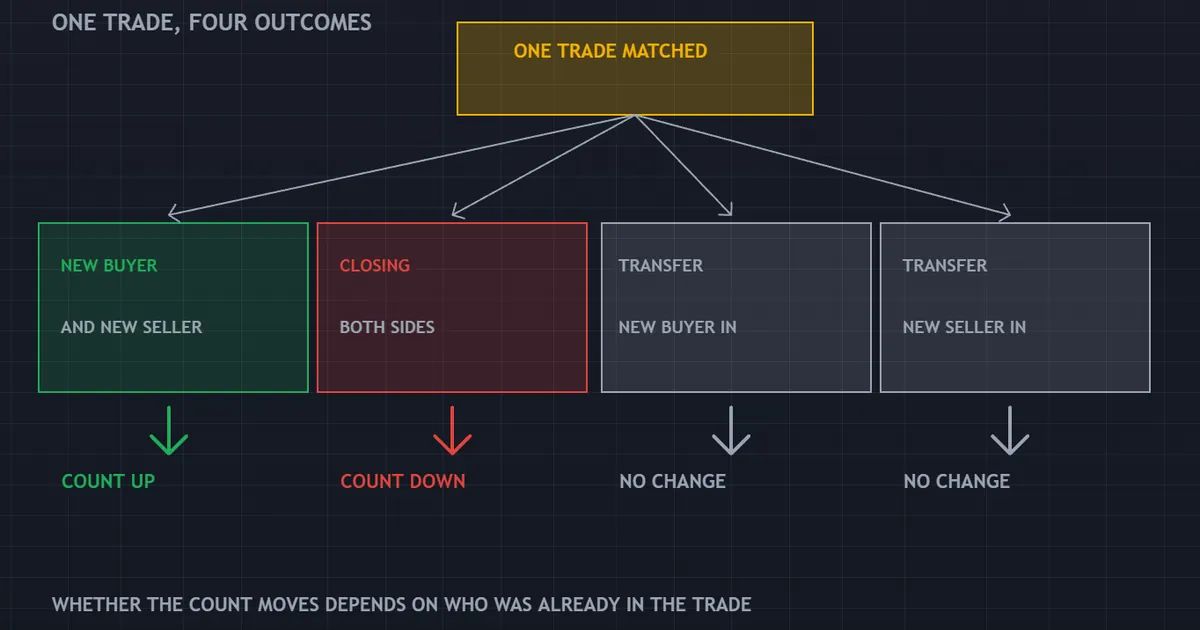
Every trade has a buyer and a seller. What happens to open interest depends on whether each of them is opening or closing.
Both Sides Open: The Count Rises
A new buyer meets a new seller, and a fresh contract comes into being. Open interest rises by one.
This is new money entering the market. Two people now hold risk that neither held an hour ago.
Both Sides Close: The Count Falls
An existing long sells to an existing short. Both walk away flat, so the contract disappears and open interest falls by one.
Money has left the market here. The trade still shows in volume, which is exactly why the two numbers disagree.
One Opens, One Closes: No Change
An existing long sells to a new buyer. The contract survives with a different owner, so the count stays where it was.
Two of the four cases work this way. That is why volume can be heavy while open interest barely moves.
Reading the Four Cases Together
You never see which case produced a given trade. You only see the daily change in the total.
So a rise means new contracts outnumbered closed ones. It never means every trade was fresh.
Keep that limit in mind when you read commentary. A headline about record open interest describes a net total, not a wave of new buyers.
The same caution applies to a fall. Contracts leave for many reasons, and boredom is one of them.
A Short Worked Example
Small numbers make this concrete. Follow one contract through three sessions.
Day One
The market opens with no positions at all. Ten new buyers meet ten new sellers, so ten contracts come into being.
Volume for the day is ten. Open interest closes at ten as well, since every trade opened something.
Day Two
Four of the original longs sell to four brand new buyers. Four contracts change hands, and nothing closes.
Volume for the day is four. Open interest still closes at ten, because those contracts merely moved.
Day Three
Three longs sell to three of the original shorts. Both sides go flat, so three contracts vanish.
Volume for the day is three. Open interest closes at seven.
What the Three Days Show
Total volume across the three sessions was seventeen. Open interest ended at seven, and neither number is wrong.
They simply count different things. Once that clicks, the four-way table further down stops feeling like folklore.
Where the Number Comes From
The figure comes from the clearing house, not from a data vendor. That detail explains its timing and its accuracy.
The Clearing House Keeps the Register
Every futures trade passes through a central counterparty. That body stands between buyer and seller, and it holds the record of every open position.
So the count is a fact rather than an estimate. Nobody has to survey anyone.
It Arrives With a Delay
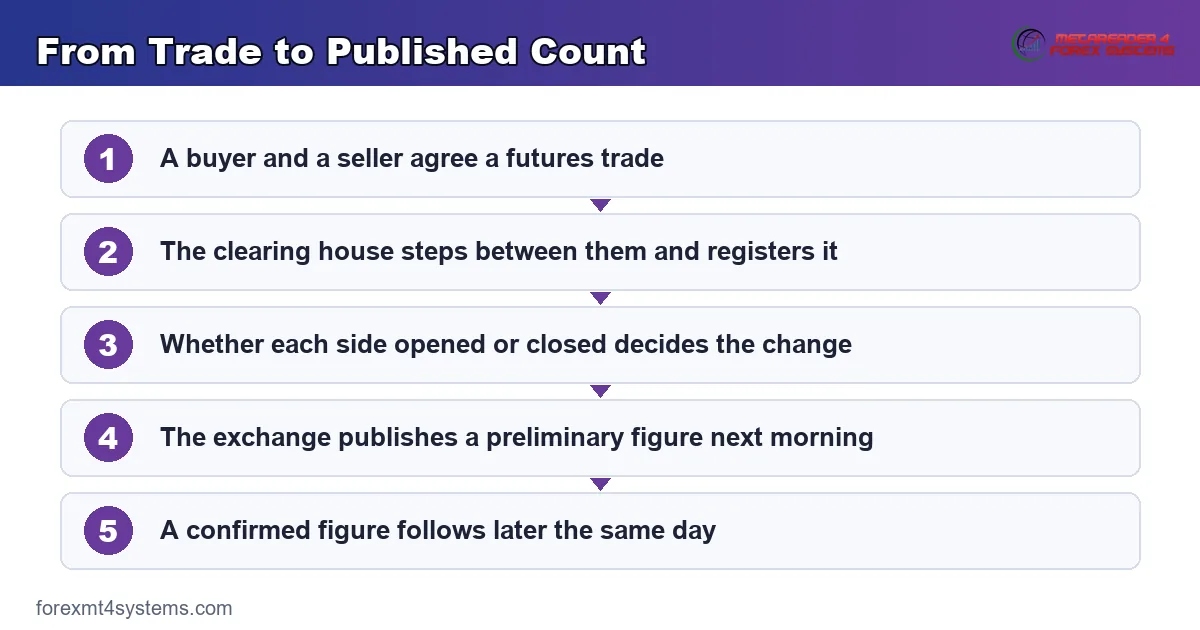
Exchanges publish a preliminary figure the next morning and confirm it later that day. Intraday open interest does not exist in any official form.
That delay is a real limit. Anyone quoting live open interest is quoting an estimate.
Contracts Expire, So the Count Rolls
Futures contracts have a life span. As one nears expiry, traders move to the next month, and the front-month count drains while the next one fills.
A falling figure during that window means very little. Check the roll dates before reading anything into it.
Why Spot Forex Has No Central Figure
This is the part that surprises traders coming from futures. Spot currency trading has no open interest number at all.
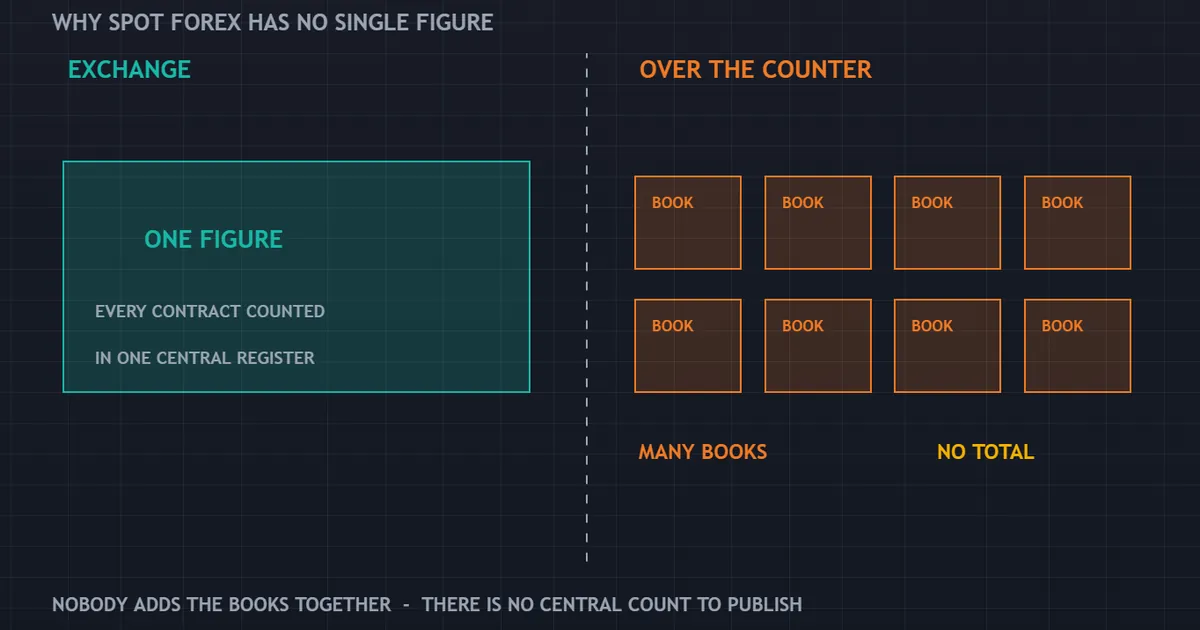
Over the Counter Means No Central Register
Spot forex trades over the counter. Banks, brokers and funds deal directly with each other, and each deal lives on the two books involved.
No single body holds a register of every open position. Without that register, no total can exist.
Every Venue Sees Only Itself
A broker knows its own client book. A bank knows its own trades. Neither knows what the rest of the market holds.
So any forex figure labelled open interest belongs to one venue. Read the small print before you compare it with anything.
What Brokers Publish Instead
Retail platforms often show long-short percentages for their own clients. That is a positioning survey with a small panel, not a market-wide count.
Both can be useful, though they answer different questions. Our guide to commercial and non-commercial traders covers the broader positioning picture.
Volume in MetaTrader Is Not Contracts Either
The volume histogram in MetaTrader counts price changes, not contracts traded. It measures how busy the feed was, which is a different thing again.
So neither figure on a spot chart matches a futures data set. Treat them as separate tools with separate uses.
What Currency Futures Give You Instead
Currency futures do carry a real count, and they trade on regulated exchanges. That makes them the usual proxy.
A Sample of the Same Market
Futures on the euro, yen, pound and others track spot closely. Their open interest shows how much committed positioning sits in that listed slice.
The slice is small next to global spot turnover. Still, it is a real count of real contracts, which spot cannot offer.
The Weekly Positioning Report
The CFTC publishes total open interest for each contract alongside the trader breakdown. The snapshot comes from a Tuesday and reaches the public on the Friday.
So the figure is already several days old on arrival. Our walk through the COT report explains the categories and the lag.
How to Use the Proxy Honestly
Treat futures open interest as a slow measure of committed exposure. Weekly changes matter, and daily wiggles usually do not.
Then check it against price over months rather than days. Our note on combining indicators covers how to weigh a slow input against a fast one.
How Big Is the Futures Slice?
Scale matters when you use futures as a stand-in for spot. The two are nowhere near the same size.
Spot Turnover Dwarfs It
Global currency turnover runs into trillions each day, and most of it never touches an exchange. Listed futures cover a modest share of that flow.
So the count is a sample. A useful sample, and still only a sample.
Why the Sample Still Helps
The traders in that slice include large funds and genuine hedgers. Their positions are reportable, so a slow read of committed exposure becomes possible.
Nothing else in currencies offers that. The choice is a partial view or no view at all.
Reading It as a Share of Its Own History
Compare today’s count with its own past year rather than with turnover elsewhere. Relative position within its own history is the only fair comparison.
Then real changes stand out clearly. Absolute levels across different markets never do.
The Same Count in Options
Options carry open interest too, and the rules match. Each strike and each expiry keeps its own separate count.
Why Strikes Matter
A large count at one strike means many contracts settle or expire there. Dealers holding the other side hedge in the underlying market as expiry nears.
That hedging is real flow. It also gets talked up far beyond its actual size.
Currency Option Expiries
Traders often watch the daily cut for currency options. Big counts near a round level can hold price nearby for a session.
Can, not must. Any strong move in the underlying market simply overwhelms the effect.
Where Those Figures Come From
Listed option counts come from the exchange, so they are firm. Over-the-counter currency option figures come from bank estimates, so they are not.
Check which sort you are reading. The two carry very different weight.
Download the complete indicator database
Put these concepts on your charts. One email unlocks the full library of 1,380+ indicators with compiled MT4 and MT5 files, plus my TradingView scripts. No paywall, no spam, unsubscribe any time.
Get free access to my indicator database
One email unlocks 1,380+ free MT4, MT5 and TradingView indicators — the complete library. No single-tool download; you get the whole database.
What Traders Read From the Figure
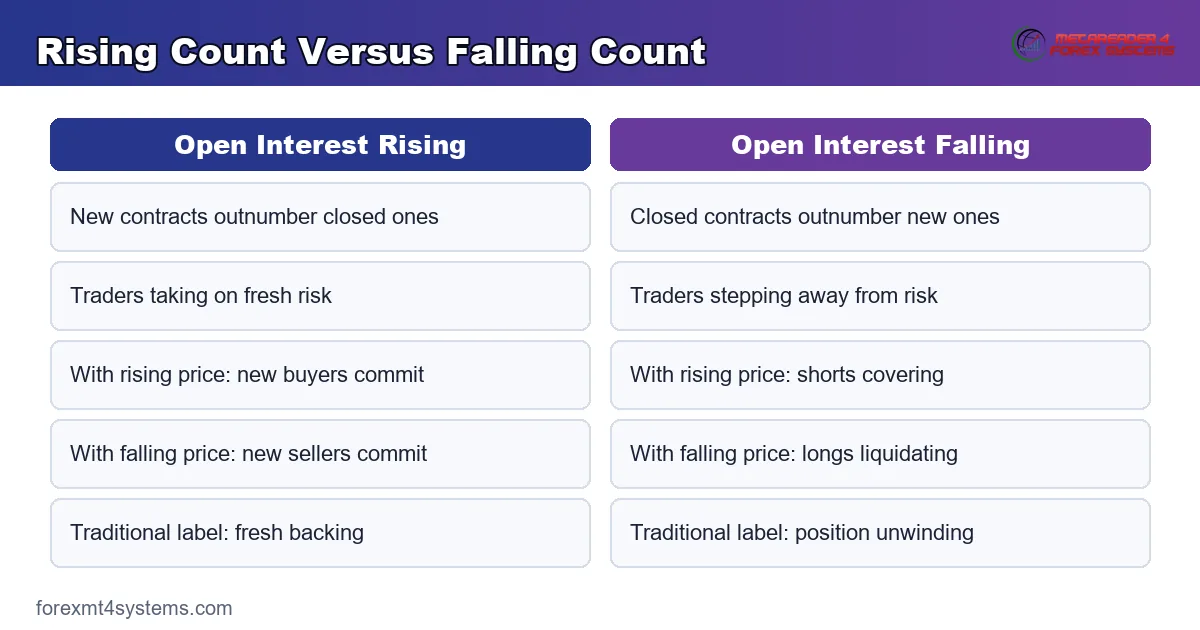
Futures traders pair the change in open interest with the change in price. Four combinations follow, and each carries a traditional label.
| Price | Open interest | Common reading |
|---|---|---|
| Rising | Rising | New buyers committing; the move has fresh backing |
| Rising | Falling | Shorts closing out; the move may lack new support |
| Falling | Rising | New sellers committing; the move has fresh backing |
| Falling | Falling | Longs closing out; the move may lack new support |
These labels come from decades of futures literature. They are rules of thumb, and the market did not agree to follow them.
Why the Labels Often Hold
A price move backed by new contracts involves people taking on risk. A move driven by closing trades involves people shedding it.
Those are genuinely different situations. So the split has a real mechanism behind it.
Why They Often Fail
Hedgers and speculators sit in the same total. A commercial hedger adding contracts is not making a directional bet at all.
The daily change also hides the roll, spread trades and options hedging. One number cannot separate those motives.
How the Count Behaves Around Events
Positioning shifts around scheduled events, and the count records that shift a day late.
Before a Central Bank Meeting
Some traders cut exposure ahead of a decision, and others build it. The net change is often tiny, which surprises people.
A small net change can still hide heavy two-way activity. Volume tells that half of the story.
After a Surprise
A shock decision usually shows up as heavy volume with a falling count. Losing positions close first, and new ones arrive later.
Then the count rebuilds over the following week. That rebuild is where the new consensus becomes visible.
Through a Quiet Stretch
In calm markets the count drifts slowly and says almost nothing. Reading meaning into a one percent weekly change is wishful.
Wait for the moves that matter. Big shifts announce themselves clearly enough.
What Open Interest Cannot Tell You
Being blunt about the limits keeps this useful. Five questions it simply cannot answer.
Who Holds the Positions
The total says nothing about the mix of holders. Only the weekly report splits it into groups, and even that split is broad.
Which Way Price Will Go
Every open contract has a long and a short. The count is balanced by definition, so it cannot lean.
When the Positions Will Close
Some contracts sit for months, and others close within hours. Nothing in the figure marks the difference.
Whether the Exposure Is Hedged
A large short in futures may offset a physical position or a cash exposure elsewhere. The count sees only the futures leg.
What Is Happening Right Now
The figure arrives the next morning. Intraday, you are working with volume and price alone.
Where to Find the Data
You do not need an expensive terminal for this. Three free sources cover most of what a currency trader wants.
The Exchange Itself
Exchanges post daily volume and open interest for every listed contract. That is the primary source, and reading it costs nothing.
The Weekly Regulator Report
The positioning report carries total open interest per contract plus the breakdown by trader group. One file each Friday covers the whole set.
Your Charting Platform
Many platforms plot the count under a futures symbol as a plain line. Check whether the series follows the front month or a continuous contract, since the two behave differently near expiry.
Keeping Your Own Copy
Save the weekly figure in a spreadsheet beside the price. History is what turns a raw number into a range you can judge against.
A Sensible Reading Routine
Five steps keep this input in its proper place.
- Use the same contract every time. Front month and continuous series behave differently, so pick one and stay with it.
- Mark the roll dates. Draw them on the chart, then ignore any change in the count inside that window.
- Track weekly change, not daily. Weekly moves carry signal; daily moves mostly carry noise and administration.
- Pair it with price direction. Note which of the four combinations applies, and write the label down rather than trusting memory.
- Check the trader breakdown. A rise driven by hedgers means something different from a rise driven by funds.
Then review your notes after three months. Patterns that survive a quarter are worth keeping, and the rest are stories.
Common Mistakes
Five errors account for most of the confusion around this number.
Expecting a Spot Forex Figure
There is no market-wide count for spot currencies, because the market has no central register. Any figure you find covers one venue.
Confusing It With Volume
Volume counts trades in a session, and open interest counts live contracts. Our comparison of open interest and volume sets the two side by side.
Reading the Roll as a Signal
Front-month counts collapse near expiry every single time. Traders who miss that read a scheduled event as a warning.
Treating It as Fast Data
The figure lands the next day, and the positioning report lands three days after its snapshot. Both are slow by design.
Ignoring the Session Clock
A quiet holiday session produces small changes that mean nothing. Our note on forex trading sessions covers when activity genuinely thins out.
Where It Fits Alongside Everything Else
Open interest is a slow, honest measure of commitment in a listed market. It rewards patience and punishes anyone hunting for a daily trigger.
Pair it with the calendar, since scheduled events reshape positioning more than anything else. Our economic calendar marks the dates that matter.
For chart-side tools that measure activity on spot pairs, browse the MT4 indicators library. Just remember which figure you are actually looking at.
FAQ
Does spot forex have open interest?
No. Spot currency trading happens over the counter, so each deal lives on the books of the two parties involved. No central clearing house holds a register of every open position, and without that register no market-wide total can exist. Currency futures do carry a real count, which is why traders use them as a proxy.
Is open interest the same as volume?
No. Volume counts contracts traded during a session and resets to zero the next day. Open interest counts contracts still live at the close and carries forward until traders close them. Heavy volume with a flat count means positions changed hands rather than being created.
Does rising open interest mean price will rise?
It does not. Every contract has a long side and a short side, so the count is balanced by definition and cannot point anywhere. Traders read it alongside price direction, which is where the traditional four-way labels come from. Those labels are rules of thumb rather than reliable rules.
Why does the figure drop before expiry?
Traders roll their positions into the next contract month. The front-month count drains while the next month fills, so the fall reflects the calendar rather than a change of view. Mark the roll dates on your chart and ignore the count inside that window.
How often does the number update?
Exchanges publish a preliminary figure the next morning and confirm it later the same day. There is no official intraday value. Anything presented as live open interest is somebody’s estimate rather than the clearing house count.
Can I see open interest in MetaTrader?
Not for spot pairs, because the data does not exist. The volume histogram in the platform counts price changes rather than contracts, so it measures how busy the feed was. For real contract counts you need exchange data on a futures symbol.
Which currency contracts carry the most open interest?
The euro, yen and pound contracts on the main American exchange usually lead, with the Australian and Canadian dollars behind them. Sizes shift over time, so check current exchange data rather than trusting an old ranking. Thin contracts produce jumpy counts that read as drama and mean very little.
Do options have open interest as well?
Yes, and it works the same way, except that each strike and each expiry keeps its own count. Traders watch large counts at round levels because dealers hedge those positions in the underlying market as expiry approaches. The effect is real, though a strong trend overwhelms it easily.
What counts as a meaningful change?
Compare the weekly change with the past year of weekly changes in the same contract. A move in the top tenth of that range deserves attention, and anything in the middle is routine. Judging a change against another market or another contract tells you nothing useful.
Is it worth tracking for a spot trader?
It can be, provided you treat it as slow background context on committed positioning rather than a trade trigger. Track the weekly change in the matching futures contract, note the trader breakdown, and review your notes over months. Results are not guaranteed; past performance is not indicative of future results.
External references
- For background on this concept, see Open Interest at Investopedia.
- For broader market context, see Futures Contract on Wikipedia.
- The open interest figures that sit beside the trader categories are documented in Disaggregated Commitments of Traders Explanatory Notes at the CFTC.

About the author
Written by Dominic Walsh, a Forex trader and MT4/MT5 indicator, Expert Advisor and script developer. Every tool on forexmt4systems.com is tested on live charts before release and ships with ready-to-use compiled MT4 (.ex4) and MT5 (.ex5) files. Learn more about the trader and developer behind this site.
How we build, test and correct every tool: Editorial & Testing Policy. Trading carries risk; see the disclaimer.