
Two numbers sit under every futures chart, and traders mix them up constantly. One resets every session, and the other carries on.
That single difference is the whole of open interest vs volume. One counts activity, the other counts commitment, and reading them together says more than either alone.
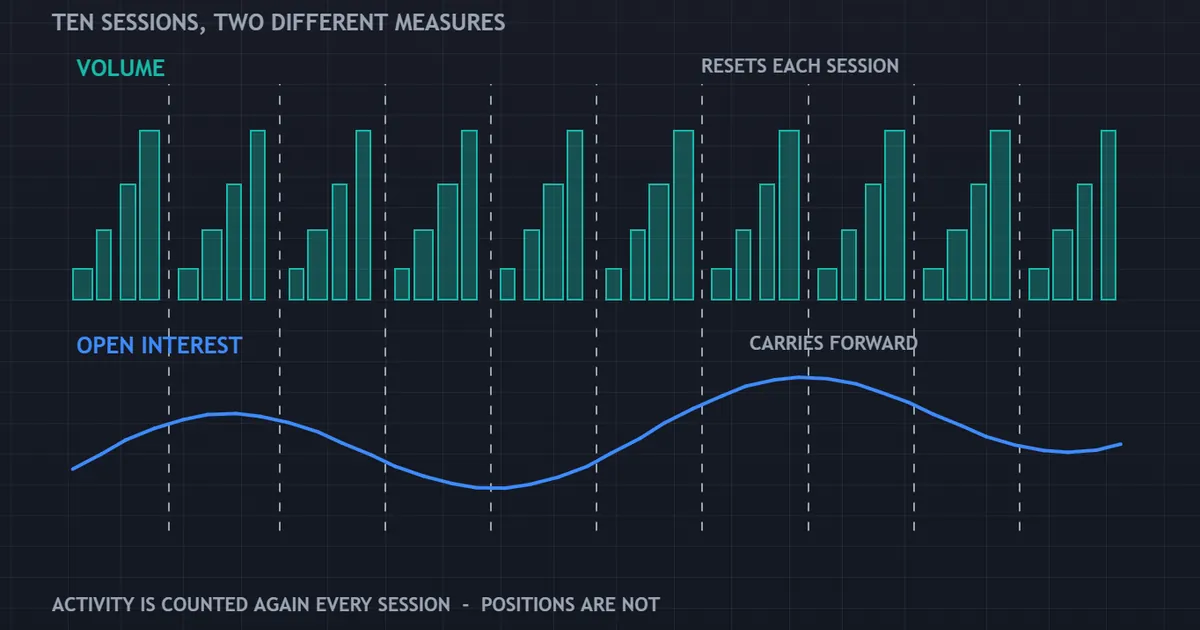
Open Interest vs Volume: The Core Difference
Volume counts contracts traded during a session. When the bell rings, the counter goes back to zero.
Open interest counts contracts still live at the close. Nobody resets it, so it carries forward until traders close those positions or the contract expires.
Flow Against Stock
Economists call this a flow against a stock. Volume is the water through the pipe, and open interest is the water in the tank.
A pipe can run hard while the tank stays level. That happens whenever contracts change hands rather than being created.
One Trade, Two Effects
Every trade adds to volume. Not every trade changes the contract count.
So the two numbers move together sometimes and apart at other times. Those disagreements carry the useful information.
Why Both Exist
Volume answers how busy today was. Open interest answers how much exposure the market still holds.
Busy days with no change in exposure happen often. So do quiet days that steadily build a large position base.
Neither number ranks above the other. They cover different ground, and a trader who watches only one keeps missing half the picture.
The habit worth building is simple. Read them as a pair, in that order, every time you look.
A Week of Sessions Side by Side
A small table settles this faster than any definition. Watch how one column resets and the other does not.
| Session | Volume | Open interest at close | What happened |
|---|---|---|---|
| Monday | 1,000 | 1,000 | Every trade opened a new contract |
| Tuesday | 600 | 1,000 | Contracts changed hands only |
| Wednesday | 900 | 1,500 | Mostly new positions again |
| Thursday | 1,200 | 1,100 | Heavy trade, many positions closed |
| Friday | 300 | 1,150 | Quiet, with a few new contracts |
Total volume across the week was four thousand. Open interest ended at one thousand one hundred and fifty.
Neither figure contradicts the other. They answer different questions, and the week’s story lives in the gap between them.
Reading Thursday
Thursday looked like the busiest day of the week. Yet exposure fell, because more traders left than arrived.
A trader watching volume alone would call that day a breakout. A trader watching both would call it an exit.
Same tape, two readings. That gap is the reason anyone bothers with the second number.
Reading Friday
Friday looked dead by comparison. Even so, the contract count crept up.
Quiet accumulation shows up exactly like that. It rarely makes the headlines and often matters more.
Check the two columns together for a month. Most traders find at least one week where the busy day and the meaningful day were not the same day.
What Volume Actually Measures
Volume seems simple until you ask which volume. Three versions circulate, and they are not interchangeable.

Exchange Volume
On a futures exchange, volume counts contracts traded. Each contract has a fixed size, so the figure has a real unit behind it.
That makes it comparable day to day and week to week. It also makes it comparable across traders, since everyone sees the same tape.
Tick Volume in MetaTrader
The histogram on a spot forex chart counts price updates, not contracts. A busy feed produces a tall bar whether one lot traded or one thousand.
It still tracks activity reasonably well, because busy markets update more often. Just never call it traded size.
Broker or Venue Volume
Some platforms show real traded size from their own venue. That figure is genuine, though it covers one slice of the market.
Comparing it with an exchange figure makes little sense. Different populations produce different numbers.
Ask the provider which one it publishes. A one-line answer saves months of quiet confusion later on.
What the Contract Count Actually Measures
Open interest has one strict definition, and it never varies by venue. Each live contract counts once.
Committed Exposure
A live contract means somebody carries risk overnight. Margin sits at the clearing house, and the position must eventually close.
So the count measures commitment rather than enthusiasm. Enthusiasm is what volume measures.
It Updates Once a Day
Exchanges publish a preliminary count the next morning. There is no official intraday figure at all.
Volume, by contrast, updates tick by tick. That timing gap alone stops the two being direct substitutes.
It Belongs to Listed Markets
Futures and options carry the count because a central body registers every position. Our explainer on what open interest is works through the mechanics.
Spot currency trading has no such register. We come back to that, since it changes what a forex trader can actually use.
Three Places the Two Numbers Disagree
Disagreement is where this pair earns its keep. Three settings produce it again and again.
Around an Expiry
Volume swells while the front-month count drains away. Nothing about the market changed, because the calendar simply moved on.
Mark those weeks in advance. Then the chart stops shouting at you.
On a News Spike
A release brings a burst of trade within seconds. Much of it closes existing positions, so the count can fall on a huge day.
The first hour is mostly exits. Fresh exposure tends to arrive over the days that follow.
In a Slow Trend
Volume can drift lower for weeks while the count climbs. Fewer trades, larger holders, and a quietly growing base.
Those stretches look dull on a volume panel alone. The count is what shows the build.
The Four Combinations and Their Labels
Futures traders pair the direction of price with the direction of the count. Four cases follow, each with a traditional reading.
- Price up, count up. New buyers are committing, so the move carries fresh backing.
- Price up, count down. Shorts are closing, so the rise may run on covering rather than conviction.
- Price down, count up. New sellers are committing, so the fall carries fresh backing.
- Price down, count down. Longs are leaving, so the fall may be liquidation rather than a new view.
Volume sits underneath all four as a measure of how much happened. A large move on thin volume with no change in exposure is mostly noise.
Where the Labels Come From
These readings date back to early futures literature on grain and metals. They survive because the mechanism behind them is simple and real.
People opening positions behave differently from people closing them. That is all the labels claim.
Where They Break Down
Hedgers, spread traders and option desks all sit inside the same total. None of them is expressing the view the label assumes.
So treat the four cases as a starting question. Our guide to combining indicators covers how to hold a weak signal lightly.
Download the complete indicator database
Put these concepts on your charts. One email unlocks the full library of 1,380+ indicators with compiled MT4 and MT5 files, plus my TradingView scripts. No paywall, no spam, unsubscribe any time.
Get free access to my indicator database
One email unlocks 1,380+ free MT4, MT5 and TradingView indicators — the complete library. No single-tool download; you get the whole database.
Rising Volume With a Falling Count
This pair appears constantly, and it has one clear meaning. Positions are closing faster than new ones open.

What Is Happening Underneath
Heavy trading tells you plenty of orders crossed. A shrinking count tells you those orders mostly matched an opener against a closer, or two closers together.
The net effect is exposure leaving the market. Somebody is going home flat.
Why It Matters at Extremes
A sharp move on heavy volume with a collapsing count often marks capitulation. The people who had to get out have got out.
That does not mark a low or a high. It marks the end of a particular group’s involvement, which is a different claim.
The Roll Trap
Near expiry, traders move to the next contract month. Volume jumps and the front-month count collapses, purely because of the calendar.
Check the roll schedule before reading anything into that week. Missing it turns routine administration into an imagined signal.
Rising Volume With a Rising Count
The opposite pair carries the opposite meaning. New contracts are forming, so fresh exposure is entering.

New Money, Not New Direction
Every new contract needs a buyer and a seller. So growth in the count proves commitment on both sides, never agreement.
Direction still comes from price. The count only tells you the crowd behind that price got bigger.
Why Traders Value It
A trend with growing exposure has a wider base of participants. There are more people to defend the move and more people to unwind it later.
That second half is easy to forget. Every contract added today is an exit order waiting for a date.
Reading It Over Weeks
Daily changes are noisy, and weekly changes are readable. Our walkthrough of how to use the COT report shows how the weekly figures fit together.
Then compare each week with the past year. A change only counts as large relative to that contract’s own history.

A Worked Read of One Move
Rules make sense once you walk one example through. No prices needed for this.
The Setup
A contract has traded sideways for a month. Volume runs at its average, and the count sits near the middle of its yearly range.
The Break
Price clears the top of the range on double the usual volume. Next morning the count comes in five percent higher.
Both numbers agree, so fresh money joined the move. That is the cleanest version of a breakout in this data.
The Alternative
Same break, same heavy volume, yet the count comes in lower instead. Now the move rode on shorts leaving rather than buyers arriving.
The break may still run. It simply has a thinner base under it, and the fuel that pushed it has already gone.
What You Do With That
Neither version tells you to trade. Both change how much room you give the position and how fast you expect follow-through.
Putting Them on One Chart
Layout does a lot of work here. A clear panel beats a clever rule.
Bars for Flow, a Line for Stock
Draw volume as bars in its own panel. Draw the contract count as a single line above them.
Shape does the teaching. Bars jump about while the line moves slowly, which is exactly the point.
Mark the Roll Weeks
Add a shaded band across each expiry window. Then you never mistake a roll for a change of heart.
Add a Weekly Change Row
Under both, plot the week-on-week change in the count. Small bars mean very little, and tall ones ask a question.
Keep the scale fixed across months. A rescaled panel makes every quiet week look dramatic.
Neither Figure Works the Same Way in Spot Forex
Currency traders need to be clear about this before building anything. Spot forex is an over-the-counter market.
No Central Register, No Count
Deals live on the books of the two parties involved. No single body records every open position, so no market-wide contract count exists.
Anything labelled open interest on a spot platform belongs to one venue. Read it as a venue statistic and nothing more.
Volume Is a Proxy Too
Tick volume counts feed updates rather than traded size. It correlates with activity, so it flags busy periods usefully.
Treat it as an activity meter. Any conclusion that needs real traded size needs exchange data instead.
What Currency Futures Offer
Listed currency futures carry both real figures. They track spot closely, so the pair of numbers gives a workable proxy for committed positioning.
The slice is small next to global turnover. Still, a partial real count beats an invented one.
How Session Timing Distorts Both
Activity in currencies swings hard across the day. Our note on forex trading sessions covers when the tape thins out and readings get jumpy.
Compare like with like. A Tokyo hour and a London hour are different populations of traders.
Two Questions Before You Trust Either Number
Data quality decides everything downstream. Two checks take a minute each.
Which Contract Am I Looking At?
Front-month series and continuous series diverge sharply near expiry. Charting software often defaults to one without saying so.
Open the symbol details and read them once. That single check removes a whole class of false readings.
Where Did This Feed Get Its Figures?
Exchange data comes from the clearing house, and venue data comes from one broker. Both can be accurate about very different populations.
So label the source in your notes. Six months later you will not remember which was which.
Using Both in a Method
Five steps keep this pair honest and quick to check.
- Fix the data source. Pick one contract and one platform, then stop switching between them.
- Read direction first. Price leads the question, and the two counts answer it.
- Use volume for the day and the count for the week. Their update speeds differ, so their horizons should too.
- Rule out the roll. Mark expiry weeks in advance and discount changes inside them.
- Write the label down. Record which of the four cases applied, then check months later whether it meant anything for you.
That last step is what separates evidence from habit. Most traders skip it and repeat the labels forever.
Common Mistakes
Six errors cover nearly every misreading of these two numbers.
Calling Tick Volume Real Volume
The histogram on a spot chart counts price updates. Building position-size rules on it assumes a unit that is not there.
Expecting a Spot Contract Count
There is no market-wide figure for spot currencies. Venue statistics are useful, provided you label them correctly.
Reading Daily Wiggles
The contract count updates once a day and drifts for administrative reasons. A one percent daily change carries no message.
Ignoring the Expiry Calendar
Roll weeks produce dramatic charts every single time. Knowing the schedule removes the drama.
Treating the Labels as Rules
The four combinations are starting questions rather than answers. Hedgers and spreaders sit inside the same totals.
Comparing Across Markets
Contract sizes and participant mixes differ everywhere. Compare a contract with its own history, and use our currency strength meter when you want a cross-market view.
What Neither Number Contains
Both figures are honest counts, and both leave a great deal out.
Who Traded
Neither says whether a fund, a bank or a farmer took part. The weekly report adds a rough split, and it arrives late.
Why They Traded
A hedge and a bet look identical inside a count. Motive never appears in the data.
What Sits Elsewhere
A short in futures may cover a long in the cash market. The count sees one leg of a two-leg trade.
What Happens Next
Both numbers describe the past. Neither carries a view about tomorrow, whatever the traditional labels suggest.
Where This Fits in a Wider Read
These two numbers describe participation, not intention. Set them beside positioning reports, volatility and the calendar, as our overview of market sentiment indicators lays out.
For chart-side activity tools on spot pairs, browse our volume indicators library. Just keep the units straight when you read them.
In short, volume tells you how loud the room was, and the contract count tells you how many people stayed. Price still decides what happens next.
FAQ
What is the difference between open interest and volume?
Volume counts contracts traded during a session and resets each day. Open interest counts contracts still live at the close and carries forward until traders close them or the contract expires. Heavy volume with an unchanged count means positions changed hands rather than being created.
Can volume be higher than open interest?
Yes, and it happens often. A single contract can trade many times in one session, adding to volume each time while the count stays put. Very high volume against a small count usually points to short-term traders passing positions around rather than investors building exposure.
Does forex have real volume data?
Not for the whole spot market. The histogram in MetaTrader counts price updates rather than traded size, so it works as an activity meter and nothing more. Listed currency futures carry genuine traded volume and a real contract count, which is why traders use them as a reference.
Which number should I watch first?
Watch price first, then volume for the day, then the contract count for the week. The three answer different questions at different speeds. Reading the slow number for fast decisions is the most common way traders waste it.
Why does the count fall while price rises?
Usually because short positions are closing. Those buyers are exiting rather than starting something, so the rise runs on covering rather than on new commitment. It happens most visibly after a sharp fall, when trapped sellers take the first chance to leave.
Do these figures work on gold and indices?
They work on any listed contract, since the clearing house registers every position. Gold, oil and index futures all publish both numbers daily. Spot versions offered by brokers are venue statistics, and they should carry a note saying so.
How large a change should I care about?
Judge each weekly change against the past year of weekly changes in the same contract. A move in the top tenth of that range deserves a look, while anything in the middle is routine. Comparing a change with another market tells you nothing.
Is one of them more reliable than the other?
Neither wins outright, because they answer different questions. Volume is fast, exact and blind to commitment. The contract count is slow, exact and blind to the day. Traders who insist on a single number usually end up asking it something it cannot answer.
What does flat volume with a rising count mean?
It suggests patient building rather than active trading. Few trades cross, yet more of them create contracts than close them. Stretches like that often pass unnoticed, since a volume panel alone shows nothing worth a second look.
Can I automate a rule from these two numbers?
You can, though the practical problems are large. The contract count arrives once a day with a delay, roll weeks distort it, and history for spot proxies is patchy. Test any rule across several years and several contracts, and keep the expected edge modest. Results are not guaranteed; past performance is not indicative of future results.
External references
- For background on this concept, see Volume in Finance on Wikipedia.
- For broader market context, see CopyTickVolume in the MQL5 Documentation.
- The regulator definitions of open interest and volume that those weekly figures rest on are given in Futures Glossary at the CFTC.

About the author
Written by Dominic Walsh, a Forex trader and MT4/MT5 indicator, Expert Advisor and script developer. Every tool on forexmt4systems.com is tested on live charts before release and ships with ready-to-use compiled MT4 (.ex4) and MT5 (.ex5) files. Learn more about the trader and developer behind this site.
How we build, test and correct every tool: Editorial & Testing Policy. Trading carries risk; see the disclaimer.