
Most traders watch the greenback one pair at a time. The dollar index in forex charting does something different, because it measures the currency against a fixed basket rather than a single counterpart.
That difference matters more than most guides admit. Treat the index as context and it earns its screen space, but treat it as a trade trigger and it will mislead you.
What the Dollar Index in Forex Charting Actually Measures
The index tracks the US dollar against six other currencies. It launched in 1973 with a starting value of one hundred, and the maths behind it uses a geometric weighted mean of six exchange rates.
Six names carry the entire calculation. One of them dominates so heavily that the index behaves like a mirror of a single pair for long stretches.
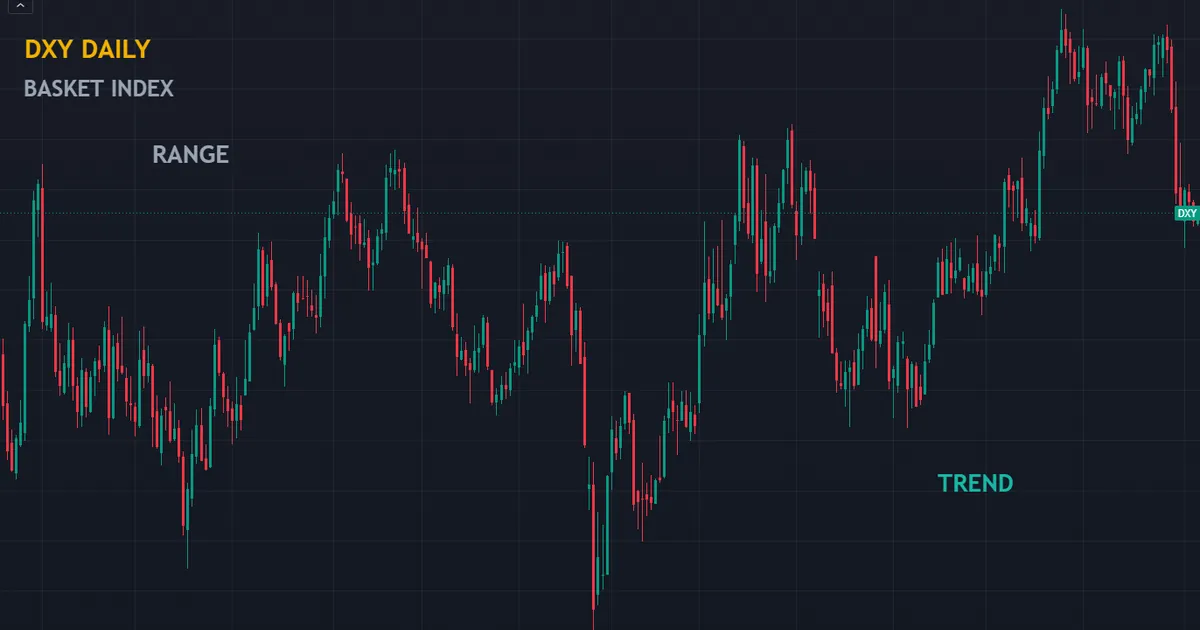
Above sits a daily chart of the index. Notice how it trends, ranges and retraces like any other instrument, since a basket still moves on the order flow hitting its components.
The Six Components and Their Weights
Here sit the fixed weights. They have not moved since 1999, when the euro replaced several legacy European currencies in one stroke.
| Currency | Weight | What that leg represents |
|---|---|---|
| Euro | 57.6% | The eurozone, and by far the dominant leg |
| Japanese yen | 13.6% | Japan, the second largest single share |
| Pound sterling | 11.9% | The United Kingdom |
| Canadian dollar | 9.1% | Canada, a top-ranked US goods partner |
| Swedish krona | 4.2% | Sweden, a holdover from the 1973 line-up |
| Swiss franc | 3.6% | Switzerland |
Add the euro, sterling, the krona and the franc together and Europe accounts for roughly seventy-seven percent of the whole thing. So the index answers a European question far more than a global one.
What the Basket Leaves Out
No Chinese yuan appears anywhere in the calculation. Neither does the Mexican peso, the Korean won nor the Indian rupee.
Those omissions matter, because Mexico, Canada and China all sit near the top of the US trade table today. A measure shaped by 1973 trade patterns cannot describe modern ones.
So the composition looks dated by design. Nobody has refreshed the weights to match current flows, and the exchange that maintains the index has no plan to do so.
Where the Basket Came From
The index dates from March 1973. Bretton Woods had just collapsed, and the major currencies started floating for the first time in decades.
The Federal Reserve built the measure to track that newly floating dollar. Trade shares of the moment set the six weights.
ICE runs the index today and lists futures on it. Only one revision has landed since launch, in 1999, when the euro folded several legacy currencies into a single leg.
Sweden never left the line-up. The krona still holds 4.2 percent, which tells you plenty about how little the basket has changed.
How the Index Gets Built, Step by Step
The formula looks intimidating and behaves simply. Five steps take you from six spot rates to one printed number.
- Take the six spot rates. Each one quotes the dollar against a basket member, using whichever market convention that pair normally follows.
- Raise each rate to its weight. The exponent equals that currency’s share, carrying a negative sign wherever the dollar sits on the quote side.
- Multiply the six results together. A geometric mean rather than an arithmetic one, so proportional moves matter instead of absolute ones.
- Scale by the fixed constant. A multiplier of 50.14348112 anchors the series to its March 1973 base of one hundred.
- Read the output as a level. A reading above one hundred says the dollar sits above its 1973 basket value, and it says nothing else.

Notice what the recipe never touches. No interest rates, no trade volumes and no positioning data enter the formula at any stage.
Why the Index Moves at All
The calculation takes six rates and nothing else. So every driver reaches the index through those rates, one pair at a time.
Rate Expectations Lead
Money chases yield. When traders expect the Fed to hold rates above its peers, dollar assets pull in flows and the basket climbs.
Expectations matter far more than today’s policy setting. A cut that everyone sees coming shifts the index long before the meeting itself.
That gap explains the phrase “priced in”. By the time a decision lands, the market has usually adjusted for it already, so the reaction can look backwards.
Risk Sentiment Cuts Across
The dollar also serves as a haven. During a scare, investors buy dollars for safety even while US rates fall at the same moment.
So the index can climb on poor US news. That outcome puzzles newcomers, and it happens often enough to plan around.
Two other havens sit inside the basket. Both the yen and the franc attract the same flight, so a broad panic can push the legs in opposite directions.
Positioning Adds Noise
Crowded trades unwind. When too many traders lean one way, a modest surprise sparks a large move as they all reach for the exit.
None of that appears in the formula. The index records a result and explains none of the cause behind it.
Reading the Dollar Index as Context, Not as a Signal
The Question It Answers Well
A single pair always mixes two stories. When EURUSD drops, the move could come from dollar strength, euro weakness, or some blend of both.
The index helps you separate those. If it rises while EURUSD falls, the dollar leg drove most of the move.
If it barely budges while EURUSD falls, the euro leg did the work instead. That distinction changes which other pairs deserve a look next.
Where the Euro Weight Bites
Here the basket design creates a trap. Because the euro carries more than half the weight, the index and EURUSD travel as near mirrors most of the time.
So confirming a EURUSD idea with the index adds almost nothing. You have simply looked at the same information twice and felt better about it.
For a genuine second opinion, reach for a measure that treats every major currency evenly. Our currency strength meter does that, and it disagrees with the index more often than newcomers expect.
A Practical Reading Routine
Start with the index before you open any pair. One glance tells you whether the session has a dollar theme running through it.
Then check whether your intended pair even contains a dollar leg. Crosses such as EURJPY or AUDNZD sit outside the basket entirely, so the index tells you very little about them.
Finish by asking what would change your view. A macro backdrop deserves a level that invalidates it, exactly like a chart setup does.
A Worked Example: Splitting a Move Into Two Legs
Theory settles once you run a real morning through it. Here sits the routine on a day when EURUSD drops hard.
Step One: Check the Basket
Open the index first. Suppose it has climbed steadily since the London open.
That climb points at the dollar leg. Something has made dollar assets more attractive, or something has driven frightened money towards them.
Step Two: Check the Other Dollar Pairs
Now scan USDJPY, USDCHF and USDCAD. If all three lean the same way, a dollar story holds across the board.
If only EURUSD moved, the index reading came from its euro weight alone. The basket dressed a euro story up as a dollar one.
Step Three: Check a Cross With No Dollar
Finally, look at a pair that excludes the dollar completely. EURGBP and EURAUD both work well for this.
A falling euro on those crosses confirms a euro story. A steady euro there points straight back at the dollar.
What the Three Checks Buy You
The table below turns those three readings into a decision. Nothing here forecasts anything, and that limitation matters.
| What the index shows | What other dollar pairs show | Reasonable reading |
|---|---|---|
| Climbing sharply | USDJPY, USDCHF and USDCAD all climbing | A broad dollar move worth respecting |
| Climbing sharply | Other dollar pairs roughly flat | A euro move wearing a dollar mask |
| Roughly flat | EURUSD falling hard | A euro story, so study euro crosses next |
| Climbing while the yen leg firms | Haven pairs bid across the board | Risk sentiment rather than rate expectations |
Three glances take under a minute. They stop you trading a euro headline as though it concerned the whole dollar complex.
The Long View and the Short View
Zoom out and the index behaves like a slow macro series. Multi-year swings dominate, and they track policy cycles rather than any single data release.

The weekly chart above shows that character clearly. Long directional stretches alternate with wide ranges that can run for years without resolving.
Those long ranges explain why the index makes a poor entry trigger. A series that turns two or three times a decade cannot time a trade you plan to hold for two days.
What the Long View Helps With
Regime awareness, mostly. A trader who knows the dollar has climbed for months will handle dollar-selling setups with rather more caution.
It also frames the funding question. Broad dollar strength tends to tighten financial conditions worldwide, which usually pressures emerging market currencies hardest.
Check the release schedule alongside it. Our economic calendar shows which events land in the week ahead, so you know when the macro backdrop faces a real test.
The Trade-Weighted Alternative
What the Federal Reserve Publishes
The Federal Reserve maintains its own dollar measures, and they work quite differently. Those indexes weight partner currencies by actual trade shares, and the staff refresh the weights every year.
Three variants exist. A broad index covers a wide partner set, while two narrower ones split advanced economies from emerging ones.
Because the yuan and the peso both appear in the broad version, it captures flows the six-currency basket simply cannot reach.
Why the Gap Between Them Matters
The two measures disagree, sometimes for months at a stretch. A dollar that softens against the euro while firming against Asian partners can look weak on one gauge and steady on the other.
Neither reading counts as wrong. They answer different questions, so the sensible move involves knowing which question you asked.
Traders quoting “the dollar” without naming a measure usually mean the six-currency basket. That habit hides an assumption worth making explicit.
Other Single-Currency Baskets Exist
The dollar hardly stands alone here. Brokers and data vendors publish euro, yen and sterling baskets built on the very same idea.
Those alternatives share the same weakness. Somebody chose the components and the weights, and that choice shapes every reading afterwards.
Read the construction notes before you trust any of them. A basket with an undisclosed recipe tells you nothing you can check for yourself.
Download the complete indicator database
Put these concepts on your charts. One email unlocks the full library of 1,380+ indicators with compiled MT4 and MT5 files, plus my TradingView scripts. No paywall, no spam, unsubscribe any time.
Get free access to my indicator database
One email unlocks 1,380+ free MT4, MT5 and TradingView indicators — the complete library. No single-tool download; you get the whole database.
Common Mistakes and Their Fixes
Five habits turn a useful context tool into a source of bad trades. The panel below sets the two measures side by side.

Calling It a Global Dollar Gauge
The basket covers six currencies from advanced economies. Say “the six-currency basket” in your own notes, and the overclaim disappears on its own.
Using It to Confirm a EURUSD Trade
Two views of the same relationship never add up to two reasons. Confirm with something structurally different, such as an evenly weighted strength reading or the yield backdrop.
Trading the Index Level Itself
Round numbers on the index attract commentary and very little order flow. Retail platforms often quote it as a synthetic product with a wider spread, so the cost of that trade tends to exceed the cost of trading a component pair.
Applying It to Crosses
A basket reading has no direct bearing on EURGBP or AUDNZD. Both legs sit outside the calculation, so the index describes something else entirely.
Assuming the Weights Still Reflect Trade
They stopped reflecting trade decades ago. For a trade-based picture, go to the central bank series instead, and treat the basket as a market convention rather than an economic statistic.
A Quick Reference Checklist
Run through these five lines before the index shapes any decision. Each one takes seconds.
| Check | What it means in practice |
|---|---|
| Which measure am I reading | The six-currency basket, or a trade-weighted central bank series |
| Does my pair contain a dollar | Crosses sit outside the basket, so the reading does not apply |
| Am I double-counting the euro | An index read plus a EURUSD read is one opinion, not two |
| What is the timeframe of my idea | A weekly macro series cannot time a two-day trade |
| What would change my mind | Write the level or the event that ends the macro view |
None of those five involve a better indicator. All five involve clearer thinking about a number you already had.
Intraday Behaviour and Where It Goes Wrong
Drop the index to an intraday timeframe and its character shifts. The clean macro story fragments into session-driven noise.

Why the Four-Hour Chart Disappoints
The chart above shows the same instrument on a much shorter clock. Swings shrink, direction changes more often, and the tidy trends of the weekly view scatter into overlapping ranges.
Part of that comes from the basket itself. Each component trades most actively during its own regional hours, so the index blends six liquidity profiles into one line.
During the Asian session, the yen leg carries unusual influence while European legs sit quiet. The reading moves, yet it describes a thin market rather than a broad shift.
The Synthetic Quote Problem
Many retail platforms build their index quote from their own feed. Small differences in the six underlying rates produce visible differences in the printed level.
So two traders can watch the same index and see slightly different charts. That gap rarely matters for context and matters a great deal for a tight stop.
What Still Works Intraday
Direction of the day, broadly. If the index has trended one way since the London open, dollar pairs across the board usually carry that lean.
Beyond that, treat intraday readings gently. A four-hour wiggle on a six-currency average rarely justifies changing a plan you built on structure.
Session boundaries deserve a note too. The index often reverses its early lean once New York arrives, simply because a fresh set of participants takes over the flow.
A Sanity Check Before You Act
Ask one question whenever the intraday index tempts you. Would this reading still look meaningful with the euro leg removed?
Usually the honest answer arrives quickly. Most sharp intraday index moves trace back to a single European headline, and naming that headline beats trading the average.
Related Concepts Worth Reading Next
The index sits inside a wider macro toolkit. Three neighbouring ideas make it far more useful.
Rate expectations drive most of what the basket records, so our guide to bond yields and forex covers the machinery underneath. Read it alongside this piece and the dollar’s longer swings start to make more sense.
On the other side sit the export-driven currencies. Our explainer on commodity currencies covers why some of them ignore the dollar story completely, while forex commodity correlations handles the measurement side honestly.
Newer traders should start further back. Our overview of how forex trading works covers the quoting conventions this article assumes throughout.
Building the Index Into a Weekly Routine
Knowledge changes nothing without a habit attached. A short weekly pass turns the index into a working tool.
Sunday: Mark the Regime
Open the weekly chart and write one sentence about direction. Rising, falling or ranging covers it, and no further precision helps.
Then note the last obvious swing high and low. Those two levels frame the coming week without any forecast attached.
Daily: Check for a Dollar Theme
Before the London open, glance at the daily index bar. A strong move there tells you the day carries a dollar theme, so dollar pairs deserve first look.
A flat bar tells you the opposite. Crosses and single-country stories will probably offer better structure that day.
Monthly: Compare the Two Measures
Once a month, put the basket next to a trade-weighted series. Divergences between them flag exactly the periods when the six-currency shorthand misleads.
Correlation tools help here too. Our forex correlation matrix shows how tightly your open pairs actually track each other, which often exposes the same hidden euro concentration.
Keep Your Language Precise
Watch how you describe the move to yourself. Saying the basket rose keeps you honest, while saying the dollar rose quietly commits you to a claim the data may not support.
Traders who want an automated read can browse our currency strength indicators archive. Any such tool works as a spotter, and the judgement stays with you.
FAQ
What does the dollar index actually measure?
It measures the US dollar against a fixed basket of six currencies, using a geometric weighted mean anchored to a March 1973 base of one hundred. The euro carries 57.6 percent of the weight, followed by the yen, sterling, the Canadian dollar, the Swedish krona and the Swiss franc. A reading of one hundred and five simply says the dollar sits five percent above its 1973 basket value.
Is the dollar index a trade-weighted measure?
No, and that misunderstanding causes real confusion. The weights came from 1973 trade shares and changed only once, in 1999, when the euro absorbed several legacy European currencies. The Federal Reserve publishes genuine trade-weighted indexes that update annually and include the yuan and the peso, so those serve far better when you want an economic reading.
Why does the index track EURUSD so closely?
Because the euro alone accounts for more than half the basket. Add sterling, the krona and the franc and European currencies reach roughly seventy-seven percent, so a large euro move drags the whole index with it. Using the index to confirm a EURUSD view therefore gives you one opinion dressed up as two.
Can I trade the dollar index directly?
Futures on the index trade on ICE, and many retail brokers offer a synthetic version as a contract for difference. Spreads on the retail product usually run wider than on a component pair, and the quote depends on the broker’s own six underlying rates. For most traders, expressing the same view through a liquid dollar pair costs less.
Does the index help with currency crosses?
Very little. A cross such as EURJPY or AUDNZD contains no dollar leg, so the basket describes a different question. Crosses respond to the relative story between their own two currencies, which an evenly weighted strength reading captures far better.
How does the index differ from a currency strength meter?
A strength meter usually compares every major currency against every other one and scores each in turn. The dollar index compares one currency against six fixed partners, with the euro dominating the result. So a meter can tell you the dollar ranks third strongest this week, while the index only tells you where the basket sits relative to 1973. Use the meter for relative ranking and the basket for the longer macro backdrop.
Should the index ever trigger a trade on its own?
Treat it as context rather than as a trigger. The index turns direction only a handful of times per decade on the weekly chart, and its intraday behaviour reflects six regional liquidity profiles blended into one line. Use it to frame which side of the market deserves attention, then let structure, levels and risk rules decide the trade itself. Results are not guaranteed; past performance is not indicative of future results.
External references
- For background on this concept, see US Dollar Index (USDX) at Investopedia.
- For broader market context, see H.10 Foreign Exchange Rates at the Federal Reserve.

About the author
Written by Dominic Walsh, a Forex trader and MT4/MT5 indicator, Expert Advisor and script developer. Every tool on forexmt4systems.com is tested on live charts before release and ships with ready-to-use compiled MT4 (.ex4) and MT5 (.ex5) files. Learn more about the trader and developer behind this site.
How we build, test and correct every tool: Editorial & Testing Policy. Trading carries risk; see the disclaimer.