
The Bollinger Bands vs Keltner Channel question comes up the moment a trader stacks two volatility envelopes and sees them behave differently. Both wrap price in an upper and lower band, yet one flexes on standard deviation while the other flexes on the average true range.
So this guide settles the Bollinger Bands vs Keltner Channel debate with plain mechanics and a real example. By the end, you will know which envelope breathes harder on a volatility spike, which one stays smoother, and why the two combine into the famous squeeze setup.
Bollinger Bands vs Keltner Channel: The Core Difference
Start with the one distinction that drives everything else. Bollinger Bands measure volatility with standard deviation, while Keltner Channels measure it with the average true range. So the two envelopes react to the same market with a noticeably different rhythm.
John Bollinger built his bands in the early 1980s around a 20-period simple moving average. He set the outer bands two standard deviations away, so they widen sharply when prices scatter and pinch tight when prices calm. So the bands breathe hard on any burst of volatility.
Chester Keltner inspired the channel that carries his name, later refined into a 20-period exponential moving average with bands set by the average true range. Because ATR smooths its volatility read, the Keltner bands widen and narrow more gently. So the channel drifts where the bands can lurch.
The chart below stacks both envelopes on EURUSD, four-hour, near 1.14. The Bollinger Bands flare wide on a sharp candle while the Keltner Channel holds a steadier, narrower shape around the same price.

Notice the reaction to that one big candle. The Bollinger Bands jump outward at once, while the Keltner Channel barely flinches. So the picture proves the headline difference: standard deviation is jumpy, and the average true range is calm.
That contrast is not a flaw in either tool. Each simply answers a slightly different question about the same market. So the smart move is to use them together, letting the jumpy bands flag the spike and the calm channel hold the bigger picture steady.
Standard Deviation Versus ATR
The measuring stick is the real story here. Standard deviation reacts instantly to a single wild close, so the Bollinger Bands can balloon on one bar. The average true range averages the recent bar ranges, so the Keltner Channel needs sustained movement to widen.
So this gives each tool a personality. Because Bollinger Bands respond fast, they flag a volatility spike quickly but also give more false widenings. Because Keltner Channels respond slowly, they miss the first jolt yet paint a cleaner picture of a lasting trend.
Two Traders, Two Eras
The tools carry the fingerprints of their creators. Chester Keltner sketched an early moving-average band in the 1960s, and later traders swapped in the average true range to give it today’s smoother form. So the channel evolved through several hands before it settled.
John Bollinger came later with a sharper statistical idea. He wanted a band that adapted to volatility automatically, so he reached for standard deviation rather than a fixed distance. So the bands measure how far recent prices scatter, which makes them react faster than Keltner’s averaged range.
How Each Envelope Is Built
Learn the recipe once and the behavior follows. Both tools center on a 20-period average and add bands around it, but the details differ. The steps below cover each in turn.
- Bollinger middle. Take a 20-period simple moving average of the closes.
- Bollinger bands. Add and subtract two standard deviations of those closes.
- Keltner middle. Take a 20-period exponential moving average of price.
- Keltner range. Measure the average true range over the same window.
- Keltner bands. Add and subtract roughly two times the ATR from the center line.
The concept graphic below sets the two recipes side by side, so you can see the SMA-and-deviation build against the EMA-and-ATR build.

One detail explains most of what you see. The Bollinger middle is a simple average, and the Keltner middle is an exponential one. So the Keltner center reacts a touch faster to fresh price, even while its outer bands stay calmer than Bollinger’s.
The Settings That Matter
Both tools ship with sensible defaults. Bollinger Bands use 20 and 2, meaning a 20-period average with bands two deviations out. Keltner Channels use a 20-period EMA with bands two ATRs wide, though some platforms default the multiplier to 1.5.
Change the multiplier before you change the length. Because a wider multiplier captures more of the move inside the bands, nudging it adjusts how often price tags the edge. So start with the standard settings, then widen or tighten one number at a time with a clear reason.
Bollinger Bands vs Keltner Channel Compared
The table below sums up the split at a glance. Keep it handy until the difference feels automatic.
| Feature | Bollinger Bands (20, 2) | Keltner Channels (20, 2 ATR) |
|---|---|---|
| Center line | 20 SMA | 20 EMA |
| Band basis | Standard deviation | Average true range |
| Reaction | Fast, jumpy | Slow, smooth |
| Volatility spike | Bands flare wide | Bands widen gently |
| Best read | Volatility extremes | Trend direction |
| Creator | John Bollinger | Chester Keltner |
The Squeeze: Where They Team Up
The two tools produce their best signal together, not apart. When calm volatility pulls the Bollinger Bands inside the Keltner Channel, the market has coiled unusually tight. So that overlap is the classic squeeze, a warning that energy is building.
Understand why the overlap means so much. Because standard deviation drops faster than ATR in a quiet market, the Bollinger Bands shrink inside the steadier Keltner walls. So the bands slipping within the channel marks a genuine low in volatility, not just a passing lull.
Reading the Squeeze Fire
The squeeze ends when the Bollinger Bands push back outside the Keltner Channel. That expansion signals volatility waking up, often at the start of a strong move. So traders watch the bands break free of the channel as the trigger to prepare.
The squeeze never names a direction, though. Because both tools only measure volatility, the coil says a move is coming without saying which way. So wait for price to break structure or for momentum to pick a side before you commit to the expansion. Our guide to what is ATR in trading shows how to size a stop for that break.
Putting a Number on the Squeeze
You do not have to eyeball the overlap. Many platforms plot a squeeze indicator that turns green or red depending on whether the Bollinger Bands sit inside the Keltner Channel. So a simple dot on the chart tells you the coil is on or off.
Use that read as a filter, not a trigger. Because the dot only reports volatility, it still says nothing about direction. So let the squeeze indicator flag when to pay attention, then hand the actual entry decision to price and momentum.
How the Pair Fits a Real Workflow
Each envelope suits a different job, so let the market decide which to lean on. In a trend, the Keltner Channel frames the direction cleanly. In a volatility play, the Bollinger Bands flag the extremes and the squeeze.
Read the environment first, exactly as with any tool. When price rides the upper Keltner band in a smooth climb, the trend is healthy and pullbacks to the middle EMA offer entries. So the calm channel keeps you in a move that jumpy bands might scare you out of.
Pairing With Momentum
Both envelopes stay silent on direction, so add a directional voice. A momentum tool or a trend read tells you which way to trade the squeeze break or the channel ride. So the envelope frames the volatility while the partner picks the side.
Keep the pairing lean. Because two volatility tools already overlap, adding a third envelope just clutters the chart. So run one squeeze setup plus one momentum check, and let the bands and channels indicators archive plot the family for you. The volatility indicators archive groups the ATR-based tools that pair with them.
Settings and Timeframes
Match the tools to your horizon. Swing traders read the squeeze on the daily and four-hour charts, where a coil carries real weight. Intraday traders drop to the one-hour, though faster charts print more false squeezes that fizzle.
Gauge the current range before you size a trade. Because the squeeze warns of expansion without saying how far, a volatility read helps you set a sensible stop. Our free forex volatility calculator measures the recent range so you can size around the break.
Worked Example: A EURUSD Squeeze Break
Picture EURUSD coiling on the four-hour chart near 1.140. The Bollinger Bands have slipped fully inside the tighter Keltner Channel, and the whole envelope has pinched into a narrow neck. The market is clearly storing energy.
Now read the setup as a whole. The squeeze warns that expansion is near, and a break of the neck with the Bollinger Bands clearing the Keltner walls would confirm it. The chart below marks the squeeze, the expansion candle, and the direction the break finally chooses.

Then build the risk plan around the neck. A stop sits back inside the coil, below the middle EMA near 1.132, where a failed break would return price. So the tight base keeps the stop close and starts the reward-to-risk ratio in a genuinely healthy place.
Managing the Break
Let the Keltner Channel guide the trade once it runs. As price rides the upper channel band, the trend read stays intact and the position holds. So a close back inside the channel, below the middle EMA, signals the expansion has stalled and the reason to hold is gone.
Watch the Bollinger Bands for the energy read. A widening pair of bands confirms the expansion has real force behind it. So bands that peak and start to pinch again warn the move is tiring, even while price still sits high.
Trailing With the Channel
The Keltner Channel doubles as a trailing guide. As the trend runs, the middle EMA climbs behind price and marks a logical spot to move the stop. So each new bar tightens your protection without forcing an early exit on normal noise.
Let the band walk decide the pace. Because a trend that hugs the upper channel stays strong, you hold while price rides the edge. So the moment price falls back through the center EMA, you accept the trend has paused and step aside with most of the gain intact.
Download the complete indicator database
Put these concepts on your charts. One email unlocks the full library of 1,380+ indicators with compiled MT4 and MT5 files, plus my TradingView scripts. No paywall, no spam, unsubscribe any time.
Get free access to my indicator database
One email unlocks 1,380+ free MT4, MT5 and TradingView indicators — the complete library. No single-tool download; you get the whole database.
Common Mistakes With Both Tools
Most errors come from asking a volatility envelope for a direction it never provides. Each mistake below has a clean fix, and the graphic sums them up.

Trading the Squeeze Direction Blind
A squeeze warns of a move but never names the side. Guessing the direction of the break is a coin flip. So wait for price to clear the neck and confirm with structure or momentum before you pick a side.
Fading Every Band Tag
A tag of the upper Bollinger Band is not an automatic sell. In a strong trend, price walks the band while faders bleed. So confirm the environment first, and only fade an edge when the market clearly ranges sideways.
Ignoring the Center Line
The middle average on each tool is a signal, not decoration. Price crossing the EMA or SMA often marks the shift in control. So track the center line as a trend filter, and let a close on either side steer whether you fade or follow.
Stacking Redundant Envelopes
Running Bollinger Bands, a Keltner Channel, and a Donchian Channel at once clutters the chart. Because they overlap heavily, the extra lines add noise, not insight. So keep the squeeze pair for the coil signal and drop the rest.
Changing Settings Too Soon
Traders often tweak the defaults before they understand them. Random settings then produce random signals. So learn the standard envelopes first, and change one variable at a time only when a clear need appears on your charts.
Envelope Checklist
Run this quick list before any trade that leans on either envelope. A few honest seconds here filters out most weak setups. So keep it in view, and let a missing tick talk you out of a marginal entry.
- Environment identified as either ranging or trending.
- Correct tool chosen, Keltner for trend or Bollinger for volatility extremes.
- Squeeze confirmed by the Bollinger Bands sitting inside the Keltner Channel.
- Break confirmed by the bands clearing the channel walls.
- Direction picked by structure or a momentum partner.
- Stop placed beyond the neck or the center line, sized by volatility.
- Risk fixed as a small percent of the account.
When These Envelopes Fail
Study the failure as hard as the winner. Here is a common trap. A trader sees a tight squeeze on EURUSD near 1.140 and buys the moment the bands twitch, sure the break will run up. No structure backs the guess.
Then the market fakes them out. Price pokes above the neck near 1.140, sucks in the breakout buyers, and reverses hard through the lower channel toward 1.136 instead. The chart below shows that head fake, with price snapping back down while the long trade bleeds.
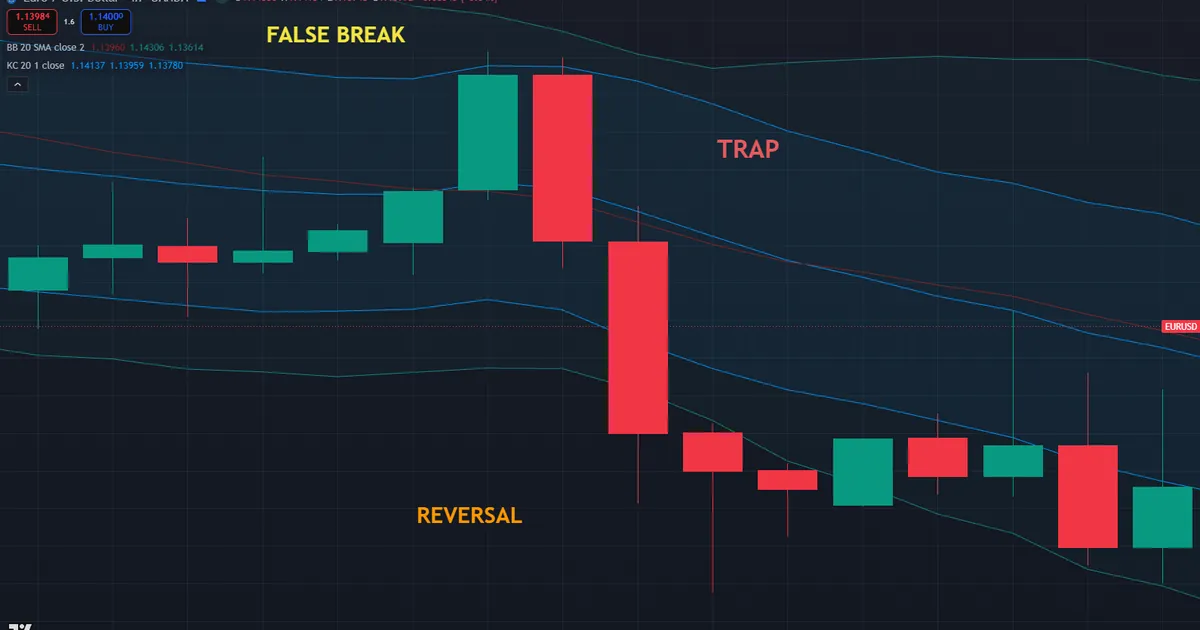
So what went wrong? The trader traded the squeeze direction blind and skipped every confirming step. Hence the core lesson: the squeeze flags that a move is coming, never which way it goes. Without a confirmed break and a directional partner, a squeeze trade is a coin flip.
False Breaks After a Squeeze
Respect the head fake as a standard event, not a rare one. A tight coil can break one way, trap traders, then swing sharply the other way. So wait for a decisive close beyond the neck, and treat a fast snap back inside as proof the real break has not happened yet.
Squeezes That Never Fire
Not every coil pays off. Sometimes the Bollinger Bands sit inside the Keltner Channel for a long stretch, then leak out with no follow-through. So a squeeze can fizzle into a slow drift rather than the sharp expansion you hoped for.
Handle the dud with patience and a stop. Because you cannot know in advance which coil runs, you only trade the confirmed break and keep risk small. So a fizzled squeeze costs little when the stop sits tight against the neck.
Bands That Lag the Turn
Be honest about the built-in delay. Both center lines are moving averages, so they turn after price, not before. So the envelopes confirm a shift rather than predict it. Treat a fresh expansion as a cue to manage risk, and lean on price structure to spot the turn the lagging tools only confirm later.
Related Concepts to Study Next
These envelopes connect to a web of sibling tools that sharpen them. A volatility play still needs a stop sized to the range, so a pure ATR gauge earns its place beside them. The Bollinger read deserves a deeper dive on its own too. Both threads appear in the sections above, ready to round out the picture. So treat each envelope as one lens, and let a partner confirm the trade.
For hands-on tactics, our guide to how to use Bollinger Bands works through live setups step by step, while Bollinger Bands explained covers the construction from scratch. So master the squeeze read first on your own, and then let any envelope on the chart simply frame the volatility you already know how to trade around.
FAQ
What is the difference between Bollinger Bands and Keltner Channels?
Bollinger Bands set their width with standard deviation around a 20 SMA, so they react fast and flare on a spike. Keltner Channels set their width with the average true range around a 20 EMA, so they stay smoother. In short, one measures scatter and the other measures the average range over recent bars.
Which one is better for trading?
Neither is simply better, since they suit different jobs. Keltner Channels frame a trend cleanly with their steadier bands, while Bollinger Bands flag volatility extremes and the squeeze. So many traders run both, using the calm channel for direction and the jumpy bands for timing. The choice depends far more on the job in front of you than on any claim that one tool beats the other.
What is the Bollinger Band squeeze with Keltner Channels?
The squeeze happens when the Bollinger Bands slip fully inside the Keltner Channel, marking unusually low volatility. It warns that a strong move may follow once the bands push back outside the channel. The squeeze never names a direction, so wait for a confirmed break before you pick a side. Traders often add a momentum tool to choose which way to trade the expansion.
Why do the Keltner Channels look smoother?
Because they use the average true range, which averages recent bar ranges rather than reacting to one wild close. Standard deviation, used by Bollinger Bands, jumps on a single large candle. So the Keltner bands widen and narrow gently while the Bollinger Bands can lurch outward on one bar. That steadier shape is exactly why many trend traders prefer the channel for reading direction.
What are the default settings for each tool?
Bollinger Bands default to 20 and 2, a 20-period average with bands two standard deviations out. Keltner Channels default to a 20-period EMA with bands roughly two ATRs wide, though some platforms use a 1.5 multiplier. So start with the standard values and change one number at a time. A wider multiplier keeps more price inside the bands, while a tighter one produces more edge tags to read.
Are these envelopes reliable on their own?
No, they measure volatility, not direction, so they work best with a trend or momentum partner. Used alone, they give false fade signals in trends and blind squeeze guesses in ranges. Pair either envelope with a directional tool, size every position with care, and manage risk on every trade. Results are not guaranteed; past performance is not indicative of future results.
External references
- For background on this concept, see Keltner Channel at BabyPips.
- For broader market context, see Volatility at Corporate Finance Institute.

About the author
Written by Dominic Walsh, a Forex trader and MT4/MT5 indicator, Expert Advisor and script developer. Every tool on forexmt4systems.com is tested on live charts before release and ships with ready-to-use compiled MT4 (.ex4) and MT5 (.ex5) files. Learn more about the trader and developer behind this site.
How we build, test and correct every tool: Editorial & Testing Policy. Trading carries risk; see the disclaimer.