
The parabolic sar vs supertrend question lands the moment you hunt for a hands-free trailing stop. Both tools ride behind price, both flip sides when a trend turns, and both draw straight onto the candles instead of a lower pane.
Yet the two indicators build that stop in very different ways. So this guide settles the parabolic sar vs supertrend choice with plain rules, honest settings, and a worked trade, so you can match one to your pair and pace.
Parabolic SAR vs SuperTrend: Two Trailing Stops
A trailing stop follows a trend and tightens as price runs. Both tools do that job, yet they show it in contrasting shapes. So the first split is purely visual.
The Parabolic SAR prints a dot below or above each candle. Welles Wilder designed it in 1978, and the name means “stop and reverse”. When the dots sit under price, the trend reads up; when they jump above, the trend reads down.
The SuperTrend draws a single line that steps along beside price. Olivier Seban popularised it, and the line rests on the Average True Range rather than a fixed step. So the band widens when volatility grows and hugs price when the market calms.
Look at a concrete frame. The chart shows GBPUSD on the four-hour timeframe with the Parabolic SAR at its default 0.02 step and 0.2 cap, plus an illustrative SuperTrend line drawn below price. Price climbs near 1.34, the SAR dots trail below each bar, and the SuperTrend line sits a little lower and smoother.
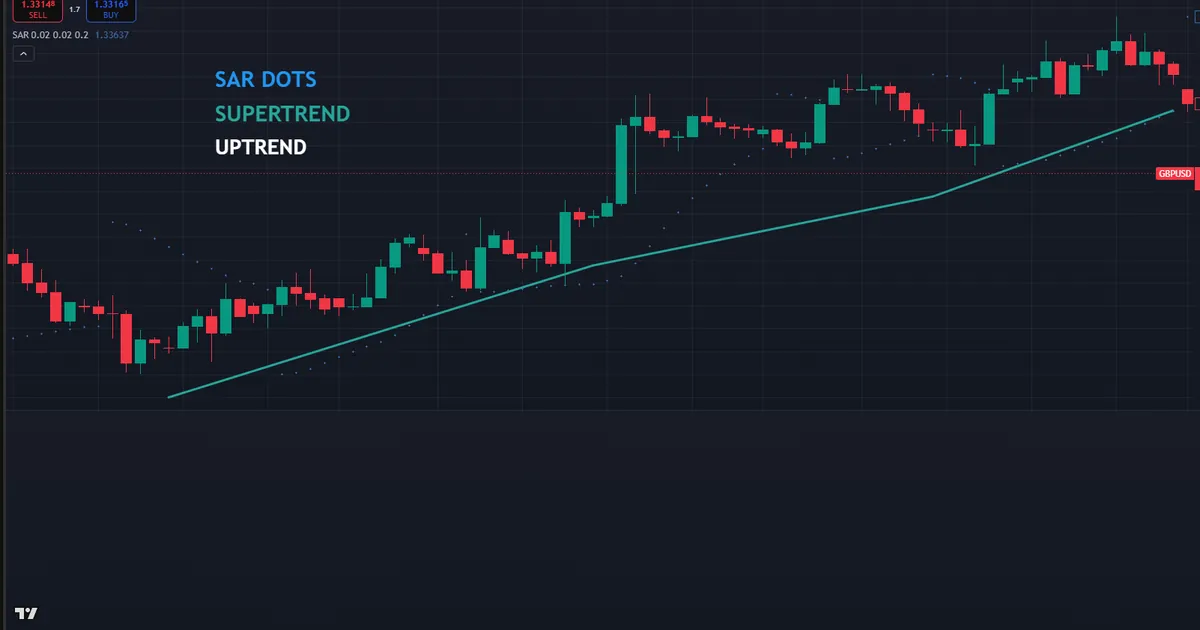
Now trace the behaviour from left to right. First both tools sit under the rising candles. Then a sharp pullback pokes the SAR while the wider SuperTrend band holds. So the dot flips early and the line waits, and that gap defines the whole comparison.
Why does the shape matter for a real trade? A tighter stop books smaller give-back but shakes you out sooner. So the choice hinges on how much room your plan grants the trend.
Where Each Tool Came From
A little history sharpens the comparison. Welles Wilder introduced the Parabolic SAR in his 1978 book, alongside the RSI and the Average True Range. His goal was a simple, self-adjusting stop that a trader could plot by hand each day.
The SuperTrend arrived decades later, once ATR-based tools were common. Olivier Seban built it to trail a trend with a band that widens and narrows as the market breathes. So one tool is a hand-drawn classic and the other a volatility-aware update, yet both chase the same trailing goal.
How Each Trailing Stop Is Built
The math behind each tool is small, so learn it once and reuse it forever. Two ideas separate them, and everything else follows.
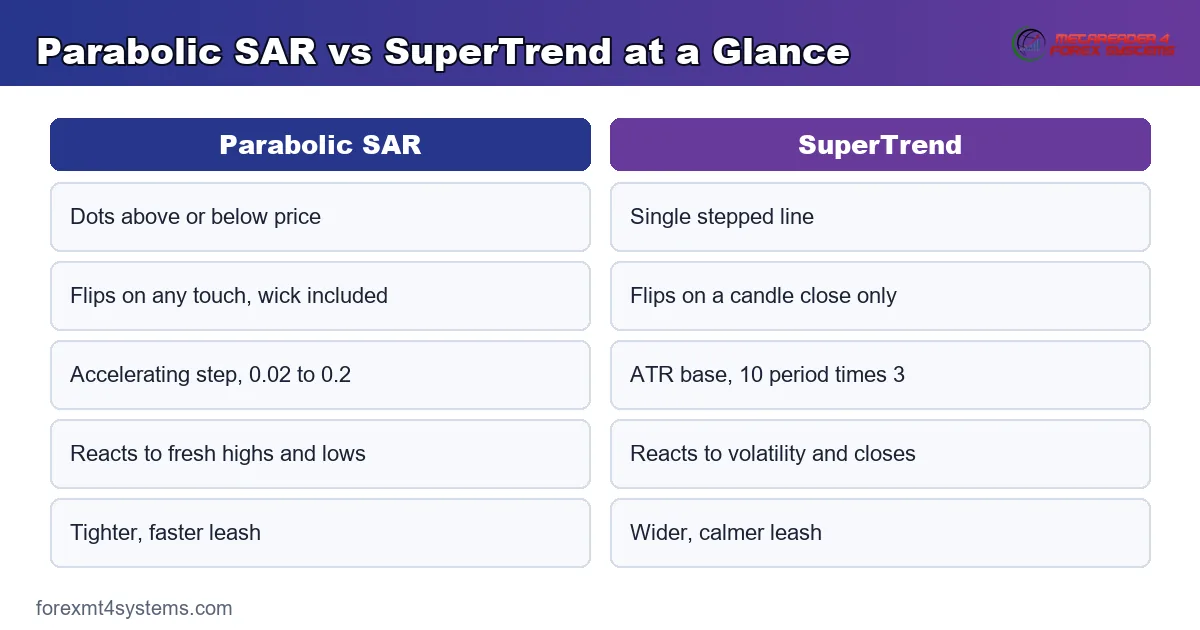
- SAR acceleration. The Parabolic SAR starts with a step of 0.02 and speeds up by 0.02 each time price prints a fresh extreme, up to a cap of 0.2. So the dots close in on price faster the longer a trend runs.
- SAR reversal. When price touches the dot, the SAR flips to the other side of the candles and resets its step. That single touch both stops and reverses, which gives the tool its name.
- SuperTrend ATR base. The SuperTrend takes the Average True Range over ten bars and multiplies it by three. That figure sets the distance of the band from a mid-price anchor.
- SuperTrend flip. The band stays put until a candle closes on the far side of it. Only then does the line jump to the opposite side and change colour, so a closing price drives the switch, not a wick.
- The volatility link. Because the SuperTrend rides on ATR, a calm market pulls the band close while a wild session pushes it wide. The SAR ignores range and keys purely off new extremes.
So the SAR reacts to fresh highs and lows, while the SuperTrend reacts to closing prices and volatility. The concept graphic below lines the two engines up side by side.
Reading the Default Settings
The default numbers carry more weight than they look. A SAR step of 0.02 with a 0.2 cap gives a balanced pace on most pairs and timeframes. Raise the step and the dots chase price harder, which suits fast scalps but triggers more early exits.
The SuperTrend defaults to a 10-period ATR and a multiplier of 3. Lower the multiplier toward 2 and the band tightens, so it flips sooner and trails closer. Raise it toward 4 and the band loosens, so it rides deeper trends and ignores small pullbacks.
One point often trips up newcomers. Neither tool predicts a turn; each one reacts to price that has already moved. So a flip confirms a change rather than forecasting it, and both lag by design.
Why the SuperTrend Waits Longer
The SuperTrend needs a full candle close beyond its band before it switches. That rule filters wicks and single-bar spikes, so it whipsaws less in a choppy range. Because the band also breathes with ATR, a volatile burst rarely trips it on its own.
The Parabolic SAR flips on any touch, wick included. So it reacts sooner and locks in gains faster, yet it also flips more often in sideways drift. Hence the SAR suits a runner who wants a tight leash, while the SuperTrend suits a trader who grants more slack.
The Reverse Signal Nobody Reads
The SAR name promises a reversal, yet few traders use that half. When the dots flip, the tool suggests an exit and an opposite entry in one move. In a clean trend that reversal often works, but in a range it fires straight into the next fake break.
So treat the flip as a stop first and a reversal second. Take the exit signal seriously, then demand a fresh trigger before you flip your bias. Because the reversal fires on every touch, blind trust in it turns a trailing tool into a churn machine.
Fitting Each Tool to a Workflow
Standard settings exist because many traders watch the same numbers. That shared attention gives the defaults real staying power, so start there before you tweak.
Match the tool to the market first. In a clean, trending pair such as a strong EURUSD leg, both tools trail nicely, and the SuperTrend gives fewer false flips. In a tight range, both misfire, so neither belongs on a sideways chart.
Choosing a Timeframe
Timeframe changes the feel of each stop. On a daily chart, a SAR flip marks a meaningful swing, and the SuperTrend rides multi-week runs. On a five-minute chart, both flip far more often, so expect more noise and plan tighter risk.
Because higher timeframes smooth the price, they smooth the tools too. So a swing trader leans on the four-hour and daily flips, while a scalper accepts the faster, messier signals lower down. Pick the timeframe that fits your screen time, then judge the tool there.
Test the pair too, not just the timeframe. A step or multiplier that trails cleanly on EURUSD can flip early on a wilder pair. So run each tool across a stretch of recent bars before you rely on it, and note how often each flip would have helped or hurt.
Pairing the Two With Structure
Neither tool should trade alone. Both read best next to plain price structure, such as a recent swing high or a round number. So map your support and resistance first, then let the stop trail the move.
Many traders also add one confirming filter. A rising moving average, for instance, backs a SuperTrend that sits under price. When trend, structure, and stop all agree, a signal carries more weight than any single dot or line.
Adding a Momentum Read
A momentum tool pairs well with either trailing stop. Where the SAR and SuperTrend follow price, a reading such as the RSI hints at how much fuel the move still has. So the two roles split cleanly, with one tool trailing and the other gauging strength.
Use that split with care, though. A stretched momentum reading warns of a tired trend, yet it never overrides the trailing line on its own. So let the stop keep you in the trade and let momentum simply flag when to tighten it.
Worked Example: A Trend on GBPUSD
Picture GBPUSD grinding higher on the four-hour chart through the London session. Price sits near 1.335, and both tools trail below the rising candles. So the trend context reads clearly bullish from the start.
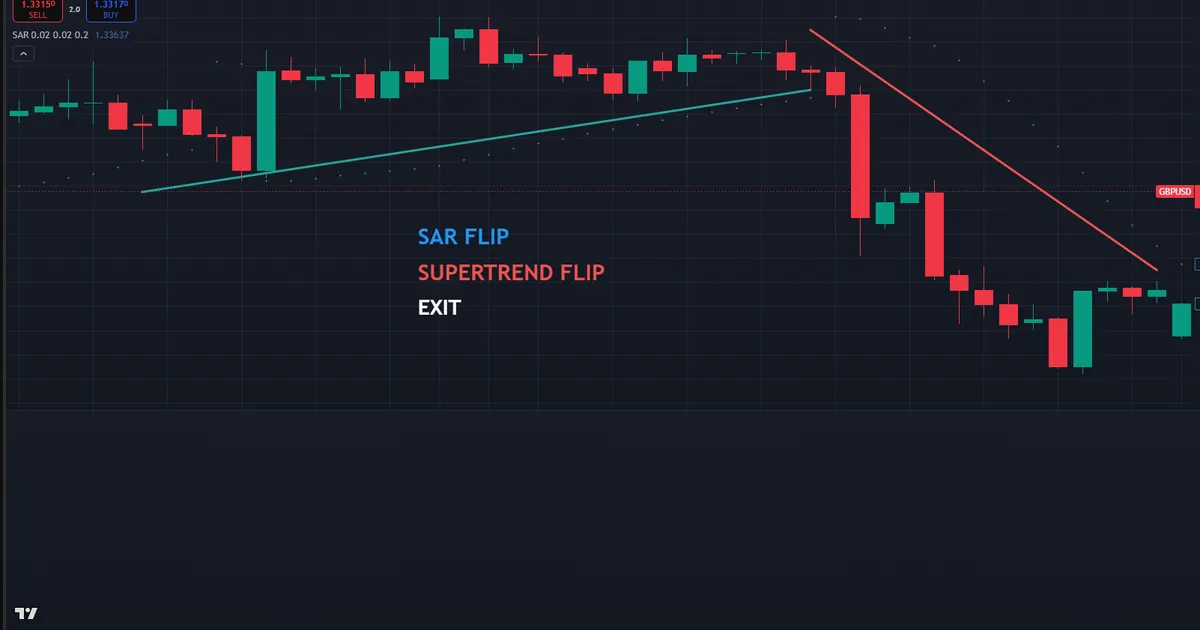
Watch the two stops diverge on the first dip. A shallow pullback taps the Parabolic SAR near 1.338, and the dot flips above price, calling the trend over. The SuperTrend line, still a little lower, holds firm because no candle closed beneath it. The chart below jumps ahead to the reversal that ends the run, where both the SAR dots and the SuperTrend line have flipped above price together to mark the exit.
Now the trade builds itself. A SuperTrend follower stays long, trailing the stop at the band near 1.331 while price pushes on toward 1.347. Because the band never broke on a close, the position keeps running through the noise.
Then compare the two exits. The SAR trader was stopped and reversed on the shallow dip, only to watch price resume higher without them. The SuperTrend trader held the leg and later exited when a four-hour candle finally closed under the band near 1.344. So the wider tool captured more of this particular run.
Notice the honest flip side, though. In a choppier week, the same SAR speed protects gains that the slower SuperTrend gives back. So neither result proves one tool better; each simply fits a different rhythm of market.
Managing Risk on the Entry
A trailing stop handles the exit, not the entry. So you still need a plan for where to get in and how much to risk. Enter on your own trigger, such as a break and retest, rather than on the trailing line itself.
Set the initial stop from structure, then let the tool take over once price runs in your favour. Because the first stop defines the risk, size the position from that distance. That way a wrong read costs a known, small amount rather than an open-ended loss.
Reading the Follow-Through
The trade did not end at the first flip. Price ran on toward 1.347, and the SuperTrend band stepped up behind it the whole way. So the follower kept trailing higher without touching the position through the middle of the leg.
Then the market handed a clean exit. A four-hour candle finally closed under the band, and the line flipped and changed colour. Because the rule waited for that close, the exit came only when the trend truly stalled, not on the earlier scare near 1.338.
Download the complete indicator database
Put these concepts on your charts. One email unlocks the full library of 1,380+ indicators with compiled MT4 and MT5 files, plus my TradingView scripts. No paywall, no spam, unsubscribe any time.
Get free access to my indicator database
One email unlocks 1,380+ free MT4, MT5 and TradingView indicators — the complete library. No single-tool download; you get the whole database.
Common Mistakes and How to Fix Them
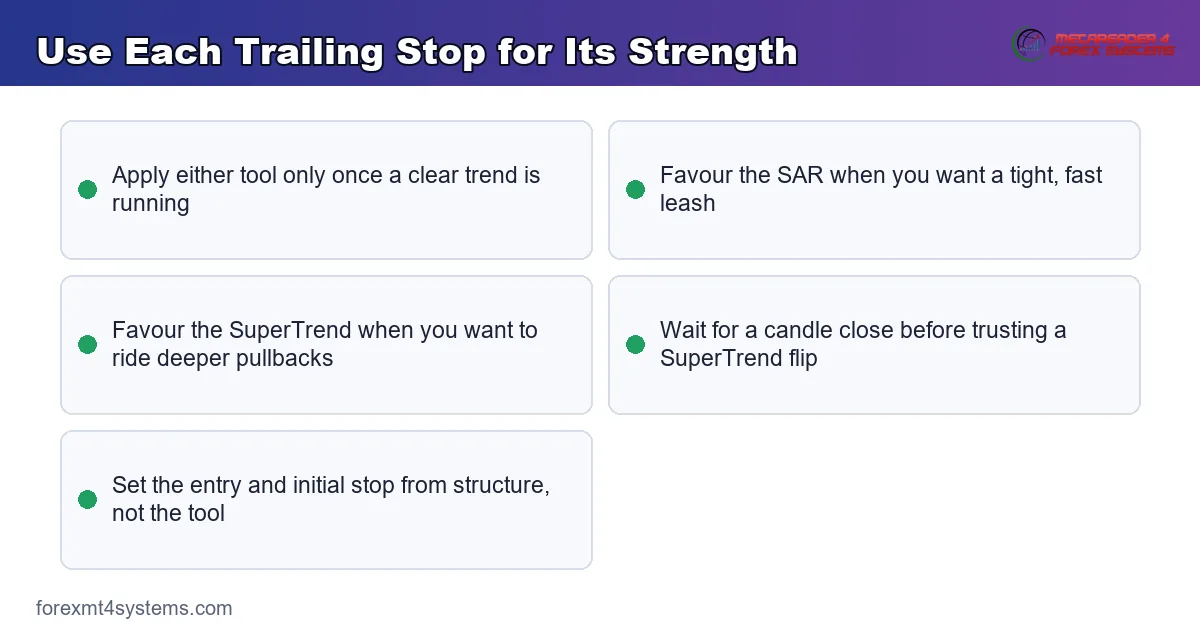
The tools are simple, yet the same errors repeat on every chart. Most trace back to using a trailing stop as an entry signal in the wrong market, and the fixes follow beneath the graphic.
Trading Every SAR Flip in a Range
The Parabolic SAR flips constantly when price drifts sideways. Trading each flip in a range stacks small losses fast. Instead, confirm a trend exists first, then let the SAR trail rather than trigger.
Ignoring the SuperTrend Close Rule
Some traders act the instant a wick pierces the SuperTrend band. That habit fires early and often reverses. So wait for a full candle to close beyond the band before you treat the flip as real.
Using Both Tools as One
Stacking the SAR and the SuperTrend together only helps if each has a job. Reading them as twins doubles the noise. Instead, let one define the trend and the other trail the stop, so they complement rather than repeat.
Cranking the Settings Too Tight
A racing SAR step or a multiplier near 1 flips on the smallest move. That tightness looks safe but strangles good trends early. So loosen the numbers until the stop rides the trend you actually want to hold.
Trusting a Flip Against the Higher Timeframe
A bullish flip on the five-minute means little against a falling daily trend. Truly, the higher timeframe frames every lower signal. So check the daily direction before you trust any intraday reversal.
Pre-Trade Trailing-Stop Checklist
Run this short list before every entry. A few seconds here saves hours of regret later. So slow down, tick each item, and let a failed check keep you out of a marginal trade.
- Higher-timeframe trend read on the daily and four-hour charts.
- A real trend present, not a tight sideways range.
- Tool matched to the market, the SAR for tight leashes and the SuperTrend for slack.
- Settings left near default unless a test on your pair says otherwise.
- Entry trigger and initial stop set from price structure, not from the tool.
- An active session, London or New York, open now.
- Position size worked from the initial stop distance.
When Trailing Stops Fail
Study the failure case as hard as the winner. Here is a common one. GBPUSD chops in a tight range on the fifteen-minute chart, drifting either side of 1.336 with no real direction.
Then the flips pile up. The Parabolic SAR jumps above and below price every few candles, and the SuperTrend switches on each fake break. A trader who acts on every flip bleeds out through spread and small losses. The chart below shows that whipsaw trap.
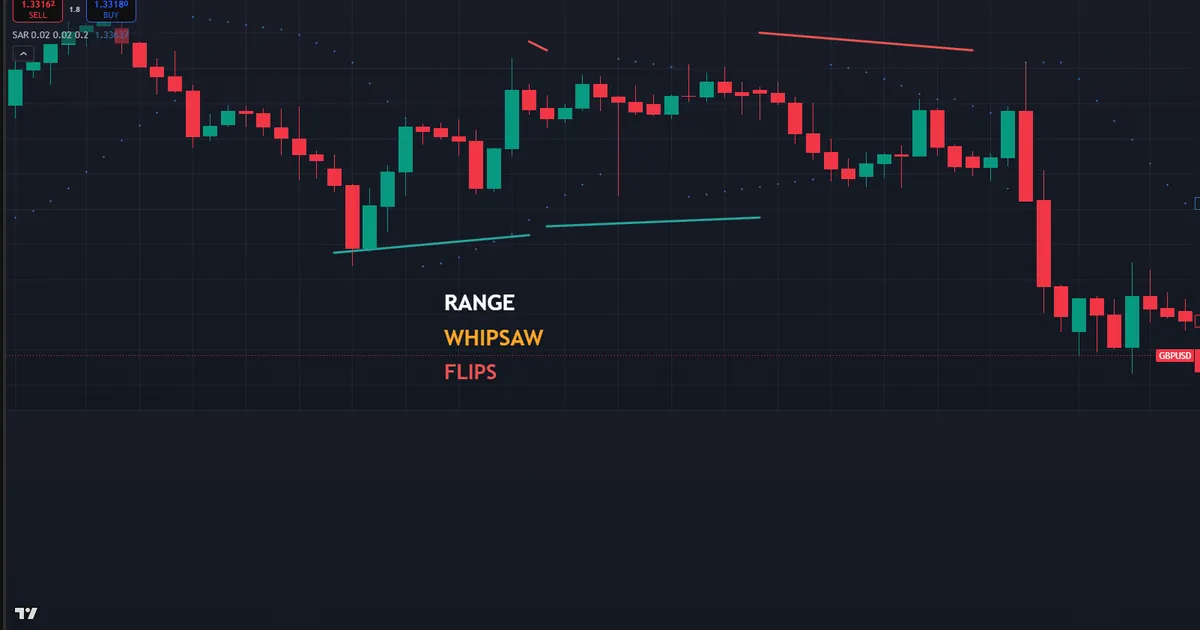
So what went wrong? Both tools assume a trend, and this market had none. In a range, a trailing stop has nothing to trail, so it just reacts to noise. Hence the rule that limits the damage: use these tools only once a trend is clearly in play.
There is a deeper lesson in that trap. A trailing stop answers one narrow question about where price sits relative to its recent path. It knows nothing about the range, the news, or the session. So a flip that looks decisive on the candles can be meaningless in the wider picture.
Then size each trade so a bad read costs little. A sensible stop flows from the structure, and position size flows from that stop, which our free position size calculator works out in seconds. Because the risk stayed small, a wrong flip stung rather than wounded.
Both Tools Lag by Design
Be honest about the lag. Each tool reacts to price that already moved, so it never catches the exact top or bottom. So treat every flip as confirmation, and accept that you will always give back a slice of the move at the turn.
Volatility Shifts Change the Feel
Be honest about changing volatility too. A SuperTrend tuned for a calm month flips wildly when a news week arrives. Because the ATR base grows, the band widens and lags further. So review your settings when the market’s tempo shifts.
News Can Jump the Stop
Be honest about news gaps as well. A sharp release can leap straight past a trailing line, so price never trades at your intended exit. Because both tools react to bars that have already printed, neither shields you from a gap.
So flatten or tighten risk ahead of major data. A calendar check costs a minute and spares you the worst surprises. When the gap does come, accept the fill and move on, since no trailing rule can outrun a jump in price.
Related Concepts to Study Next
These two stops connect to a web of sibling tools, and a few deserve your next reading hour. Start with our guide to what the Parabolic SAR is for the full breakdown of Wilder’s dots. Then read our notes on Parabolic SAR settings to tune the step and cap for your pace.
One more guide rounds out the picture. Because the SuperTrend rides on the Average True Range, learn that engine with our take on how to use ATR in day trading, and you will understand why the band breathes with volatility.
For hands-free charting, the trend indicators archive plots both trailing stops together, while the volatility indicators archive gathers the ATR-based tools that feed the SuperTrend. Tools speed the work, yet the logic above still carries the trade. So learn the rules first, and let any indicator plot what you already understand.
FAQ
Is the SuperTrend better than the Parabolic SAR?
Neither is better in the abstract. The SuperTrend waits for a candle close and flips less in choppy markets, while the SAR flips on any touch and locks gains faster. Match the tool to your appetite for early exits.
What are the default settings for each tool?
The Parabolic SAR uses a step of 0.02 and a cap of 0.2. The SuperTrend uses a 10-period Average True Range with a multiplier of 3. Test any change across many charts before you trust it.
Can I use the SAR and SuperTrend together?
Yes, if each has a job. Let one define the trend and the other trail the stop, rather than reading both as the same signal. When they agree, a flip carries more weight.
Which tool is better for scalping?
Scalpers often prefer the faster Parabolic SAR because it flips sooner and tightens quickly. The trade-off is more noise, so pair it with a trend filter. Reserve the calmer SuperTrend for higher-timeframe context.
Do these tools work in a ranging market?
No, both struggle in a tight range. With no trend to trail, each flips on noise and stacks small losses. Wait for a clear trend before you apply either tool.
Does the SuperTrend repaint or lag?
The SuperTrend confirms its flip only on a closed candle, so the printed history stays fixed once a bar closes. It does lag, though, because it reacts to closes rather than predicting them. So expect a fixed record and a built-in delay at every turn.
Are trailing stops a full trading system?
No, they only handle the exit. You still need an entry trigger, a market filter, and a risk plan. Manage risk on every trade. Results are not guaranteed; past performance is not indicative of future results.
External references
- For background on this concept, see Trailing Stop at BabyPips.
- For broader market context, see Stop-Loss Order at Corporate Finance Institute.

About the author
Written by Dominic Walsh, a Forex trader and MT4/MT5 indicator, Expert Advisor and script developer. Every tool on forexmt4systems.com is tested on live charts before release and ships with ready-to-use compiled MT4 (.ex4) and MT5 (.ex5) files. Learn more about the trader and developer behind this site.
How we build, test and correct every tool: Editorial & Testing Policy. Trading carries risk; see the disclaimer.