
The wolfe wave pattern counts five turning points on a chart, then uses two of them to draw a target line. Its appeal is the tidy geometry, and its weakness is how much of that geometry depends on which swings you choose.
This guide covers the rules as Bill Wolfe set them out, plus the parts most write-ups leave out. Chief among those: the counting rules are loose enough that two careful analysts regularly number the same chart differently.
What the Wolfe Wave Pattern Describes
Picture a market swinging around a fair value it keeps missing. Wolfe waves try to frame that idea with five pivots and two converging lines.
The shape looks like a wedge that leans. Price narrows toward a point, then pokes beyond one boundary and turns hard the other way.
That final poke carries the whole idea. Traders call it the overshoot, and it doubles as the entry signal.
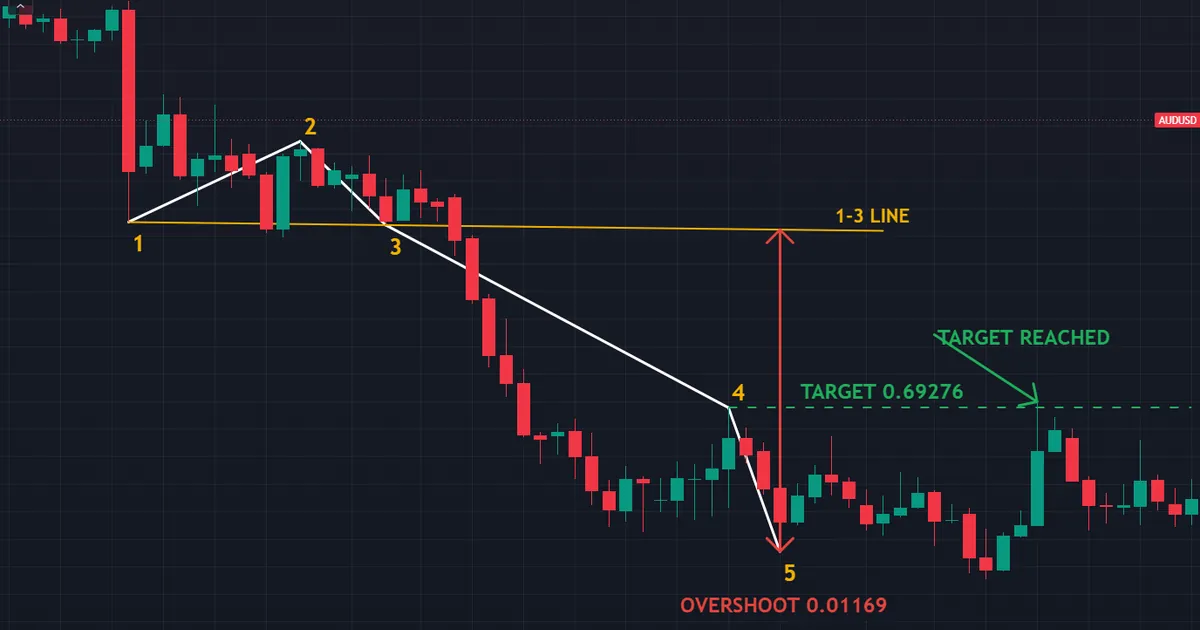
The chart above shows a bullish count on AUDUSD four-hour bars. Point 5 pierced 0.01169 below the 1-3 line, printing a low of 0.68754 before turning up. The 1-4 line then projected a target of 0.69276, which sits above that low.
The Five Points
Number the pivots one through five in the order they form. Odd points sit on one side of the structure and even points on the other.
In a bullish count, points 1, 3 and 5 mark successive lows. Points 2 and 4 mark the highs between them, so the whole thing drifts downward while narrowing.
A bearish count mirrors that exactly. Points 1, 3 and 5 become rising highs, points 2 and 4 become the lows, and the reversal aims downward instead.
The Two Converging Lines
Draw the first line through points 1 and 3, then extend it forward. That line forms the boundary point 5 must break.
Which way it breaks is fixed by the count. A bullish structure sends point 5 below the line and aims the trade upward, and a bearish structure inverts both.
Draw the second through points 2 and 4. The two lines should converge rather than run parallel, which gives the structure its wedge appearance.
Where they eventually meet matters too. Wolfe called that crossing the estimated time of arrival, and it offers a rough deadline for the move rather than a price.
Where the Target Line Comes From
Now connect point 1 to point 4 and extend that line forward. Wolfe named the result the estimated price at arrival, and it serves as the target.
Notice which points it uses. The target ignores point 5 entirely, so your entry level plays no part in the projection at all.
That line slopes, which surprises newer traders. Your target price therefore drifts as time passes, unlike the fixed level a measured move target would give you.
The Rules, Stated Plainly
Wolfe published a short list of conditions. Work through them in order rather than eyeballing the shape.
- Five pivots, alternating. Points 1, 3 and 5 sit on one side; points 2 and 4 sit on the other.
- Point 3 extends beyond point 1. The structure has to make progress in its original direction.
- Waves 3 to 4 stay inside the 1-2 channel. An excursion outside it breaks the count.
- Roughly even spacing in time. Each leg should take a comparable number of bars.
- Point 5 pierces the 1-3 line. A bullish count breaks below it and a bearish count above it, and a touch alone will not do.
- The target runs from point 1 through point 4. Extend it forward and read the price where it crosses, on the far side of point 5.
Rule four does most of the filtering. Because real charts rarely space their swings evenly, a strict reading throws out the majority of candidates you spot.
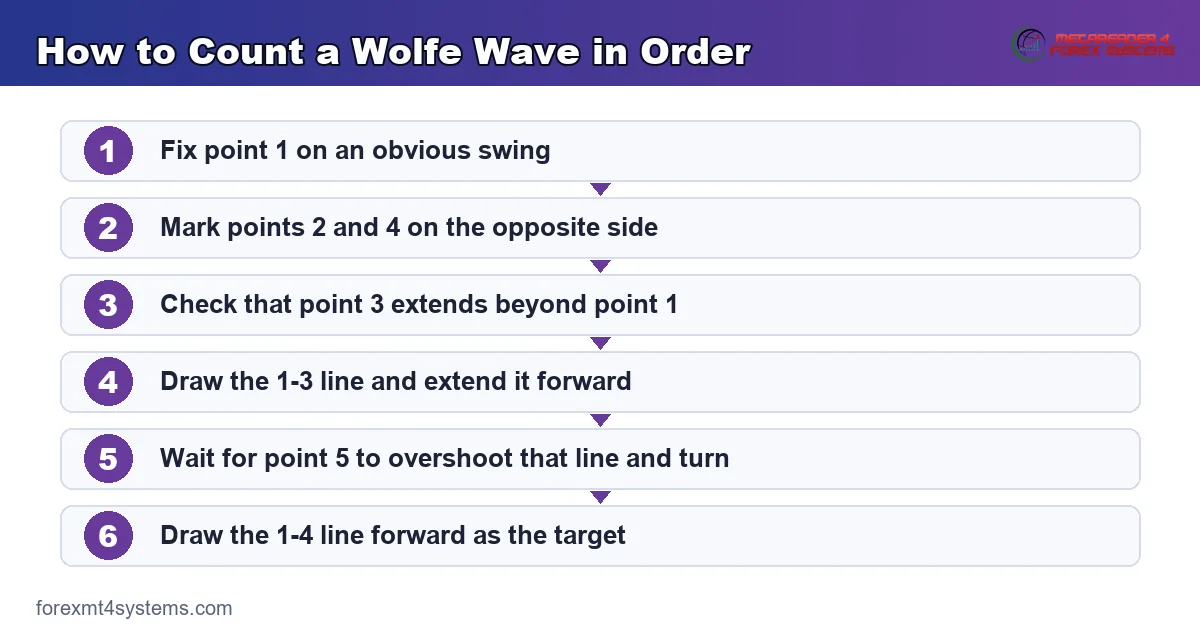
Keep the order fixed. Traders who draw the target line first tend to find a point 5 that suits it.
How to Count One on a Live Chart
Theory reads cleanly, and live charts rarely cooperate. So here is the practical sequence.
Start From a Clear Swing
Pick a pivot that stands out without argument. If you have to squint to see point 1, the count that follows inherits every doubt.
Use one swing setting and apply it everywhere. A fixed rule for what counts as a pivot removes most of the discretion from step one.
Our guide to using trend lines covers the same discipline for the lines themselves. The habits transfer directly.
Check the Symmetry Early
Count the bars in each leg before going further. Legs of eight, nine, seven and forty bars describe something other than a Wolfe wave.
Wide gaps in timing signal a forced count. Abandon it there rather than talking yourself past the rule.
Symmetry in price deserves a look as well. A tiny wave 1-2 beside a huge wave 3-4 stretches the pattern past recognition.
Check That Point 3 Extends
Point 3 has to push beyond point 1 in the original direction. Without that, the structure never made the progress the count assumes.
Traders skip this rule because it looks obvious. It quietly rejects plenty of shapes that otherwise pass every other test.
Check it before drawing anything else. A failed rule two costs you nothing at that stage, and a great deal later.
Wait for the Overshoot
Point 5 has to clear the 1-3 line, not merely reach it. On the AUDUSD example the break ran to 0.01169 below the line, roughly 117 pips.
Decide beforehand how you measure that. Some traders demand a closing break, while others accept a wick, and the two choices produce very different trade counts.
The turn arrived on the point 5 bar itself there. It closed at 0.68862, well above its own low, and the 1-4 line was reached fifteen bars after that.
Decide What Counts as a Break
Write the definition down before you scan anything. A wick break and a closing break produce different point 5 locations on the same chart.
Wick rules trigger far more often. They also catch every spike that fades within the hour, so the extra signals arrive with extra noise attached.
Closing rules trigger later and less often. You give up the best few pips of the reversal in exchange for a count that fewer people can argue with.
What the Wolfe Wave Claims About Markets
A pattern is only as good as the idea behind it. So it is worth asking what this one actually asserts.
The Equilibrium Idea
Wolfe described markets as constantly seeking a fair price they overshoot in both directions. The five points supposedly trace one full cycle of that overshoot and correction.
Under that reading, the 1-4 line stands in for fair value. Price wandered away from it through the wedge, and the reversal from point 5 is the journey back.
The story is elegant, though nothing tests it. Elegance and evidence are separate things, and this pattern has far more of the first.
What It Shares With Older Shapes
Strip away the numbering and familiar pieces appear. A converging wedge, a trendline break, and a channel projection for the target.
Each of those components predates Wolfe by decades. His contribution was assembling them into one named routine with a fixed entry and a fixed projection.
That matters for expectations. If you already trade wedge breaks, this pattern adds structure and a target rule rather than a new market insight.
What the Evidence Actually Shows
Very little, and the reason is structural. Any test needs a rule for picking pivots, and every rule you choose produces a different set of patterns.
Published work on classical chart shapes has produced modest and inconsistent results. Wolfe waves sit outside even that literature, so no comparable figures exist for them.
Treat the pattern as a framework instead. It supplies an entry, an invalidation level and a projection, which is enough to build a repeatable routine around.
A Worked Bearish Example
The bearish version reverses everything and changes nothing else. So walk through one on a far slower chart.

Reading the Mirror
The chart above shows a bearish count on AUDJPY weekly bars, running from November 2023. Points 1, 3 and 5 rise while points 2 and 4 form the lows beneath them.
Point 5 pierced 5.564 above the 1-3 line, printing a high of 104.956. That week then closed at 101.116, so the turn happened inside the point 5 bar itself.
Extending the 1-4 line forward put the target at 96.899, below point 5 rather than above it. Price reached that level thirteen weeks later.
Three Ways Traders Enter
The first way sells the moment price crosses back inside the 1-3 line. It catches every turn, and it accepts a wider stop in exchange.
The second waits for a closing bar in the new direction. Fewer trades reach that filter, and the ones that do carry a clearer invalidation level.
The third splits the order across both. Half on the cross, half on the close, with a single stop beyond point 5 covering the whole position.
Placing the Stop
The stop belongs beyond point 5. Nothing else in the structure marks the level where the read stops making sense.
Add a buffer for noise. A stop resting exactly at the extreme sits in the busiest area of the whole chart.
Size the position from that distance rather than from habit. Our position size calculator handles the arithmetic once you fix the risk you accept.
Managing Toward a Sloping Target
A sloping target creates an awkward problem. Wait a week and the line has moved, so the price you were aiming at no longer exists.
Two habits solve it. Either take the level the line showed on the day you entered, or refresh it once per session and accept the drift.
Write your choice into the plan. Deciding mid-trade means you pick whichever version flatters the position.
Where the Costs Land
That weekly count left roughly 800 pips between point 5 and 96.899. Spread and slippage barely register against a distance like that.
Faster charts squeeze the same arithmetic hard. On the AUDUSD example the target sat about 52 pips above point 5, so a few pips of cost claimed a real slice of it.
Count the cost before the trade, not after. If spread plus slippage eats a tenth of the move, the count needs to be very good indeed.
Download the complete indicator database
Put these concepts on your charts. One email unlocks the full library of 1,380+ indicators with compiled MT4 and MT5 files, plus my TradingView scripts. No paywall, no spam, unsubscribe any time.
Get free access to my indicator database
One email unlocks 1,380+ free MT4, MT5 and TradingView indicators — the complete library. No single-tool download; you get the whole database.
Common Wolfe Wave Mistakes and the Fixes
Most trouble here comes from the counting rather than the trading. The panel below lists why the same chart yields different counts, and nearly every mistake traces back to one of those reasons.

Finding the Pattern After the Fact
Scrolling back until a valid count appears proves nothing. Mark candidates in real time, log them, and judge the method on that record instead.
Hindsight counts always look better than live ones. Every chart contains a shape that fits once you know which way price went next.
Ignoring the Timing Rule
Traders drop rule four first because it disqualifies so much. Keep it, count the bars in each leg, and let the strict version shrink your sample.
A smaller sample beats a corrupted one. Twenty counts you can defend teach you more than two hundred you bent to fit.
Treating the Target Line as Fixed
The 1-4 line slopes, so its price changes daily. Note the level you are trading and the date you read it, then refresh on a schedule rather than on impulse.
Screenshot the chart at entry. Later you can check whether the line you aimed at matches the line you actually drew.
Entering Before Point 5 Completes
A poke through the 1-3 line only becomes point 5 once price turns. Anticipating that turn puts you in a falling market with no defined stop.
Patience costs a few pips at most. Jumping early costs the whole structure of the trade, since the invalidation level has not formed yet.
Skipping the Higher Timeframe
A four-hour count inside a strong weekly trend fights the larger flow. Check the bigger chart first, or trade smaller when the two disagree.
Counter-trend reversals need everything to go right. Aligning with the larger direction removes one obstacle for free.
Believing the Precision
Five points and two lines look scientific. The inputs remain discretionary, so treat the output as an estimate rather than a measurement.
Ask yourself a blunt question before entering. Would another trader, given your pivot rule and nothing else, arrive at this same count?
Wolfe Wave Quick Reference
Keep this table beside the chart while the count becomes familiar. Each row states a condition rather than an outcome.
| Element | What to check | Common practice |
|---|---|---|
| Point 1 | An obvious swing, not a debatable one | Chosen by a fixed pivot rule |
| Points 2 and 4 | Opposite side, forming the second line | Line 2-4 converges with line 1-3 |
| Point 3 | Extends beyond point 1 | Confirms the structure still progresses |
| Timing | Comparable bar counts per leg | The rule most often quietly dropped |
| Point 5 | Pierces the 1-3 line, then turns | Close or wick, decided in advance |
| Entry | At or just after point 5 | Stop beyond point 5 plus a buffer |
| Target | The 1-4 line extended forward | Level noted with its date, refreshed on a schedule |
Notice what the table leaves out. No column offers a success figure, because no independent testing of this pattern exists in any form worth quoting.
Evidence for wolfe waves stays anecdotal. Supporters point to selected charts, critics point to the discretion in the count, and neither side has data that settles it.
When the Wolfe Wave Fails
Point 5 formed correctly but price never reached the target line. That describes the most common disappointment with this pattern, and it looks nothing like a normal stop-out.

A Clean Count That Went Nowhere
The chart above shows a bullish count on AUDJPY four-hour bars from early June 2026. Point 5 pierced 1.17247 below the 1-3 line at 112.561, and the 1-4 line projected a target of 114.253 above it.
Price turned up from point 5 exactly as the count asks. Over the weeks that followed, the best it managed was 113.548, a little past half the distance to the line.
So the count produced a level and nothing else. A stop resting below point 5 came into play about ten bars after the turn.
The Sloping Line Moved Away
Remember which direction the 1-4 line ran. It rose as the sessions passed, so the level the count demanded climbed further above price the longer the trade sat there.
That cuts both ways on any count. A line sloping toward price shortens the journey, and a line sloping away lengthens it while you wait.
Read the level and the date together. Aiming at last week’s number on this week’s chart quietly changes the trade you thought you took.
The Timing Rule Did Not Flag It
Count the bars in each leg here. They ran roughly six, nine, three and eight, which is about as even as live charts get.
Rule four therefore passed. Both counts that did reach their targets spaced their legs less evenly than this failed one did.
Keep checking the spacing regardless. It removes plenty of forced shapes, and it plainly cannot remove all of them.
The Break Size Was Not the Problem
Compare the breaks across the three examples. AUDUSD pierced its line by 0.01169, AUDJPY weekly by 5.564, and this failed count by 1.17247.
Against its own chart that last break was substantial. So break size did not separate the counts that worked from the one that did not.
Express every break against recent volatility anyway. A break worth a fraction of the average bar range says almost nothing about who is in control.
The Count Changed With Hindsight
Any structure invites revision. Wait long enough and a new swing appears that makes a different point 3 look better, which moves the target line with it.
Lock the count when you take the trade. Screenshot it, note the levels, and refuse to renumber a position you already hold.
The Pattern Ran Into Something Bigger
Geometry loses to context. A rate decision, an intervention or a broad risk unwind erases any five-point count on the chart underneath it.
Our guide to chart pattern failure covers how to respond when structure stops mattering. The short version: cut, log it, and wait for the noise to clear.
Related Structures to Study Next
Wedges share most of the geometry. Our guide to the wedge pattern covers converging boundaries without the five-point count or the sloping target.
Harmonic shapes chase the same precision through ratios instead. Our Gartley pattern guide and our list of harmonic patterns cover that family, which carries the same discretionary weakness.
Trend tools give a useful cross-check. Our trend indicators archive collects the ones that tell you whether a count fights the larger direction.
Automated detection deserves a warning. Software finds counts faster than you can, and it also finds many more, because loose rules produce plenty of shapes on any chart. Our harmonic indicators archive collects the scanners that mark these structures on MT4 and MT5.
Projection methods are worth comparing side by side. A fixed measured move and a sloping 1-4 line answer the same question in different ways, and running both on one chart shows you how far apart they can land.
One habit outranks the geometry. Logging every count you take, including the ones you skip, builds the only evidence base that applies to your instruments and your timeframe.
Start that log before you start trading the pattern. Thirty marked candidates cost nothing, and they tell you whether your pivot rule produces counts you can actually defend.
FAQ
What is the wolfe wave pattern?
It is a five-point chart structure where points 1, 3 and 5 sit on one side and points 2 and 4 on the other. Point 5 overshoots the line drawn through points 1 and 3, and the line from point 1 through point 4 serves as the target.
How do I draw the target line?
Connect point 1 to point 4 and extend that line forward. Wolfe called it the estimated price at arrival, and note that it slopes, so the target price shifts as time passes.
Where does the stop go?
Beyond point 5, with a buffer for noise. That extreme marks the level where the count stops making sense, so a stop sitting inside it gets taken out by ordinary movement.
Is the wolfe wave reliable?
No independent testing worth quoting exists, and the evidence remains anecdotal. The counting rules leave enough room for judgement that two analysts can number the same chart differently and both defend their version.
What invalidates a wolfe wave?
A close beyond point 5 in the original direction ends the read. So does a leg that breaks the channel rule or a timing gap wide enough to fail rule four, and both are worth checking before you commit anything.
Which timeframe suits it best?
Traders apply it from intraday charts up to weekly ones. Slower charts give cleaner pivots and fewer candidates, while faster charts give more counts and let costs claim a larger share of each move.
How does it differ from a harmonic pattern?
Harmonic shapes lean on Fibonacci ratios between legs, while wolfe waves lean on trendline geometry and timing symmetry. Both rely on discretionary pivot selection, so both reward a written rule for what counts as a swing. Keep a record of every count you trade, size each position so a stall costs little, and treat the target line as an estimate. Results are not guaranteed; past performance is not indicative of future results.
External references
- For background on this concept, see Bump and Run Reversal at StockCharts ChartSchool.
- For broader market context, see Channel at Investopedia.

About the author
Written by Dominic Walsh, a Forex trader and MT4/MT5 indicator, Expert Advisor and script developer. Every tool on forexmt4systems.com is tested on live charts before release and ships with ready-to-use compiled MT4 (.ex4) and MT5 (.ex5) files. Learn more about the trader and developer behind this site.
How we build, test and correct every tool: Editorial & Testing Policy. Trading carries risk; see the disclaimer.