
A list of harmonic patterns is really a list of Fibonacci ratios. Every shape uses the same five points, X, A, B, C and D, and the ratios between the legs decide which name a swing earns.
This guide covers that list of harmonic patterns without selling it. You get the framework, the defining numbers, and an honest account of where the whole approach turns soft.
What the XABCD Framework Actually Is
Start with five turning points on a chart. Label the first swing X to A, then the pullback A to B, then B to C, and finally C to D.
Each leg then gets compared with another leg. So the framework never asks what price will do next; it asks whether the swings already on screen sit at particular Fibonacci proportions.
Below you can see a bullish Gartley on USDCAD, drawn on the hourly chart across 23 and 24 July 2026. Point D landed at 1.40664, and the AD leg measured 0.781 of XA.
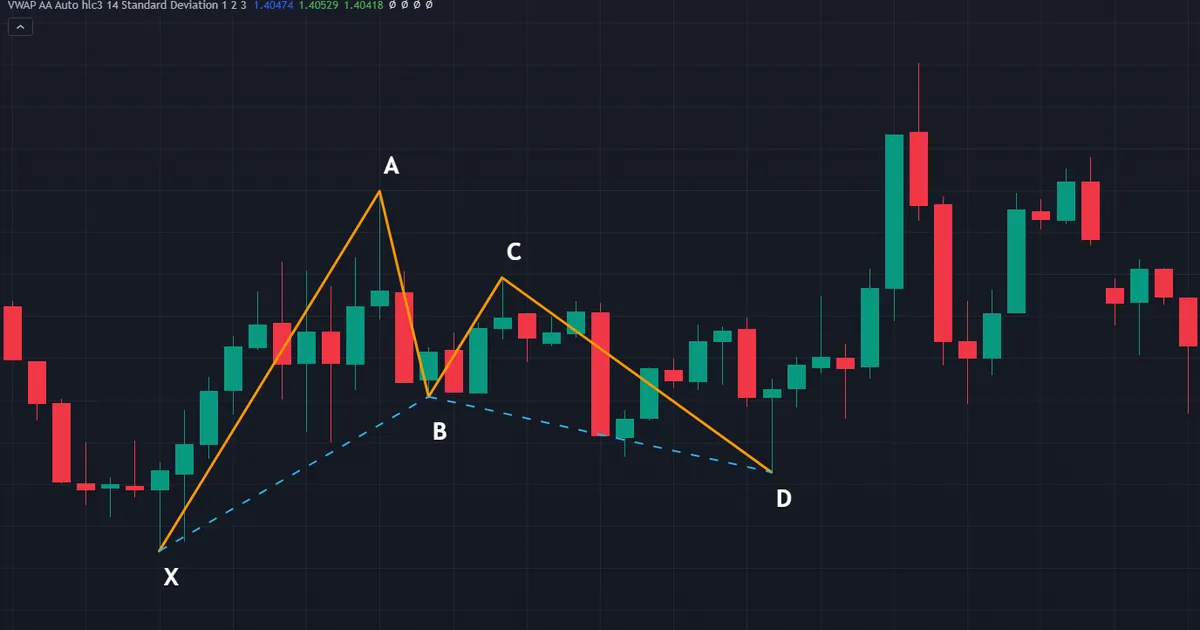
Notice how that figure sits close to 0.786 rather than exactly on it. Real swings rarely print the textbook number, which is why every practitioner works with a tolerance band instead.
The Five Points in Order
X marks the start of the move you care about. A ends that first leg, and the distance between them becomes the yardstick for everything after.
B sits inside the XA leg as a retracement. C then partly reverses AB, and D completes the shape at a level the earlier ratios define in advance.
So the last point matters most. D is the only place a harmonic trader acts, because it is the only point the earlier legs can locate before price gets there.
Bullish and Bearish Versions
Every shape in the family comes in two directions. A bullish version puts X at a high and D at a low, so the trader looks to buy into the zone.
Flip the whole drawing for the bearish version. X then sits at a low, D forms at a high, and the plan turns into a sell at the zone.
Nothing else changes. The ratios, the tolerance bands and the invalidation rule all carry over untouched, which keeps the framework compact.
Why Fibonacci Numbers At All
The ratios come from a number series where each term adds the two before it. Dividing neighbouring terms gives 0.618, and other pairings give 0.382, 0.786 and 1.618.
Traders adopted those figures long before harmonic patterns had names. Whether markets respect them for a mathematical reason, or simply because enough people watch the same lines, remains an open question.
Either way, the honest framing helps. Treat the ratios as a shared convention that clusters orders, rather than a law the market obeys.
What a Harmonic Actually Gives You
The framework hands you three things: a zone, an entry and an invalidation. That much is genuinely useful, and it is also the full extent of the claim.
A harmonic does not call direction with any authority. It marks where a retracement would end if the shape holds, and where the idea dies if it does not.
Compare that with a bare level on the chart. Both give you a zone; the harmonic simply arrives at one through arithmetic rather than through memory of past trade.
How to Read Any Harmonic, Step by Step
The same six steps work for every member of the family. Only the target ratios change from one name to the next.
- Find a clean XA leg. Pick a swing that stands out without squinting at the chart.
- Measure AB against XA. That retracement already narrows the list of possible names.
- Check the BC leg. It should retrace part of AB, usually between 0.382 and 0.886.
- Project the CD leg. Extend BC forward and see where the two projections overlap.
- Mark the D zone. Draw a band, not a line, because tolerances differ between traders.
- Set the invalidation first. Decide where the idea fails before you decide where you enter.
Step two carries most of the sorting work. A shallow B points toward one branch of the family, while a deeper B points toward another.
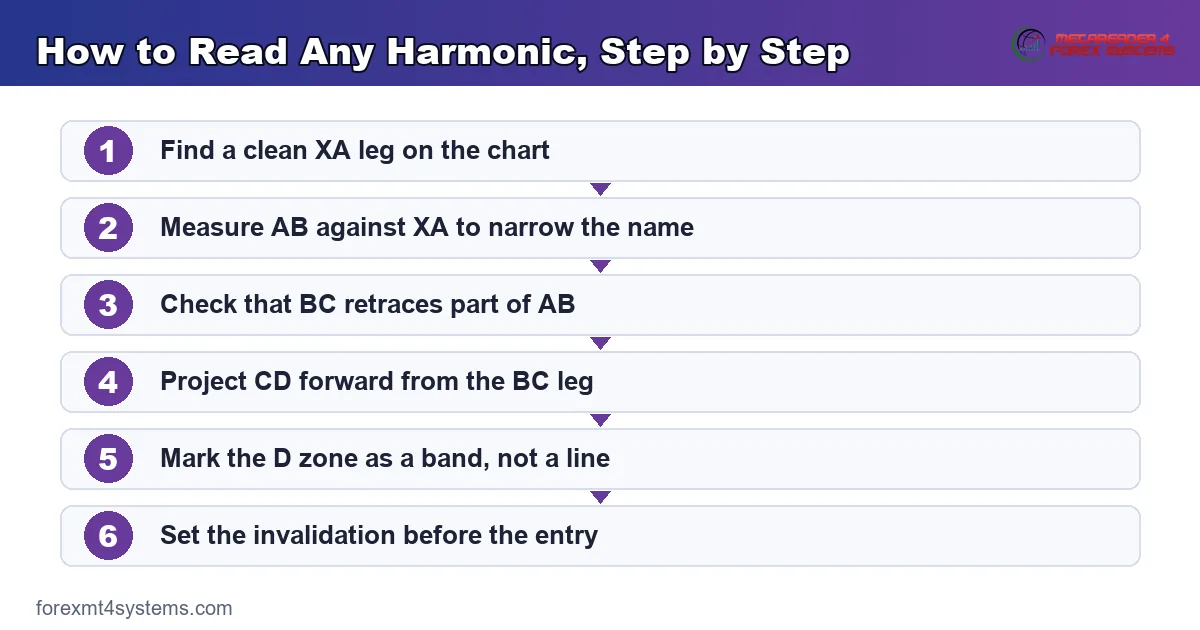
Keep the order fixed every time. Traders who project D first tend to bend the earlier legs until the answer they wanted appears.
A Working List of Harmonic Patterns
Four names cover most of what you will meet on a chart. Each one is defined by where B sits and where D finishes.
The Gartley
B retraces about 0.618 of XA, and D completes near 0.786 of XA. Point D therefore stays inside the original XA leg, so X remains untouched.
That containment matters for the stop. Because D sits short of X, the invalidation level is close and easy to define.
Our full walkthrough of the Gartley pattern covers the entry mechanics in detail.
The Bat
Here B retraces less, roughly 0.382 to 0.5 of XA. D then completes near 0.886 of XA, deeper than a Gartley yet still short of X.
Two numbers separate the bat from its cousin, and our note on bat and Gartley differences takes them apart.
The Butterfly
B retraces about 0.786 of XA, which is unusually deep. D then extends beyond X, typically near 1.27 to 1.618 of XA.
So the butterfly asks you to buy or sell at a fresh extreme. Our page on the butterfly harmonic explains why that changes the risk picture.
The Crab
The crab pushes further still, with D near 1.618 of XA. It shares the butterfly logic and simply stretches the final leg.
Beyond these four sit the shark, the cypher, the deep crab and a long tail of variants. New names keep appearing, and most differ only by a tolerance decimal.
The AB Equals CD Core
Underneath every name sits a simpler four-point shape. Traders call it the AB=CD, and it asks that the CD leg roughly matches the AB leg in size.
Add an X point in front of it and you have a harmonic. So the family is really one core structure with a Fibonacci filter bolted on the front.
Learn the four-point version first. Once your eye finds AB and CD legs quickly, the five-point names take an afternoon rather than a month.
Why the Names Keep Multiplying
Each variant claims a slightly different tolerance window. A shark uses a deeper C, a cypher shifts the B rules, and a deep crab pushes D further than a crab.
Marketing does the rest. New names travel well on social media, though a fresh label adds nothing unless it changes what you actually do at the zone.
So resist the collector instinct. Four shapes cover the ground, and a fifth mostly adds bookkeeping.
A Worked Example on the Daily Chart
Numbers make the framework concrete. Take the bullish butterfly that formed on EURUSD between 8 October and 4 November 2025.
Reading the Legs
The AB leg measured 0.812 of XA, close to the 0.786 the textbook expects. BC came in at 0.606 of AB, and CD extended 2.181 of BC.
Point D printed at 1.14686, with C above it at 1.16688. The AD leg finished at 1.394 of XA, comfortably inside the 1.27 to 1.618 band.

Every one of those figures misses the ideal by a little. That is normal, and it is also exactly why two analysts can label the same swing differently.
Turning the Zone Into a Trade
The D zone gives you a price band. Your stop goes beyond the far edge of that band, and your first reference target sits back at C.
Size the position from the stop distance, never from conviction. Our Fibonacci calculator speeds up the ratio work so you can spend the time on risk instead.
Then write the invalidation on the ticket. A harmonic without a written stop is just a drawing.
Where the Stop Belongs
For a Gartley or a bat, the stop goes just past X. Price reaching X means the AD leg no longer fits the ratio the name depends on.
A butterfly or crab needs different handling. Since D already sits beyond X, the stop has to clear the extension band instead.
Either way, place the stop first and let it set your size. Reversing that order is how a small idea turns into an oversized position.
Download the complete indicator database
Put these concepts on your charts. One email unlocks the full library of 1,380+ indicators with compiled MT4 and MT5 files, plus my TradingView scripts. No paywall, no spam, unsubscribe any time.
Get free access to my indicator database
One email unlocks 1,380+ free MT4, MT5 and TradingView indicators — the complete library. No single-tool download; you get the whole database.
Where the Harmonic Case Gets Weak
This section is the one most harmonic articles skip. It deserves the space.
Tolerances Are Not Standard
One trader accepts a B retracement between 0.55 and 0.68. Another insists on 0.618 with three percent of room, and a third uses a fixed pip window.
So the same swing can be a Gartley, a bat or nothing at all. That flexibility makes the framework hard to test and easy to fit after the fact.
The Evidence Base Is Thin
No solid published body of work shows that harmonic ratios beat plain support and resistance reading. Studies of classical chart patterns generally report modest and inconsistent results once costs enter the picture.
That does not make the framework useless. It does mean you should treat any confident claim about how often these shapes deliver with real suspicion.
Small Samples Flatter Everything
A dozen screenshots prove very little. Any framework looks convincing when the examples come from someone who chose them afterwards.
Keep your own count instead. Log every zone you marked, including the ones you skipped, and the picture usually turns more sober within a month.
Hindsight Does the Heavy Lifting
Completed harmonics look obvious in a screenshot. Live, you are choosing between three candidate X points and two possible C highs while the bar is still moving.
Our guide on whether Fibonacci retracement works covers the same selection problem from the other direction.
The Honest Summary
Harmonics give structure to a guess. They turn a vague feeling that price has fallen far enough into a defined band with a defined exit.
That structure has genuine value for planning and for sizing. It does not amount to evidence that the ratios themselves predict anything, and nobody should sell it as though it does.
So use them as a drawing discipline. Judge each zone by where it lands and by what the wider chart says, then let the stop do its job when the read turns out wrong.
Harmonics Versus Plain Level Reading
Comparing the two approaches side by side settles a lot of arguments. Both end up drawing a box on the chart.
What the Harmonic Adds
Arithmetic gives you a zone before price arrives. That head start is real, and it lets you place resting orders instead of chasing a candle.
The framework also enforces discipline. Since the ratios fix the invalidation, you cannot quietly widen the stop once the trade goes against you.
What Plain Levels Add
A level earns its status from behaviour. Price stalled there, reversed there, or gapped through it, and that history exists whatever the ratios say.
Levels also survive redrawing. Move your swing points a little and the Fibonacci zone shifts, while an old high stays exactly where it was.
Using Both Together
The strongest reading comes when the two agree. A D zone landing on a level that already turned price twice deserves more attention than one floating in clear air.
Disagreement is informative too. When your ratios point at empty space, the honest move is to skip the trade rather than trust the maths alone.
Common Mistakes With Harmonic Patterns
Most harmonic losses trace back to a short list of habits. The comparison panel below sorts the family by where point D finishes.

Trading D Without an Invalidation
The zone is a place to act, not a reason to hold forever. Fix the stop beyond the far edge before the entry goes in.
Forcing the Ratios
Dragging X two bars left until the numbers fit is fitting, not analysis. If the legs need help, the pattern is not there.
Ignoring Where the Zone Lands
A D zone floating in empty space carries little weight. The same zone sitting on an old level, a session low or a round number carries rather more.
Using One Timeframe Only
A neat hourly harmonic against a firm weekly trend fights the larger flow. Check the higher chart first, or cut your size when the two disagree.
Treating C as a Promise
The move back toward C is a projection. Price often stalls well short of it, so plan partial exits rather than holding for the full distance by default.
Chasing Rare Variants
Exotic names multiply faster than evidence for them. Learn the four core shapes properly before adding a fifth.
Averaging Down Inside the Zone
Adding to a losing harmonic feels rational because the zone has width. Yet a band exists to be respected, not to be filled repeatedly while price walks through it.
Skipping the Session Check
A D zone reached during thin Asian hours behaves differently from one reached at the London open. Note which session produced the touch, then adjust what you expect from it.
Harmonic Pattern Quick Reference
Keep this table beside the chart while the ratios settle in your memory. Each row states a condition, not an outcome.
| Pattern | B retracement of XA | D completion | Where D sits |
|---|---|---|---|
| Gartley | About 0.618 | About 0.786 of XA | Inside X |
| Bat | About 0.382 to 0.5 | About 0.886 of XA | Inside X, deeper |
| Butterfly | About 0.786 | About 1.27 to 1.618 of XA | Beyond X |
| Crab | About 0.382 to 0.618 | About 1.618 of XA | Well beyond X |
Notice what the table leaves out. Nothing here suggests how often any shape follows through, because that figure shifts with the market, the period and the tolerance you apply.
When the D Zone Turns but the Target Never Arrives
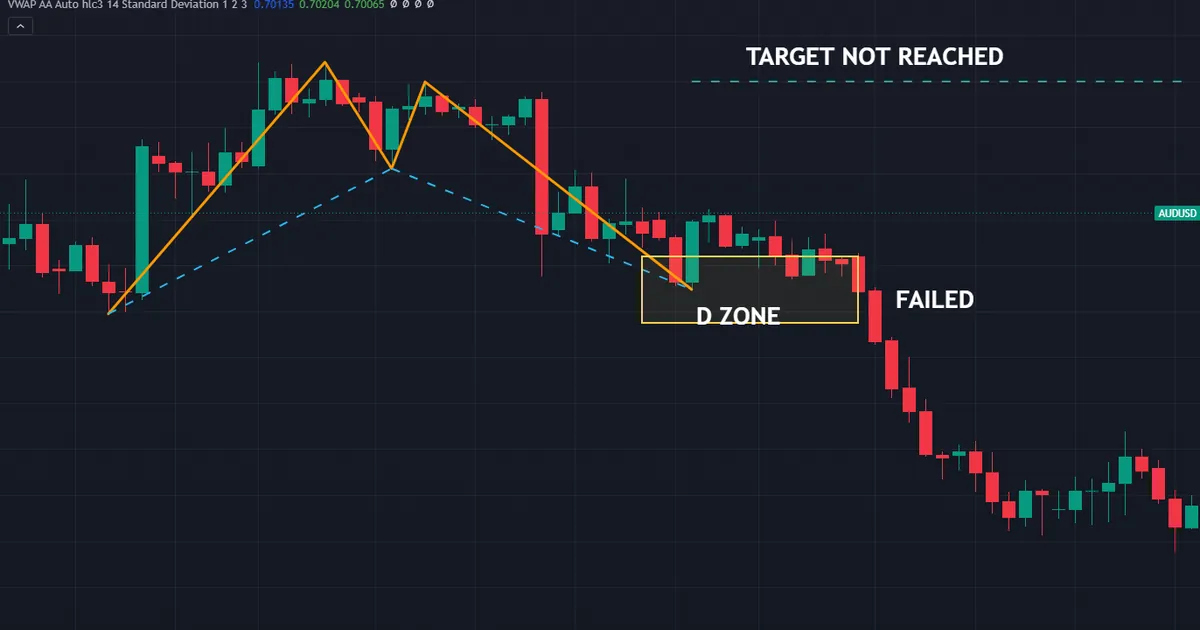
Failure teaches faster than success. The chart below shows a bullish bat on AUDUSD across four-hour bars between 11 and 19 June 2026, and the trade never paid.
What the Legs Looked Like
AB retraced 0.423 of XA, sitting neatly inside the shallow band a bat wants. AD finished at 0.903, a shade deeper than the 0.886 the textbook names.
Point D printed at 0.69895 with C above at 0.70798. On paper the shape qualified, and the ratios were as clean as most live examples get.
The Bounce That Stalled
Price did turn at the zone. Buyers lifted it to 0.70244 inside two bars, so the entry was never far offside.
Then the move died. That high sat roughly 55 pips under the C target at 0.70798, and the next ten bars drifted sideways instead of extending.
Note what this failure is not. Nothing cut through the zone on arrival; it held, produced a reaction, and the reaction simply ran out of buyers before the first target.
How the Trade Ended
Price slid back through the zone from 22 June. By the following session it traded under X at 0.69789, which is where the ratio set stops making sense.
So the invalidation did its job. A stop just past X closed the position for a small loss rather than riding the slide that followed.
What the Failure Costs
A clean stop past X keeps the damage small. That is the quiet advantage of the framework, since the invalidation sits close to the entry by construction.
Traders who widen the stop lose that advantage instantly. Once the ratio breaks, the reason for the trade has gone, and holding on becomes hope with a chart attached.
The Lesson to Carry Forward
Treat every D zone as a hypothesis with a price attached. Our archive of support and resistance indicators covers the level tools that help you judge whether a zone has any history behind it.
Then log the outcome either way. A record of your own failed harmonics is worth more than another article about the ratios.
Related Concepts to Study Next
Harmonics sit inside a much larger family of shapes. Our capstone on why chart patterns fail explains the traps that apply to all of them.
Ratios deserve separate study too. Start with our explainer on what Fibonacci retracement is, since every harmonic leans on that one tool.
For scanning, our harmonic indicators archive collects the tools that draw XABCD legs automatically. Automation removes the drawing chore, though it never removes the judgement about which X to use.
A Sensible Order of Study
Begin with levels, since every zone worth trading sits near one. Add trend reading next, because a D zone against a strong trend rarely gets the room it needs.
Only then bring in the ratios. Learning them last keeps the arithmetic in its proper place, which is a refinement rather than a foundation.
Finally, practise on closed charts before risking anything. Replay a month of bars, mark the zones as they form, and note honestly how many you would have found live.
FAQ
What is a harmonic pattern?
It is a five-point price structure, labelled X, A, B, C and D, where the legs sit at defined Fibonacci proportions to one another. The AD ratio against XA is what gives each pattern its name.
How many harmonic patterns are there?
There is no fixed number. Four shapes cover most practical work: the Gartley, the bat, the butterfly and the crab. Variants such as the shark, the cypher and the deep crab keep appearing, and many differ only by a small change in the accepted tolerance.
Which harmonic pattern is the easiest to learn?
The Gartley, because its numbers are the most memorable and point D stays inside the XA leg. That containment keeps the stop close and the invalidation obvious, which makes the whole idea easier to test on your own charts.
Do harmonic patterns actually work?
No solid published evidence shows that harmonic ratios outperform ordinary support and resistance reading. They give you a structured way to define a zone, an entry and a stop, which has real value. Treat any specific claim about how reliably they deliver as unsupported.
Why do two traders label the same swing differently?
Because tolerance bands are not standardised. One trader accepts a B retracement of 0.55 and another rejects anything outside 0.60 to 0.64, so the same three swings produce different names or no name at all.
What timeframe suits harmonic patterns best?
Any timeframe draws them, though the four-hour and daily charts give the swings enough room to stand out. Lower charts produce far more candidates, and most of them dissolve before point D arrives. Pick one chart, learn its rhythm, and resist hunting the same shape across six timeframes at once.
Do I need an indicator to find them?
No, and drawing the first fifty by hand teaches you more than any scanner will. A tool helps once the ratios feel automatic, mainly by saving time rather than by finding better setups. Whatever you use, the choice of X point stays a judgement call.
Where should the stop go on a harmonic trade?
Beyond the far edge of the D zone, at the point where the ratio set no longer holds. For a Gartley or a bat that usually means just past X, while a butterfly or crab needs room past the extension band. Size the position from that distance, then accept that the projection back toward C is a reference and nothing more. Results are not guaranteed; past performance is not indicative of future results.
External references
- For background on this concept, see Fibonacci Sequence at Investopedia.
- For broader market context, see Measured Move (Bullish) at StockCharts ChartSchool.

About the author
Written by Dominic Walsh, a Forex trader and MT4/MT5 indicator, Expert Advisor and script developer. Every tool on forexmt4systems.com is tested on live charts before release and ships with ready-to-use compiled MT4 (.ex4) and MT5 (.ex5) files. Learn more about the trader and developer behind this site.
How we build, test and correct every tool: Editorial & Testing Policy. Trading carries risk; see the disclaimer.