
Traders keep asking one blunt question: does Fibonacci retracement work, or is it just chart decoration wrapped in mystical numbers? The honest answer sits in the middle, and this guide lays out the real evidence without the hype.
So we will separate what the tool actually does from the folklore around it. By the end, you will know why Fibonacci levels sometimes hold, when they fail, and how confluence turns a fuzzy idea into a usable edge.
Does Fibonacci Retracement Work in Practice?
Fibonacci retracement draws horizontal levels across a prior swing, at 23.6%, 38.2%, 50%, 61.8%, and 78.6% of that move. Traders watch those levels for a pullback to stall and the trend to resume. The claim is that price respects these ratios more often than random chance would suggest.
Here is the sober view. No robust academic study shows that Fibonacci ratios beat other round-number levels on their own. So the magic is not in the numbers themselves. Yet many traders still find the tool useful, and that gap deserves a proper explanation.
The chart below shows EURUSD on the four-hour timeframe. A Fibonacci Retracement tool runs from the swing low to the swing high near 1.148, and price pulls back into the 61.8% level before the uptrend resumes.
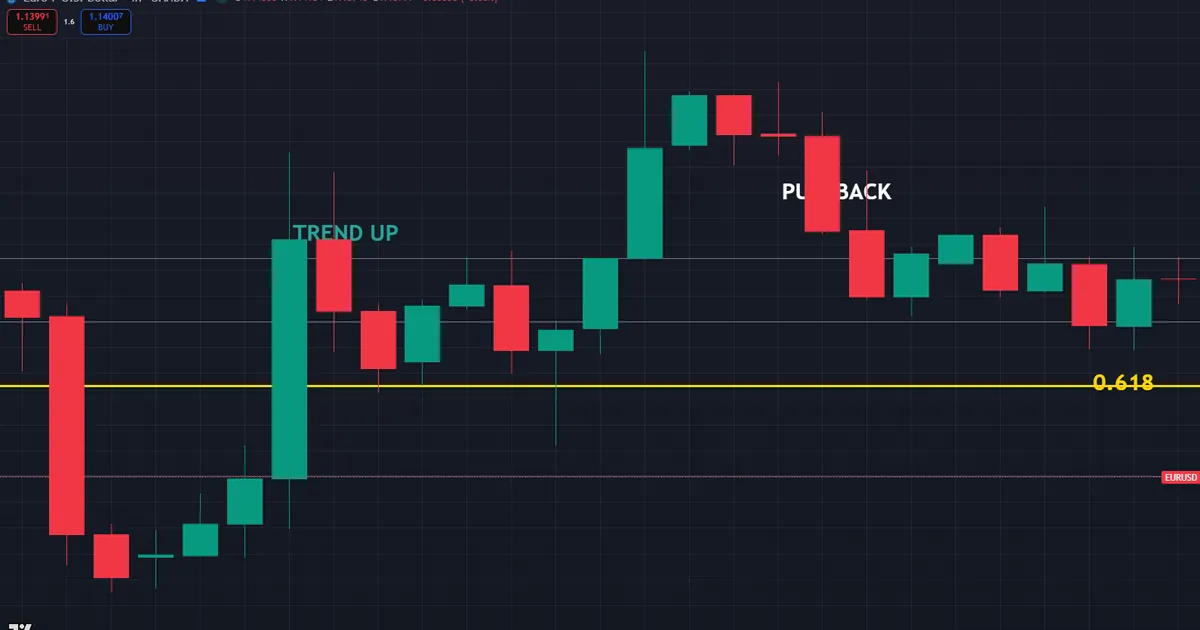
Notice what the picture proves and what it does not. Price did stall near a Fibonacci level here, which looks convincing. So one clean example never settles the question, because you can always find charts where the level failed just as cleanly.
The Self-Fulfilling Effect
Part of the answer is crowd behavior. Thousands of traders draw the same levels from the same obvious swings. When many eyes watch 61.8%, orders cluster there, and that clustering can nudge price to react.
So the level partly works because people expect it to work. This self-fulfilling effect is real, but it has limits. Because different traders anchor their swings differently, the crowd rarely agrees on one exact price, and the reaction blurs into a zone rather than a line.
The Evidence Debate
Academic tests of Fibonacci levels are mixed at best. Several studies find no statistically significant edge once you account for trading costs and the sheer number of levels on the chart. So with five lines drawn across a swing, price will touch one of them by chance alone.
Yet the debate has another side. Because so many traders and algorithms reference these levels, their behavior feeds back into price. So the honest position is that the ratios hold no inherent power, while the crowd that watches them can create short bursts of real, tradable pressure.
This distinction changes how you should use the tool. Do not expect the numbers to predict anything on their own. Instead, treat them as a shared map that many participants read at the same time, and trade the reaction rather than the ratio.
What the Ratios Actually Are
The core ratios come from the Fibonacci sequence, where each number sums the two before it. Divide one number by the next and you approach 0.618, the famous golden ratio. The 38.2% and 23.6% levels come from related divisions in the same sequence.
These ratios appear in some natural patterns, which fuels the mystique. So markets are not seashells or sunflowers. The link between a botanical ratio and a currency pair is an analogy, not a mechanism, and honest analysis keeps that distinction clear.
How the Ratios Reached the Charts
Fibonacci numbers entered trading through Ralph Nelson Elliott and later chartists. Elliott noticed that his wave counts often related by these ratios, and the Gartley harmonic patterns leaned on them too. So the tool arrived on price charts by tradition and pattern study, not by rigorous proof.
That heritage explains the loyalty. Because respected analysts built whole methods around the ratios, generations of traders inherited the levels as gospel. So the numbers carry cultural weight in the trading world, and that weight is itself part of why they occasionally matter.
How the Tool Is Built and Read
Learn the mechanics once, then judge the tool on its merits. The process takes five simple steps.
- Find a clear swing. Pick an obvious low-to-high move in an uptrend, or high-to-low in a downtrend.
- Anchor the tool. Drag the Fibonacci Retracement from the start of the swing to its end.
- Read the levels. The platform plots the 23.6%, 38.2%, 50%, 61.8%, and 78.6% lines automatically.
- Watch the pullback. Look for price to stall and hold at one of the deeper levels.
- Confirm the resume. Wait for a candle or momentum signal before you trust the bounce.
The concept graphic below maps a full retracement grid onto a swing, so you can see how each ratio spaces out across the move.
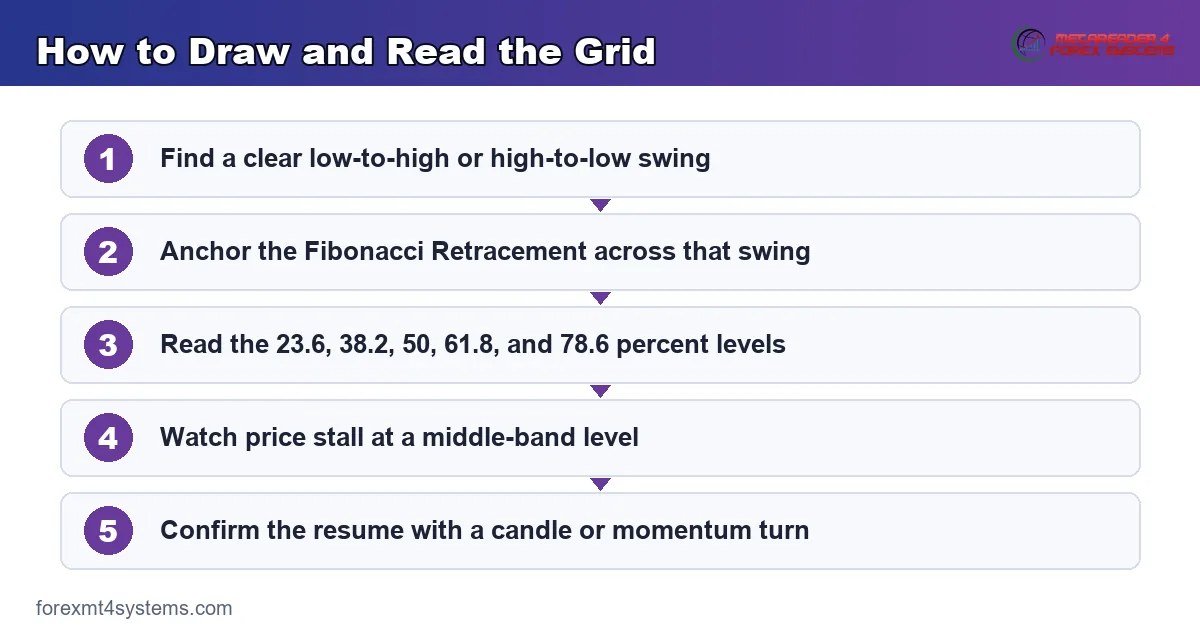
One detail matters more than the rest. The 50% line is not a Fibonacci number at all. It survives because a halfway pullback is a natural, common stall point, so traders bolted it onto the grid out of pure practicality.
Which Levels Carry Weight
Not every level deserves equal respect. In practice, the 38.2%, 50%, and 61.8% levels draw the most attention and the most orders. So a shallow 23.6% pullback often means the trend is strong, while a deep 78.6% pullback warns that the move may be failing.
Think of the grid as a map of expectations. Because most traders anchor on the middle band, those levels behave like busy intersections. The extreme levels see lighter traffic, so they react less reliably on their own.
Depth also tells a story about strength. A trend that only pulls back to 38.2% shows aggressive buyers who refuse to wait. So a deep retrace toward 78.6% hints at doubt, where the pullback starts to look more like the first half of a reversal.
Read the depth as a mood gauge, not a rule. Because context always matters, a deep pullback in a powerful trend can still bounce hard. So combine the depth reading with structure and momentum before you decide the trend is truly in trouble.
How Fibonacci Fits a Real Workflow
The tool earns its keep as a filter, not as a standalone trigger. So the smart approach never asks a lonely Fibonacci level to carry a trade by itself. Instead, it stacks the level with other evidence.
Start with the trend. Fibonacci retracement is a trend-continuation tool, so it belongs in a market that already moves in one direction. When the higher timeframe trends up, you use the grid to time entries on the pullbacks, not to call tops.
Confluence Is the Real Edge
Here is where the tool stops being decoration. A Fibonacci level gains power when it lines up with independent evidence. So look for a 61.8% level that also sits on a prior support zone, a round number, or a moving average.
Because two unrelated signals rarely align by accident, that overlap raises the odds of a reaction. Our guide to support and resistance explained shows how to mark the zones that turn a Fibonacci line into genuine confluence. The Fibonacci indicators archive plots the grids automatically across your charts.
Settings and Timeframes
Keep the default ratios and change your anchors instead. So the honest variable is not the level list but the swing you choose. On higher timeframes the swings are cleaner, so the levels tend to behave more consistently there.
Match the tool to your style. Swing traders draw the grid on the daily and four-hour charts, while intraday traders drop to the one-hour and fifteen-minute. Our Fibonacci calculator prints exact retracement and extension prices once you enter your swing high and low.
Pairing With Momentum
Momentum tools add a second, independent voice. When price reaches a Fibonacci level and a momentum reading turns at the same moment, the two agree without knowing about each other. So that agreement is exactly the kind of confluence that lifts a setup above a coin flip.
Keep the pairing simple. One trend filter and one momentum check are plenty, and stacking five oscillators just adds noise. So let the Fibonacci grid mark the price, let the trend confirm the direction, and let momentum time the turn.
Building a Repeatable Routine
Turn the ideas above into a fixed sequence you run every time. First read the higher-timeframe trend, then drop down and anchor the grid on the latest clean swing. So the routine forces the trend check before the level check, which stops you from trading a grid in a market with no direction.
Write the steps down and follow them without shortcuts. Because discipline fades under pressure, a written routine protects you from the temptation to force a level that is not really there. So the process, not the ratio, becomes the true source of any edge the tool provides.
Worked Example: A EURUSD Pullback
Picture EURUSD trending up on the four-hour chart, with a strong leg from 1.138 to 1.148. Price now pulls back, and you want a spot to join the trend rather than chase it.
Anchor the Fibonacci Retracement across that leg. The 61.8% level lands near 1.142, and it happens to sit right on a prior support shelf. So you have two reasons to watch that price, not one. The chart below marks the level, the confluence, and the bounce that follows.
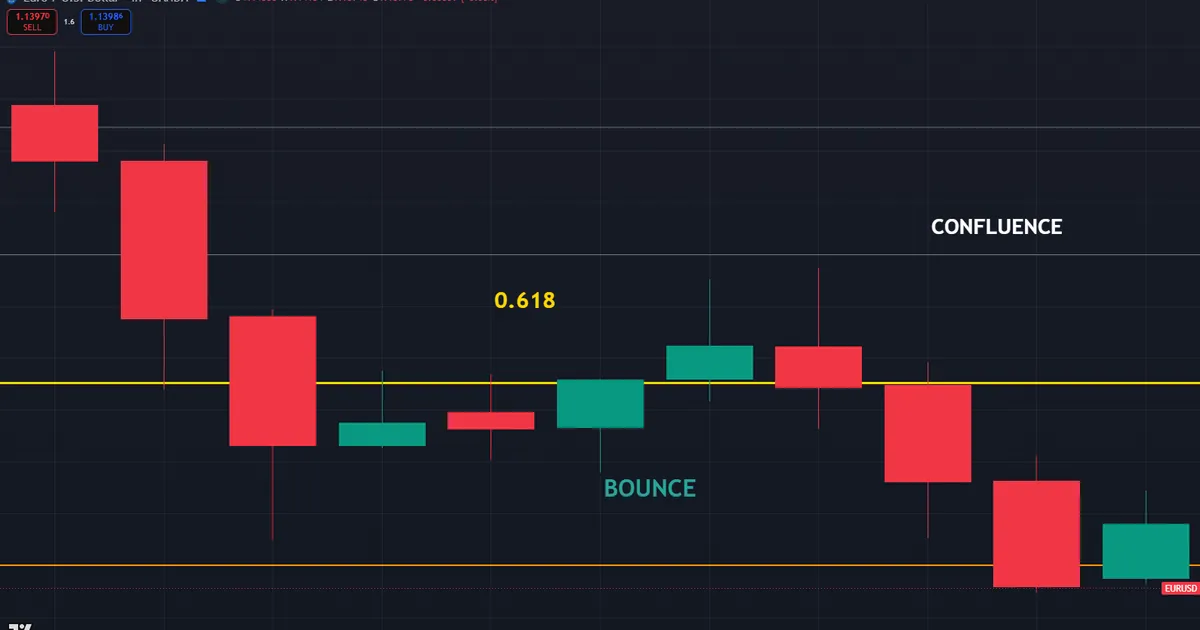
Then wait for proof before committing. A bullish close off 1.142, or a momentum turn, confirms buyers stepping in. So your stop sits just below the 78.6% level near 1.140, where a deeper break would prove the setup wrong. That tight risk against a trend-sized target keeps the math sensible.
Reading the Reaction
Judge the bounce by how price behaves, not by hope. A sharp, decisive rejection off the level signals real buying. A slow, sideways drift that leaks through the level warns that the pullback may deepen instead.
So the level is a question, and the candles are the answer. Because the grid only flags where a reaction might happen, your job is to read whether it actually did before you risk a cent.
Volume adds one more layer of proof. When price rejects a level on rising volume, real participants are stepping in, not just a lull in selling. So a bounce backed by a volume spike deserves more trust than a quiet drift higher off the same line.
Scaling Into the Level
Consider splitting the entry across the zone. Because the reaction rarely lands on the exact pip, you can place part of the position at 61.8% and part deeper near 78.6%. So a shallow slice fills first, and the deeper slice catches an overshoot without forcing one perfect price.
Keep the total risk fixed either way. Two half-positions must never add up to more than a single full one, or the plan quietly doubles the danger. So scaling improves your average price, yet it never excuses a larger loss if the whole idea fails.
Download the complete indicator database
Put these concepts on your charts. One email unlocks the full library of 1,380+ indicators with compiled MT4 and MT5 files, plus my TradingView scripts. No paywall, no spam, unsubscribe any time.
Get free access to my indicator database
One email unlocks 1,380+ free MT4, MT5 and TradingView indicators — the complete library. No single-tool download; you get the whole database.
Common Fibonacci Mistakes
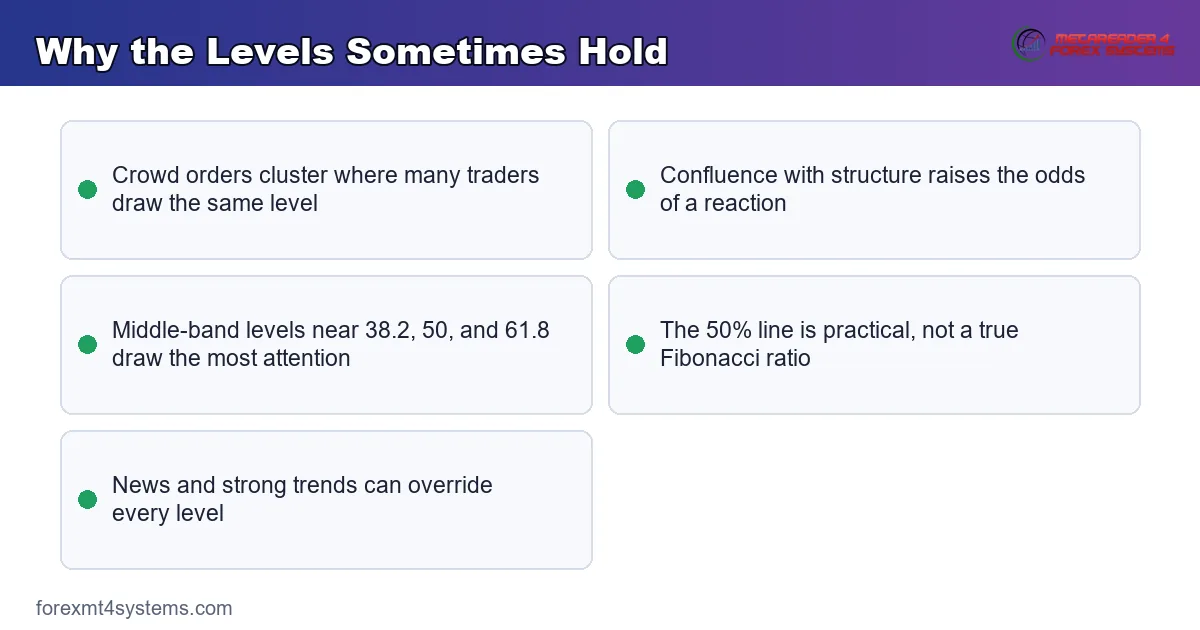
Most disappointment with the tool traces back to a handful of errors. Each one treats a probability aid as a crystal ball, and the fixes follow beneath the graphic.
Trading the Level Blindly
A price tag at 61.8% is not a signal by itself. Traders who buy the instant price touches a level get caught when it slices straight through. So wait for a candle or momentum confirmation, and let price prove the reaction before you act.
Cherry-Picking the Swing
Anchor bias ruins the tool. Some traders shift the swing points until a level magically fits where they already want to trade. So pick the most obvious high and low first, then read whatever the grid gives you honestly.
Ignoring the Trend
Fibonacci retracement assumes a trend to continue. Applying it to a choppy, directionless range produces random noise. So confirm a clear trend on the higher timeframe first, then use the grid to time pullbacks within it.
Skipping Confluence
A naked Fibonacci level is the weakest version of the tool. Because the ratio alone carries little edge, a level with no supporting evidence deserves little trust. So hunt for overlap with structure, round numbers, or a moving average before you lean on it.
Expecting Precision
The levels mark zones, not exact prices. Traders who demand a bounce to the pip end up frustrated. So treat each line as the center of a small band, and give the reaction a little room to develop.
Fibonacci Checklist
Run this quick list before you trust any Fibonacci setup. A few honest seconds here filters out most weak trades. So keep it in view, and let a missing tick talk you out of a marginal entry.
- Higher-timeframe trend identified and clearly in your direction.
- Swing anchored on the most obvious high and low.
- Pullback reaching a middle-band level near 38.2%, 50%, or 61.8%.
- Confluence present from structure, a round number, or an average.
- Confirmation candle or momentum turn at the level.
- Stop placed beyond the next deeper level.
- Risk fixed as a small percent of the account.
When Fibonacci Retracement Fails
Study the failure as hard as the success. Here is a classic trap. A trader sees EURUSD tag the 61.8% level near 1.142 and buys at once, sure the number promises a bounce. There is no other evidence in play.
Then the market ignores the line. Price pauses for a bar, drifts lower, and slices clean through 78.6% as the whole pullback turns into a full reversal. The chart below shows price cutting through the levels while the lonely long trade bleeds.
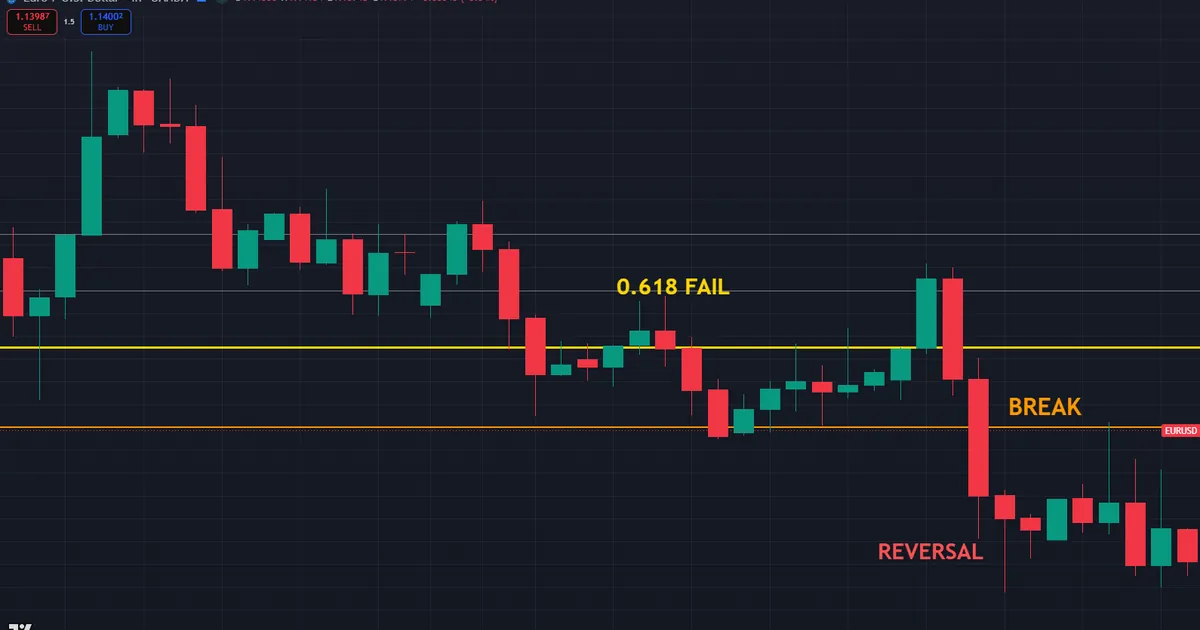
So what went wrong? The trader treated a probability zone as a promise and skipped every confirming step. Hence the core lesson of this whole guide: the level flags where to look, never what will happen. Without confluence and confirmation, a Fibonacci line is a coin flip with a fancy label.
Look closely and the warning signs were already there. Price barely paused at the level, the candle closed weakly, and no structure backed the line. So a patient trader would have skipped the entry entirely and waited for a cleaner setup elsewhere.
Trends That Never Retrace
Respect the strong trend that refuses to pull back. Sometimes price runs so hard that it barely touches 23.6% before continuing. So a trader waiting patiently at 61.8% simply never gets filled and watches the move leave without them.
Clashing Anchors
Two careful traders can draw two different grids on the same chart. One anchors on the intraday swing, another on the weekly leg, and their levels disagree by a wide margin. So the tool offers no single truth, only a reading that depends on the swing you choose.
Handle the clash with timeframe discipline. Because the higher-timeframe swing carries more weight, its levels usually win when two grids conflict. So anchor on the dominant swing for your style, and treat lower-timeframe grids as fine-tuning rather than the main map.
News That Overrides Structure
Remember that fundamentals outrank chart lines. A surprise rate decision or data release can blast price straight through every level as if the grid were invisible. So treat major news windows with caution, because no drawn line absorbs a genuine shock.
Related Concepts to Study Next
Fibonacci retracement links to a small web of ideas that sharpen it. The tool only measures pullbacks, so a companion tool measures where the next leg might reach. Structure decides whether a level carries real weight, and both partners appear in the sections above, ready to round out the picture. So treat each idea as one lens, and let the lenses agree before you commit.
For the fundamentals, our guide to what is Fibonacci retracement covers the basics from scratch, while how to use Fibonacci retracement walks through live entries. To measure targets rather than pullbacks, our guide to Fibonacci retracement vs extension shows the other half of the toolkit. So master confluence first, and let the grid simply frame the levels you already know how to read.
FAQ
Does Fibonacci retracement actually work?
It works as a probability filter, not as a magic predictor. No study proves the ratios beat other levels on their own, yet the tool still helps when many traders watch the same levels and when a level overlaps with real structure. So its value comes from confluence and crowd behavior, not from the numbers alone. Treat it as a disciplined framework for timing pullbacks, and your expectations stay grounded in reality.
Why do so many traders use it then?
Because it gives a clear, repeatable framework for timing pullbacks in a trend. The grid tells you exactly where to look, which imposes discipline on entries. So even a tool with no inherent edge can improve results by forcing a trader to wait for a defined level rather than chasing price.
Which Fibonacci level is the most reliable?
The 61.8% level draws the most attention, with 38.2% and 50% close behind. Reliability rises when a level overlaps with prior support or resistance, a round number, or a moving average. So no single level is dependable alone, and confluence matters far more than the specific ratio.
Is the 50% level a real Fibonacci ratio?
No, 50% is not part of the Fibonacci sequence. Traders added it because a halfway pullback is a natural and common stall point. So it earns its place on the grid through practical experience rather than mathematical pedigree.
Should I trade a Fibonacci level on its own?
No, a naked level carries little edge. The safer path waits for confluence with structure and a confirmation candle before entry. So use the grid to flag where a reaction might happen, then let price prove the reaction before you commit any risk.
Can Fibonacci retracement fail completely?
Yes, price often slices straight through every level, especially against a strong trend or a news shock. A level marks a zone of interest, never a promise. Manage risk on every trade, size positions with care, and confirm each setup. Results are not guaranteed; past performance is not indicative of future results.
External references
- For background on this concept, see Fibonacci Retracement at Corporate Finance Institute.
- For broader market context, see Fibonacci Channel at Investopedia.

About the author
Written by Dominic Walsh, a Forex trader and MT4/MT5 indicator, Expert Advisor and script developer. Every tool on forexmt4systems.com is tested on live charts before release and ships with ready-to-use compiled MT4 (.ex4) and MT5 (.ex5) files. Learn more about the trader and developer behind this site.
How we build, test and correct every tool: Editorial & Testing Policy. Trading carries risk; see the disclaimer.