
The Fibonacci retracement vs extension question trips up almost every new trader, because the two tools share a name and a set of ratios yet answer completely different questions. One tells you where to enter a pullback, and the other tells you where the next move might end.
So this guide settles the Fibonacci retracement vs extension confusion for good. By the end, you will know which tool draws entries, which tool draws targets, and how the pair works together across a single trade from start to finish.
Fibonacci Retracement vs Extension: The Core Difference
Start with the one sentence that clears up everything. Retracement measures how far price pulls back inside a completed move, while extension measures how far the next move might travel beyond it. So one looks backward into a correction, and the other looks forward into a projection.
The retracement tool lives between 0% and 100% of a prior swing. Its useful levels sit at 23.6%, 38.2%, 50%, 61.8%, and 78.6%, which mark shallow to deep pullbacks. Traders use those levels to time an entry as a trend pauses and then resumes.
The extension tool reaches past 100%. Its key levels sit at 127.2%, 161.8%, and 261.8% of the original leg, projected in the direction of the trend. So traders use those levels to set profit targets once a new move gets going.
The chart below shows both tools on EURUSD, four-hour. A retracement grid marks the pullback near 1.136, and an extension grid projects a target near 1.161 once price breaks higher.
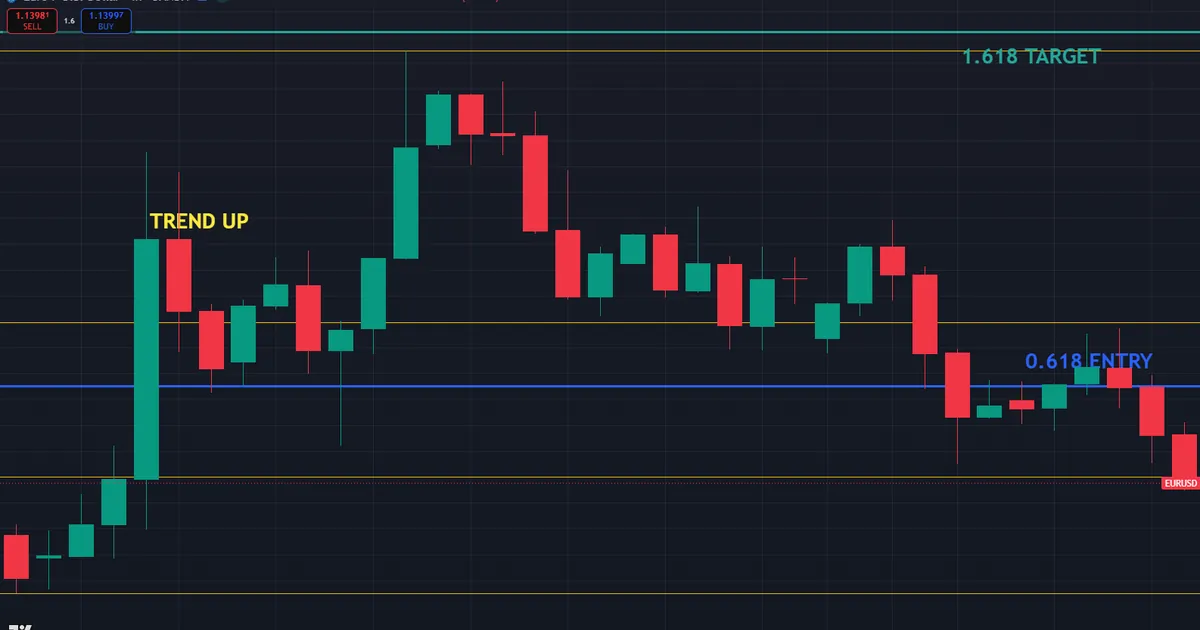
Notice how the two overlap in time. First the retracement catches the entry, then the extension catches the exit. So they are not rivals at all, but two halves of one complete plan.
This overlap explains why the pair beats either tool alone. A retracement without a target leaves you guessing when to exit, and an extension without an entry gives you nowhere to start. So the two only reach their full value when you run them as a set.
The Same Math, A Different Job
Both tools spring from the same Fibonacci ratios. The difference is only the anchoring and the range. Because retracement stays inside the move while extension projects beyond it, one tool answers “where do I get in” and the other answers “where do I get out”.
Keep that division of labor front of mind. So a trader who confuses the two ends up placing entries where targets belong, or targets where entries belong. That single mix-up wrecks the risk-to-reward math before the trade even starts.
A Quick Analogy
Think of a road trip to picture the split. The retracement is the rest stop where you pull over partway through the drive. The extension is the destination sign that tells you how far the road still runs ahead.
So one tool handles the pause, and the other handles the arrival. Because you would never confuse a rest stop with your final address, you should never confuse an entry level with a target level. That single image keeps the two jobs straight under pressure.
How Each Tool Is Built
Learn the anchoring once, because the anchor points define everything. Retracement needs two points, and extension needs three. The steps below cover both in order.
- Retracement start. Click the beginning of the completed swing, the low of an up-leg or the high of a down-leg.
- Retracement end. Click the end of that swing, and the platform plots the pullback levels between them.
- Extension point one. Click the start of the impulse leg you want to project.
- Extension point two. Click the end of that impulse leg.
- Extension point three. Click the end of the pullback, and the tool projects the 127.2%, 161.8%, and 261.8% targets forward.
The concept graphic below lays the two grids side by side, so you can see the two-point retracement below 100% and the three-point extension reaching beyond it.
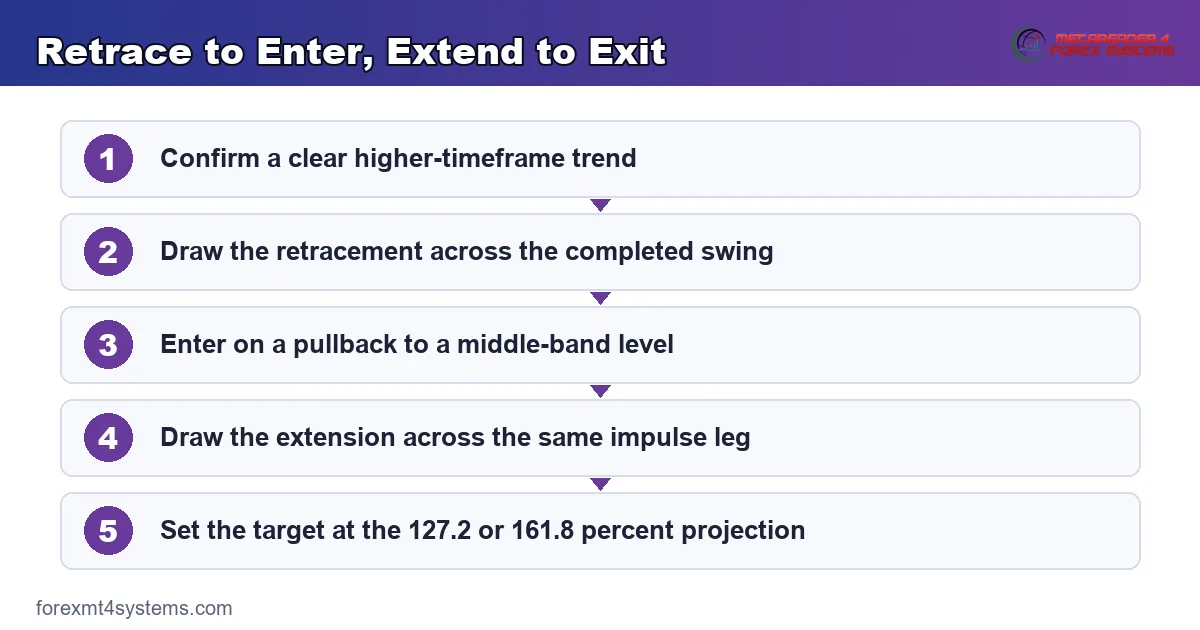
One habit saves a lot of grief. Always use the same swing for both tools within a single trade. So the retracement that framed your entry and the extension that frames your target share one clean, obvious leg on the chart.
Retracement and Extension Compared
The table below sums up the split at a glance. Keep it handy until the distinction feels automatic.
| Feature | Fibonacci Retracement | Fibonacci Extension |
|---|---|---|
| Purpose | Find pullback entries | Find profit targets |
| Range | 0% to 100% of the swing | Beyond 100% of the swing |
| Key levels | 23.6, 38.2, 50, 61.8, 78.6 | 127.2, 161.8, 261.8 |
| Anchor points | Two | Three |
| Direction | Against the trend leg | With the trend leg |
| Question answered | Where do I enter? | Where might it end? |
Why 161.8% Matters Most
Among the extension levels, 161.8% carries the most weight. It is the golden ratio projected forward, and many traders treat it as the primary target for a fresh impulse. So a first exit often sits there, with 127.2% as a conservative early target and 261.8% for a runaway move.
Match the target to the trend’s strength. Because a powerful, clean trend can reach far, an aggressive trader holds toward 261.8%. So a choppier move calls for booking gains earlier near 127.2%, where the odds of reaching a distant target drop off sharply.
Extensions Versus Projections
You may hear the terms extension and projection used loosely. Most platforms label the three-point tool as an extension, while a two-point tool that simply multiplies one leg is sometimes called a projection. So the names blur, yet the idea stays the same across both.
Do not lose sleep over the labels. Because the goal is always to map where the next move might reach, the exact wording matters far less than the anchoring. So pick the three-point extension for trend targets, and let the platform call it whatever it likes.
How the Pair Fits a Real Workflow
The two tools shine when you run them together on one trade. So the workflow is a simple loop: retrace to enter, extend to exit. Everything else just refines that loop.
Begin with the trend, exactly as with any continuation tool. When the higher timeframe trends up, you wait for a pullback and reach for the retracement grid. So the retracement times the entry while the trend supplies the direction.
Confirming the Entry First
Never skip straight to the target work. The entry has to earn its place before the extension matters at all. So wait for a confirmation candle or a momentum turn at the retracement level, exactly as you would with any pullback trade.
Only then does the projection become useful. Because a target means nothing without a valid position behind it, the sequence always runs entry first, target second. So treat the extension as the reward half of a plan whose risk half you have already locked down.
Turning Entries Into Targets
Once you are in, the job flips from entry to exit. Now you draw the extension across the same impulse leg and read where the projected levels land. So the 161.8% target becomes your primary objective, and the 127.2% level becomes a spot to trim.
Blend the projection with real structure. Because a prior high or a round number can cap a move, a target gains weight when an extension level lands right on top of it. Our guide to support and resistance explained shows how to spot those caps before price arrives.
Settings and Timeframes
Keep the default ratios and pick better swings instead. So the variable you control is the leg you anchor on, not the level list. Higher timeframes give cleaner swings, so both grids behave more consistently on the daily and four-hour charts.
Match the toolkit to your horizon. Swing traders project targets days ahead, while intraday traders read the same levels over hours. Our Fibonacci calculator prints exact retracement and extension prices the moment you enter your swing points. The Fibonacci indicators archive plots both grids automatically across your charts.
Reading Extension Clusters
Sometimes several projections stack near one price. When the 161.8% extension of one leg lands close to the 127.2% of another, that overlap forms a cluster. So a cluster acts like a magnet, and price often reacts more sharply there than at a single lonely level.
Hunt for these clusters on higher timeframes first. Because the bigger swings carry more weight, a cluster built from daily legs marks a serious zone. So mark it once, then watch how price behaves as it approaches from below.
When Targets Meet Round Numbers
Extensions gain extra force near round numbers. A projection at 1.1600 sitting right on a big figure combines two independent reasons for price to pause. So that overlap turns a soft target into a zone worth defending your gains around.
Watch the order flow as price nears such a spot. Because large orders often rest at round numbers, price can stall or reverse there whether or not the Fibonacci math agrees. So treat the round number as the anchor and the extension as the confirmation.
Worked Example: A EURUSD Trend Trade
Picture EURUSD trending up on the four-hour chart, with a clean impulse from 1.128 to 1.148. Price now pulls back, and you want both an entry and a target mapped before you act.
First draw the retracement across that leg. The 61.8% level lands near 1.136, right on a prior support shelf, so you plan a long there with a stop below 78.6% near 1.132. The chart below marks the entry level, the confluence, and the projected target above.
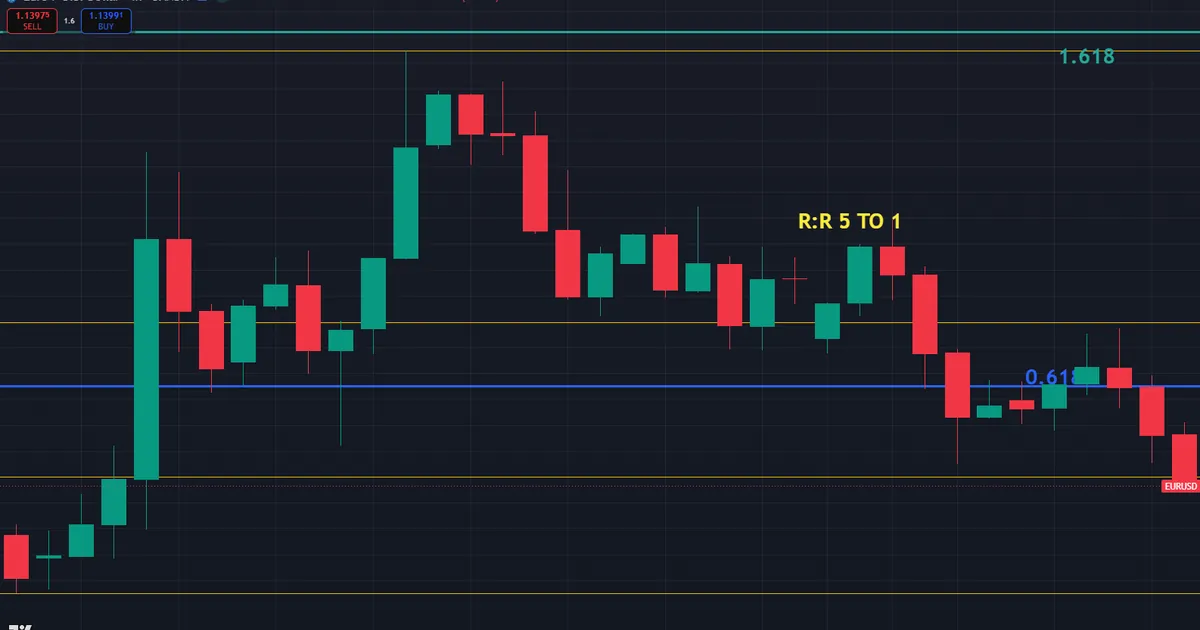
Then draw the extension across the same impulse and pullback. The 161.8% projection lands near 1.161, which becomes your primary target. So the trade now has a defined entry near 1.136, a defined stop near 1.132, and a defined objective near 1.161.
Reading the Reward-to-Risk
Now the numbers do the talking. Your risk is roughly 40 pips to the stop, and your reward is roughly 250 pips to the 161.8% target. So the trade offers better than a five-to-one payoff before you even weigh the odds.
That ratio is exactly why the pair matters. Because the extension frames a realistic target, you can judge whether a setup is worth the risk in advance. So a poor payoff talks you out of a marginal trade, and a strong one gives you the confidence to hold.
Managing the Trade to Target
Now walk the position toward the projection. As price clears the entry and pushes higher, you trail the stop up behind each new swing low. So a pullback that breaks structure closes the trade, while a clean run lets it breathe toward 161.8%.
Trim in stages rather than all at once. Because the 127.2% level often produces a pause, banking a slice there locks in gains without abandoning the move. So the remainder rides toward the primary target, and the trailing stop protects whatever the market gives back.
Download the complete indicator database
Put these concepts on your charts. One email unlocks the full library of 1,380+ indicators with compiled MT4 and MT5 files, plus my TradingView scripts. No paywall, no spam, unsubscribe any time.
Get free access to my indicator database
One email unlocks 1,380+ free MT4, MT5 and TradingView indicators — the complete library. No single-tool download; you get the whole database.
Common Fibonacci Toolkit Mistakes
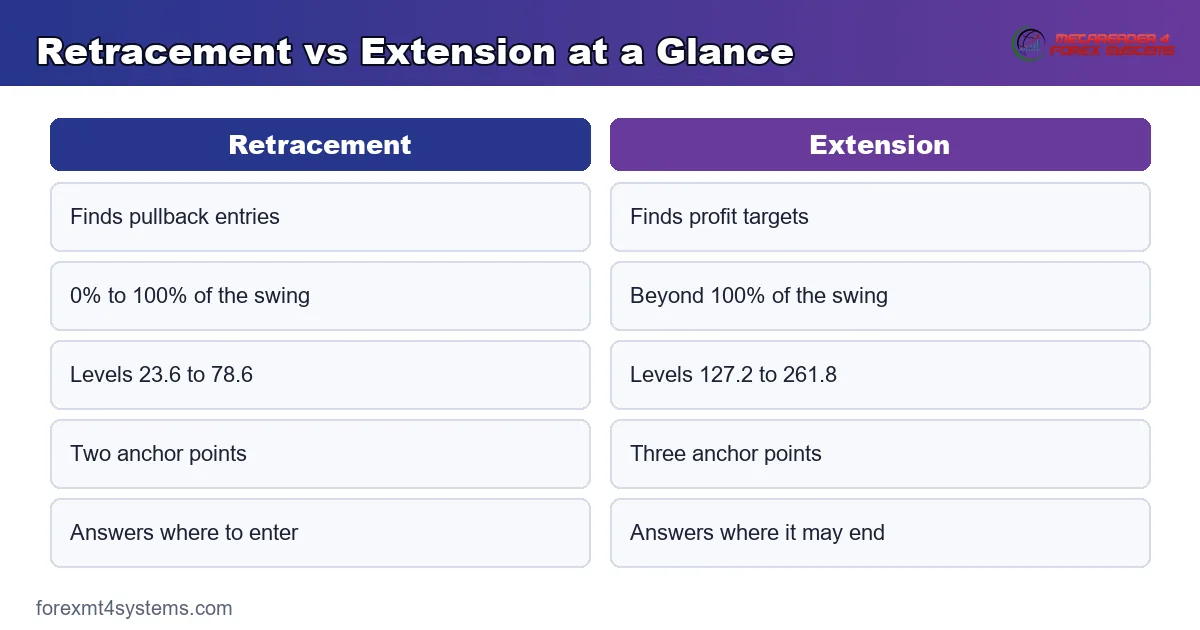
Most errors with this pair come from mixing up their jobs or anchoring them sloppily. Each mistake below has a clean fix, and the graphic sums them up.
Using the Wrong Tool for the Job
Traders sometimes set targets with a retracement or entries with an extension. That backward use scrambles the whole plan. So remember the rule: retracement for entries inside the move, extension for targets beyond it.
Anchoring on Different Swings
Drawing the two grids on separate swings produces levels that do not relate. The entry and target then live in different worlds. So anchor both tools on the same obvious impulse leg within a single trade.
Treating Targets as Certainties
The 161.8% level marks a likely reaction, never a certain stop. Price can fall short or blow past it. So treat each extension level as a place to manage the trade, not a wall that price must respect.
Ignoring the Trend Direction
Both tools assume a trending market. In a flat range, the projections point at empty air. So confirm a clear trend first, then let the retracement time the entry and the extension frame the exit.
Skipping Confluence on Targets
A lonely extension level carries the same weakness as a lonely retracement. Because the ratio alone holds little edge, a target with no supporting structure deserves modest trust. So look for a prior high or round number sitting near the projection before you lean on it.
Fibonacci Toolkit Checklist
Run this quick list before you commit to any Fibonacci trend trade. A few honest seconds here keeps the entry and target aligned. So keep it in view, and let a missing tick steer you away from a rushed setup.
- Higher-timeframe trend confirmed and clearly in your direction.
- Retracement anchored on the most obvious impulse leg.
- Entry planned at a middle-band level near 38.2, 50, or 61.8 percent.
- Extension drawn on the same leg and pullback.
- Target set at 127.2 or 161.8 percent, checked against structure.
- Reward-to-risk measured and judged worth taking.
- Risk fixed as a small percent of the account.
When the Fibonacci Toolkit Fails
Study the failure as closely as the winner. Here is a common trap. A trader enters a long at the 61.8% retracement near 1.136 and sets a target at the 161.8% extension near 1.161, then walks away certain the plan will run.
Then price refuses to cooperate. It stalls near the 127.2% level around 1.153, rolls over, and never reaches the projected target. The chart below shows price topping out well short of 161.8% while the open trade gives back its gains.
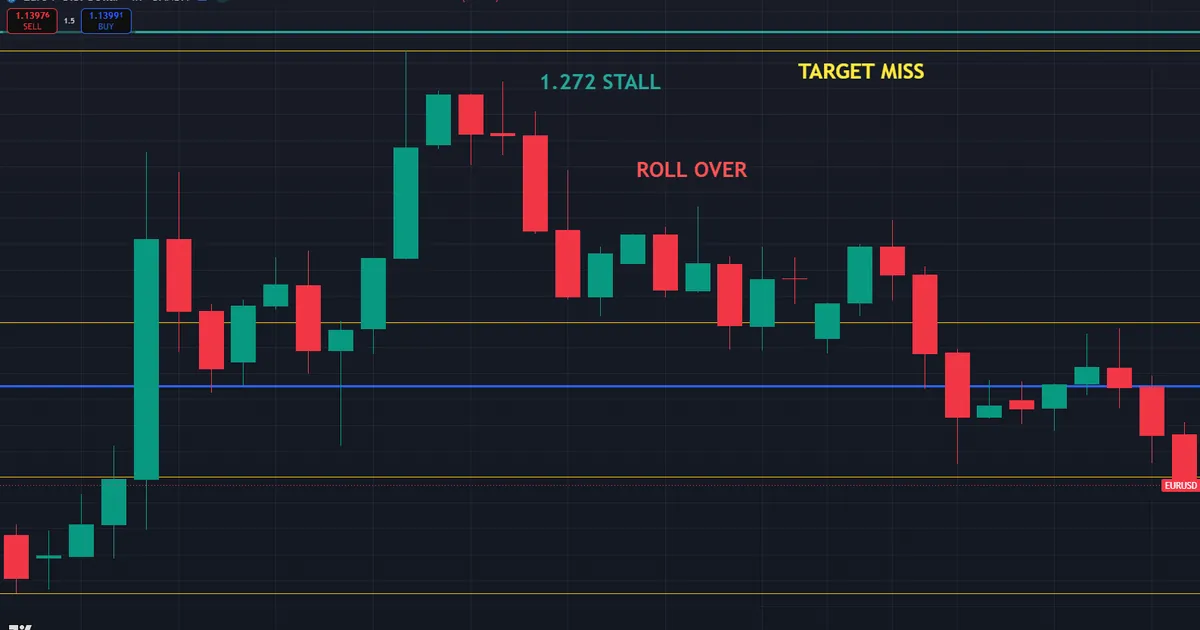
So what went wrong? The trader treated a distant projection as a promise and ignored a prior high sitting right at 127.2%. Hence the lesson: an extension level marks a possible reaction, not a fixed destination. When structure caps a move early, respect the structure over the ratio.
Overshooting the Target
The opposite failure stings too. Sometimes price blasts clean through 161.8% and runs to 261.8% while a trader exits far too early. So a rigid target can leave a large move on the table.
Balance the two risks with a plan. Because no one catches every pip, banking part of the position at 161.8% and trailing the rest handles both an early stall and a runaway. So a split exit respects the projection without betting everything on one exact price.
Accept that no exit rule wins every time. Sometimes the early trim looks foolish, and sometimes the trailing runner gives back gains. So judge the method over dozens of trades, not on the one move that stung you most recently.
Choppy Markets Break Both Tools
Neither tool survives a directionless range. When price chops sideways, the retracement levels overlap and the extension points at nothing. So step aside until a clear impulse forms, because both halves of the toolkit need a real trend to mean anything.
Watch for the false impulse too. A single strong bar can look like the start of a trend, then fade right back into the range. So demand a clean, multi-bar leg before you anchor either grid, and let a weak, choppy push go by without a trade.
Related Concepts to Study Next
The Fibonacci toolkit connects to a handful of ideas that sharpen it. Confluence with structure decides whether either grid carries weight, and an honest look at the evidence keeps your expectations grounded. Both threads appear in the sections above, ready to round out the toolkit. So treat each level as one input, and let the inputs agree before you trust a price.
For the fundamentals, our guide to what is Fibonacci retracement covers the basics from scratch, while how to use Fibonacci retracement walks through live entries. For a candid look at the edge, our guide to does Fibonacci retracement work weighs the evidence without the hype. So master the entry half first, then let the extension frame the targets you already know how to plan.
FAQ
What is the difference between Fibonacci retracement and extension?
Retracement measures a pullback inside a completed move and marks entry levels between 0% and 100%. Extension projects beyond the move and marks profit targets past 100%, at 127.2%, 161.8%, and 261.8%. So one tool finds where to enter, and the other finds where the next move might end.
Which Fibonacci extension level is most important?
The 161.8% level draws the most attention, since it is the golden ratio projected forward. Many traders treat it as the primary target, with 127.2% as an earlier, conservative exit and 261.8% for a strong runaway trend. So match the target you choose to how powerful the trend looks.
Can I use retracement and extension together?
Yes, and that pairing is the point. You draw the retracement to time an entry on a pullback, then draw the extension on the same leg to project a target. So the two tools form one complete plan, covering both the entry and the exit of a single trend trade. Anchor both grids on the same leg, and the entry and target stay in sync.
How many points does each tool need?
Retracement needs two anchor points, the start and end of a completed swing. Extension needs three, the start and end of the impulse leg plus the end of the pullback. So the extra point lets the extension project the next move forward rather than measure the last one. Get the three clicks in the right order and the projection lands cleanly.
Do I change the default ratios?
No, keep the standard ratios and change your anchors instead. The useful variable is the swing you choose, not the level list. Higher timeframes give cleaner swings, so both grids behave more consistently on the daily and four-hour charts than on very fast timeframes.
Is a Fibonacci target a sure thing?
No, an extension level marks a likely reaction, never a certainty. Price can fall short of it or blow straight through it. Treat every projection as a spot to manage the trade, confirm targets against real structure, and size each position with care. Results are not guaranteed; past performance is not indicative of future results.
External references
- For background on this concept, see Fibonacci Numbers at Corporate Finance Institute.
- For broader market context, see Golden Spiral on Wikipedia.

About the author
Written by Dominic Walsh, a Forex trader and MT4/MT5 indicator, Expert Advisor and script developer. Every tool on forexmt4systems.com is tested on live charts before release and ships with ready-to-use compiled MT4 (.ex4) and MT5 (.ex5) files. Learn more about the trader and developer behind this site.
How we build, test and correct every tool: Editorial & Testing Policy. Trading carries risk; see the disclaimer.