
The butterfly harmonic pattern is the member of the family that refuses to stay inside its own first leg. Point B retraces about 0.786 of XA, and point D finishes beyond X entirely.
That single difference changes the trade. This guide covers what the butterfly harmonic pattern asks for, how to draw it, and why an entry at a fresh extreme needs handling of its own.
What the Butterfly Harmonic Pattern Looks Like
Five points, four legs, one completion zone. The shape runs X to A, back to B, on to C, then out to D past the level where X sits.
Below sits a bearish example on NZDJPY four-hour bars from 26 to 30 July 2026. Point D printed at 95.309, with C down at 94.438.
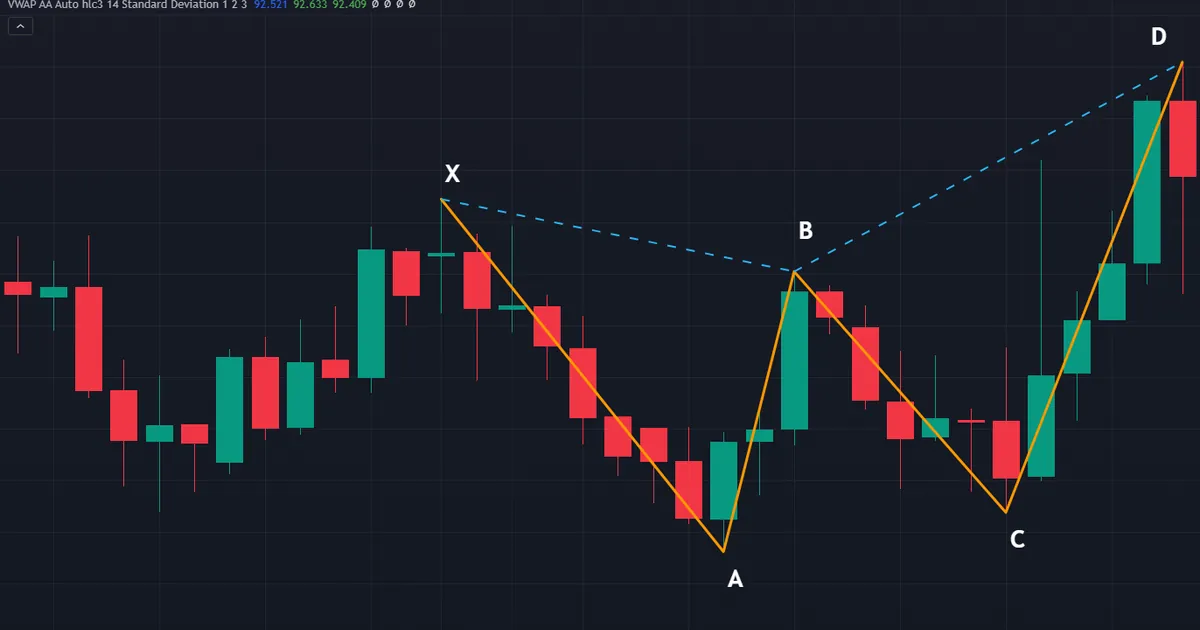
Its AD leg measured 1.389 of XA. That figure lands squarely inside the 1.27 to 1.618 band the pattern expects, which is what makes it a butterfly rather than a gartley.
The Deep B Retracement
Measure AB against XA first. A butterfly wants roughly 0.786, which is far deeper than the 0.618 a gartley takes or the 0.5 a bat allows.
On the NZDJPY example, AB came in at 0.795. That reading sits close to the ideal, and small misses like this one are entirely normal.
Deep B points matter for a reason. By the time price reaches B, most of the first leg has already unwound, so the shape starts from a stretched position.
The Extension Beyond X
Now measure the whole AD leg against XA. Anything near 1.27 to 1.618 puts you in butterfly territory.
Crucially, D sits outside the original swing. Price makes a new extreme, which no other member of the core family asks of you.
That extension is the defining feature. Our orientation guide to the list of harmonic patterns sorts the whole family by exactly this question.
Bullish and Bearish Versions
The shape works both ways round. A bearish butterfly puts X at a low and D at a new high, so the plan becomes a sell into the extension.
Flip everything for the bullish version. X then sits at a high, D forms at a new low, and the plan turns into a buy.
Ratios and stop logic carry across untouched. Only the direction of the drawing changes.
How the CD Leg Behaves
CD usually extends well beyond BC. On the NZDJPY example it ran 1.869 of BC, while BC itself retraced 0.86 of AB.
Wide CD legs are typical here. Since D has to clear X, the final leg has more ground to cover than in the contained patterns.
Do not use CD for naming, though. It varies too much to separate one pattern from another reliably.
How to Draw a Butterfly, Step by Step
Six steps take you from a blank chart to a placed order. Work through them in order every time.
- Mark a clean XA leg. Pick the swing you would point at without hesitating.
- Measure AB against XA. Look for a deep retracement near 0.786.
- Check BC stays inside AB. It should not run past point A.
- Project the extension. Measure 1.27 and 1.618 of XA beyond X and mark both.
- Band the D zone. Treat the space between those two levels as the completion area.
- Set the stop past the far edge. Then size the position from that distance.
Step four is where most drawings go wrong. Traders measure the extension from A rather than from X, which puts the zone in the wrong place entirely.

Keep the sequence fixed. Measuring after you have decided what you want to see produces agreeable numbers and poor trades.
Why Trading Beyond X Changes Everything
The extension is not a cosmetic detail. It alters the practical shape of the trade in three ways.
No Level Above the Entry
A gartley or bat completes inside old price action. Something has happened at that price before, which gives the zone at least some history.
A butterfly completes where price has never traded in this swing. The chart above your sell, or below your buy, is empty.
So the zone rests on arithmetic alone. That is a weaker foundation, and it deserves saying plainly rather than glossing over.
The Stop Has No Natural Home
Contained patterns put the stop just past X. Here D already sits past X, so that rule gives you nothing.
Most traders place the stop beyond the far edge of the extension band. Some use the 1.618 level, others add a volatility buffer on top.
Our note on ATR in trading covers how to size that buffer from recent range rather than from a guess.
Position Size Does the Heavy Lifting
Wider stops force smaller positions for the same risk. That arithmetic is not optional, and skipping it is how a single butterfly ruins a month.
Our ATR position size calculator converts a volatility-based stop into a lot size directly. Run it before the order goes in, not afterwards.
Then check what remains. If the position gets so small that costs dominate, the setup is telling you to pass.
The Stop Cluster Problem
Extensions run into resting orders. Traders holding the earlier trend keep their stops just beyond the old swing, and a butterfly zone often sits right on top of them.
Those orders fuel the final push. Price accelerates through the level, fills the cluster, and only then does the move have a chance to fade.
So expect an overshoot rather than a neat touch. Placing the stop tight against the band invites exactly the spike the structure creates.
Where the Butterfly Tends to Appear
Context decides whether a completion deserves attention. Three settings produce the examples worth looking at.
At the End of a Stretched Move
The shape needs an extension by definition, so it forms where price has already run hard. Quiet ranges rarely produce one.
That timing cuts both ways. Stretched moves do turn, and they also keep stretching for longer than most traders expect.
Into an Older Level Beyond the Swing
The strongest versions extend into a price that mattered on a higher timeframe. A weekly high sitting inside your daily extension band adds real weight.
Check the bigger chart before you trust the band. When nothing sits up there, the zone rests on arithmetic and nothing else.
Against a Weakening Trend
A butterfly reads best when the move into D has lost pace. Slowing bars and shrinking ranges support the idea that the extension is running out of buyers or sellers.
Momentum still rising argues the other way. In that case the extension band is more likely to become a stop cluster than a turning point.
A Worked Example on the Weekly Chart
Weekly examples show the geometry clearly. Take the bearish butterfly on XAGUSD that formed between November 2021 and March 2022.
Reading the Legs
AB retraced 0.823 of XA, slightly deeper than the 0.786 the pattern names. BC also measured 0.823 of AB, and CD extended 1.833 of BC.
The AD leg finished at 1.388 of XA, well inside the extension band. Point D printed at 26.94865, with C far below at 22.00695.

Every reading misses the textbook figure by a little. That is routine, and it is why practitioners work with bands rather than exact prices.
Entry, Stop and Target
The sell rests in the D zone, near 26.94865. Your stop goes above the far edge of the extension band, since nothing structural sits closer.
The first reference target is C, down at 22.00695. That is a long way, so partial exits along the route make far more sense than holding for the whole distance.
Mark the levels in between before entering. Old weekly swing points and round numbers all deserve a note on the chart.
Managing the Position
Take something at the first obvious level rather than waiting for C. Booking part of the trade early makes holding the rest far easier.
Then trail behind structure instead of by a fixed distance. Each new lower high on a short gives you a fresh reference, and the market sets the pace.
Resist moving to breakeven too quickly. Extensions often retest the band before the move develops, which stops out the impatient at the worst moment.
What the Costs Looked Like
Weekly trades carry financing as well as spread. A position held for weeks pays swap every night, which quietly eats into the projection.
Long targets absorb that better than short ones. Even so, work the cost into the plan rather than discovering it in the statement.
Compare the two horizons honestly. Four-hour butterflies cost less to hold and give less room, so neither choice is free.
Download the complete indicator database
Put these concepts on your charts. One email unlocks the full library of 1,380+ indicators with compiled MT4 and MT5 files, plus my TradingView scripts. No paywall, no spam, unsubscribe any time.
Get free access to my indicator database
One email unlocks 1,380+ free MT4, MT5 and TradingView indicators — the complete library. No single-tool download; you get the whole database.
Where the Butterfly Case Gets Weak
Harmonic material tends to skip this part. It belongs in the middle of the guide, not tucked into a footnote.
Tolerances Are Not Standard
One practitioner accepts a B retracement between 0.75 and 0.82. Another insists on 0.786 within a small window, and a third works in fixed pip terms.
So the same three swings produce different labels. That flexibility makes the shape awkward to test and easy to fit after the event.
The Evidence Base Is Thin
No solid published work shows that harmonic ratios beat ordinary support and resistance reading. Studies of classical chart patterns generally report modest and inconsistent results once costs enter the picture.
That does not make the framework useless. It does mean you should treat any confident claim about how often this shape delivers with real suspicion.
Hindsight Flatters Every Example
Completed butterflies look obvious in a screenshot. Live, you are choosing between candidate X points while the CD leg is still extending.
Keep your own count instead. Log every zone you marked, including the ones you skipped, and the picture usually turns sober within weeks.
Small Samples Prove Nothing
A gallery of ten clean butterflies settles no argument. Anyone can assemble that gallery afterwards, whatever the framework underneath.
Build your own count instead. Twenty logged setups from your own pairs tell you more than two hundred screenshots from strangers.
Then judge the record honestly. Include the ones you skipped, since a filter that removes good trades matters just as much as one that lets bad ones through.
Precision Is Not Accuracy
Three decimal places look scientific. Measuring a swing that finely tells you nothing about whether the market cares about the resulting price.
So read the numbers as a drawing convention. They organise the trade; they do not forecast it.
Common Butterfly Mistakes and the Fixes
Most trouble here traces back to a short list of habits. The comparison panel below sets this shape against its contained cousins.

Measuring the Extension From A
The 1.27 and 1.618 projections run from X, not from A. Getting that wrong shifts the whole zone and invalidates the plan before it starts.
Using a Gartley Stop
Placing the stop just past X puts it behind the entry. Since D already sits beyond X, the stop has to clear the far edge of the extension band instead.
Trading It as a Reversal
A completed butterfly describes a stretched move, not a confirmed turn. Read it as a zone with an exit attached rather than as a change of trend.
Ignoring the Higher Timeframe
A four-hour butterfly against a strong weekly trend fights the larger flow. Our trend indicators archive covers the tools that make that flow visible at a glance.
Holding for the Full Target
The move back to C is a projection. Price frequently stalls well short, so plan partial exits rather than waiting for the whole distance by default.
Skipping the Volatility Check
A fixed pip stop behaves differently on a quiet pair and a fast one. Size the buffer from recent range, then let position size absorb the difference.
Chasing Every Extension
Not every push past a swing high is a butterfly. Without the deep B retracement the shape does not qualify, whatever the CD leg looks like.
Entering Before the Zone Arrives
Anticipating the extension throws away the one advantage the framework gives you. Wait for price to reach the band, then act on the plan you wrote earlier.
Adding to a Losing Position in the Band
A zone has width, so averaging down feels defensible. Yet a band exists to be respected once, not filled again and again while price walks through it.
Forgetting the Session
An extension completing in thin Asian hours behaves differently from one completing at the London open. Note the session on the touch, then adjust what you expect next.
Butterfly Quick Reference
Keep this table beside the chart until the ratios feel automatic. Each row states a condition rather than an outcome.
| Element | What to check | Common practice |
|---|---|---|
| XA leg | A clean, obvious first swing | Visible without zooming |
| AB retracement | Near 0.786 of XA | Small band either side |
| BC retracement | Part of AB, not beyond A | Roughly 0.382 to 0.886 |
| CD extension | Long projection from BC | Often well above 1.618 |
| D completion | 1.27 to 1.618 of XA, beyond X | Drawn as a band, measured from X |
| Stop | Past the far edge of the band | Volatility buffer added |
| First target | Back toward C | Partial exit, not the full size |
Notice what the table leaves out. Nothing here says how often the shape follows through, because that figure shifts with the market, the period and the tolerance you apply.
When the Butterfly Turns and Still Fails
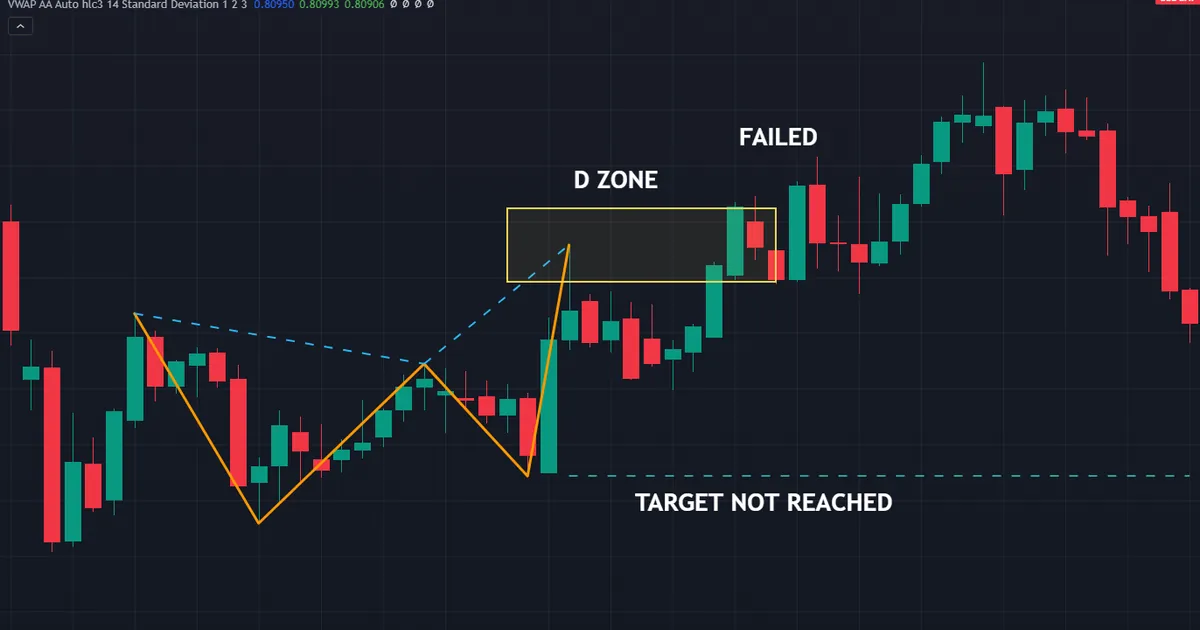
Failures teach faster than tidy examples. Below is a bearish butterfly on USDCHF daily bars, formed between 1 February and 2 March 2026, where the target never arrived.
What the Legs Looked Like
AB retraced 0.76 of XA, close enough to 0.786 for most tolerance bands. BC measured 0.703 of AB, and CD extended 2.06 of BC.
The AD leg finished at 1.326 of XA, comfortably inside the extension band. Point D printed at 0.78788, with C below at 0.76716.
The Drop That Fell Short
Price reversed at the extension exactly as planned. The sell ran 131 pips lower and reached 0.77482 on 9 March.
Then it stopped. That low sat 77 pips above the C target at 0.76716, so the first objective never filled and nothing got booked.
Note the shape of this failure. Nothing ignored the zone on the touch; the reversal simply ran out of sellers before the target.
How It Ended
Buyers took control from 11 March. The very next session closed at 0.79136, clear of D at 0.78788, which voids the completion the trade was built on.
That is the specific risk of trading beyond X. Nothing structural sits above the entry, so once the extension resumes it has no obvious place to stop.
The Warning Signs Beforehand
Momentum never faded on the way into that zone. Bars kept their size, and the extension arrived with pace rather than exhaustion.
Nothing structural sat above the band either. No older high, no round number and no weekly level gave the zone anything to lean on.
Neither clue proves an outcome. Both, however, would have argued for a smaller position or for standing aside altogether.
What the Failure Costs
Stops here are wide by construction. A trader who sized from the account rather than from the stop distance takes a disproportionate loss on exactly this kind of break.
Traders who widen the stop after entry fare worse still. Once price clears the band, the reason for the trade has gone.
The Habit Worth Building
Log every completion you marked, whether you traded it or not. Our capstone on why chart patterns fail covers the traps that apply to every shape on the chart.
Then review the losers first. Patterns in your own mistakes surface faster than patterns in the market.
Related Concepts to Study Next
Start with the contained cousin. Our walkthrough of the gartley pattern covers the version where D stops short of X.
Then compare the two shapes that stay inside the first leg. Our note on the bat and the gartley shows how two numbers separate them.
Extensions deserve separate study as well. Our guide to retracement against extension explains which tool measures what, which is the exact confusion that misplaces butterfly zones.
For tooling, our harmonic indicators archive collects the scanners that draw XABCD legs automatically. Automation saves the measuring time, though the choice of X stays a judgement call.
A Sensible Order of Study
Begin with levels, since every zone worth trading sits near one. Add trend reading next, because an extension against strong flow gets very few bars to work.
Bring the ratios in last. Learning them late keeps the arithmetic where it belongs, as a refinement on top of chart reading rather than a substitute for it.
Then practise on closed charts before risking money. Replay a few months of bars, mark each extension as it forms, and count honestly how many you would have found live.
Finally, decide your tolerance bands in advance and write them down. A window you choose in the moment is a preference, not a rule, and it will drift toward whatever you already wanted to trade.
The Honest Summary
A butterfly turns a stretched move into a defined band with a defined exit. That structure helps you plan and size a trade, which is worth having.
It is not proof that the ratios forecast anything. Judge each zone by where it lands, by what the wider chart says, and by whether the numbers still work once costs come out.
FAQ
What is a butterfly harmonic pattern?
It is a five-point structure labelled X, A, B, C and D, where B retraces about 0.786 of the XA leg and D completes beyond X at roughly 1.27 to 1.618 of XA. The extension past X is what separates it from a gartley or a bat.
How is it different from a crab?
Both extend beyond X, so they share the same basic idea. A crab pushes further, completing near 1.618 of XA, and it allows a shallower B retracement. The butterfly sits closer to X with a deeper B.
Where do I measure the extension from?
From X, using the XA leg as the unit. Projecting from A instead is the single most common drawing error, and it puts the completion zone in the wrong place entirely.
Where should the stop go?
Beyond the far edge of the extension band, usually past the 1.618 level with a volatility buffer added. Since D already sits outside X, the contained-pattern rule of stopping just past X does not apply here.
Is the butterfly riskier than a gartley?
It carries a different risk rather than simply more of it. The entry sits at a fresh extreme with no prior price action above or below it, and the stop has no structural anchor, so position size has to do more work.
What timeframe suits it best?
Four-hour and daily charts give the swings room to stand out, and weekly examples appear too. Lower timeframes throw up far more candidates, and most dissolve before the extension completes.
Does the butterfly pattern actually work?
No published evidence shows that harmonic ratios outperform ordinary support and resistance reading. What the shape offers is a structured way to define a completion zone, an entry and an exit, which genuinely helps with planning and sizing. Treat any specific claim about how reliably it delivers as unsupported. Results are not guaranteed; past performance is not indicative of future results.
External references
- For background on this concept, see Harmonic Patterns in the Currency Markets at Investopedia.
- For broader market context, see Fibonacci Numbers at Corporate Finance Institute.

About the author
Written by Dominic Walsh, a Forex trader and MT4/MT5 indicator, Expert Advisor and script developer. Every tool on forexmt4systems.com is tested on live charts before release and ships with ready-to-use compiled MT4 (.ex4) and MT5 (.ex5) files. Learn more about the trader and developer behind this site.
How we build, test and correct every tool: Editorial & Testing Policy. Trading carries risk; see the disclaimer.