
The wedge pattern meaning rests on one detail: both boundary lines slope the same way while the range between them narrows. That single feature separates a wedge from every triangle on the chart.
Get that detail wrong and you mislabel the shape. This guide covers the rising wedge, the falling wedge, the confirmation rule, and the way each version disappoints traders who lean on it.
Wedge Pattern Meaning: Two Lines, One Direction
Start with the drawing. Run one trend line across the swing highs, another across the swing lows, then look at where both lines point.
A wedge has both lines heading the same way. They either both rise or both fall, and the gap between them shrinks as the shape develops.
Triangles behave differently. There the boundaries lean in opposite directions, or one of them stays flat, which produces a very different reading.
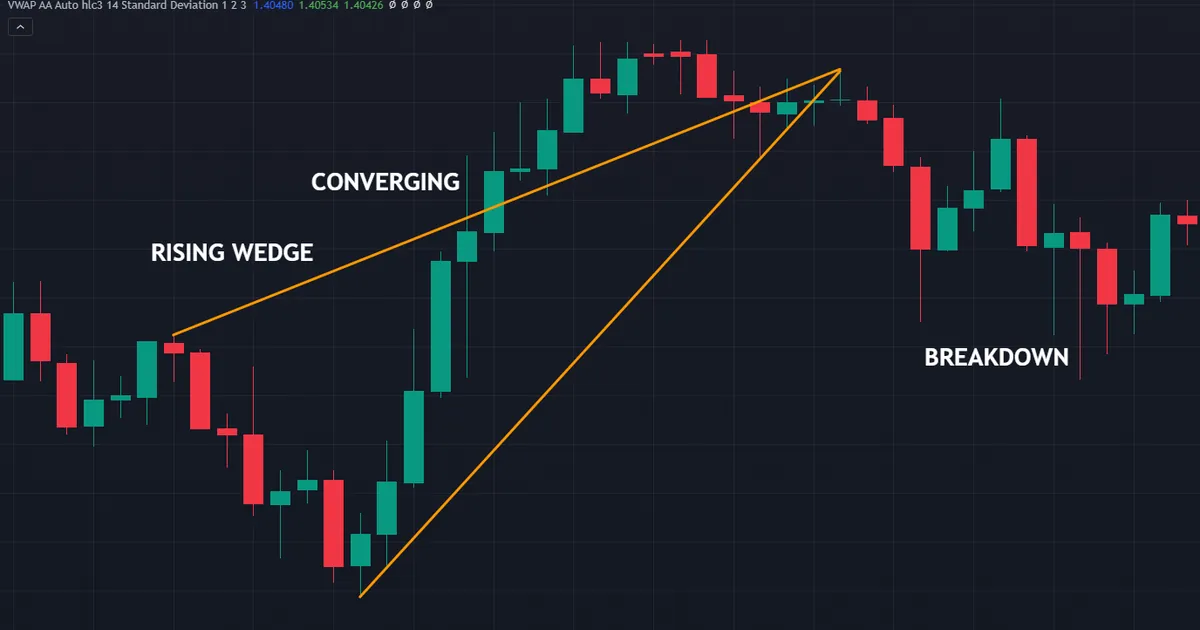
Above sits a rising wedge on the USDCAD hourly chart. Both lines climbed through the structure, the gap between them closed to a fraction of a pip, and price then broke down through the lower boundary near 1.41082.
Rising Wedge: Both Lines Climb
In a rising wedge the highs and the lows both step upward. Crucially, the lows climb faster than the highs, so the range tightens on the way up.
That combination describes fading pressure. Price still makes new highs, though each push covers less ground than the one before it.
Traders read the shape as bearish for exactly that reason. Buyers keep working, and their reward keeps shrinking, which sets up a break through the lower line.
Falling Wedge: Both Lines Fall
A falling wedge mirrors that arrangement. Highs and lows both step lower, and the highs fall faster than the lows, so the range tightens on the way down.
Selling pressure fades as the shape develops. Each new low sits only slightly below the last, which suggests supply has thinned rather than intensified.
The conventional reading turns bullish here. Our dedicated falling wedge guide walks through the execution side of that specific shape in detail.
Convergence Separates a Wedge From a Channel
Two rising lines running parallel make a channel, not a wedge. The distinction sounds pedantic, and it changes the entire reading.
Measure the vertical gap early in the structure, then measure it again near the right edge. A wedge shows a clear reduction, while a channel keeps roughly the same width throughout.
So take the measurement rather than trusting the eye. Sloped lines fool most people, and a channel labelled as a wedge produces a confirmation price that means nothing.
How a Wedge Differs From a Triangle
Both families converge, so both look similar at a glance. Slope direction settles the argument every time.
A triangle has one flat line, or two lines leaning toward each other from opposite directions. A wedge has two lines leaning the same way while the space between them closes.
That difference flips the conventional reading. Our guide to the types of triangle patterns covers the three converging variants that sit on the other side of this line.
How to Tell a Wedge From a Triangle
Run the same six checks every time. Step three does most of the work, because it catches the shapes people mislabel.
- Find two touches per line. Two highs and two lows give you something to draw across.
- Confirm the range narrows. Measure the vertical gap early and late.
- Compare the two slopes. Same direction means wedge; opposite or flat means triangle.
- Identify which line moves faster. That tells you whether pressure fades on the upside or the downside.
- Name the shape. Both lines up gives a rising wedge; both lines down gives a falling wedge.
- Write the confirmation price. Fix the level a close must clear before you act on anything.
Naming comes fifth on purpose. Traders who choose the label first then bend the lines until the chart agrees with them.
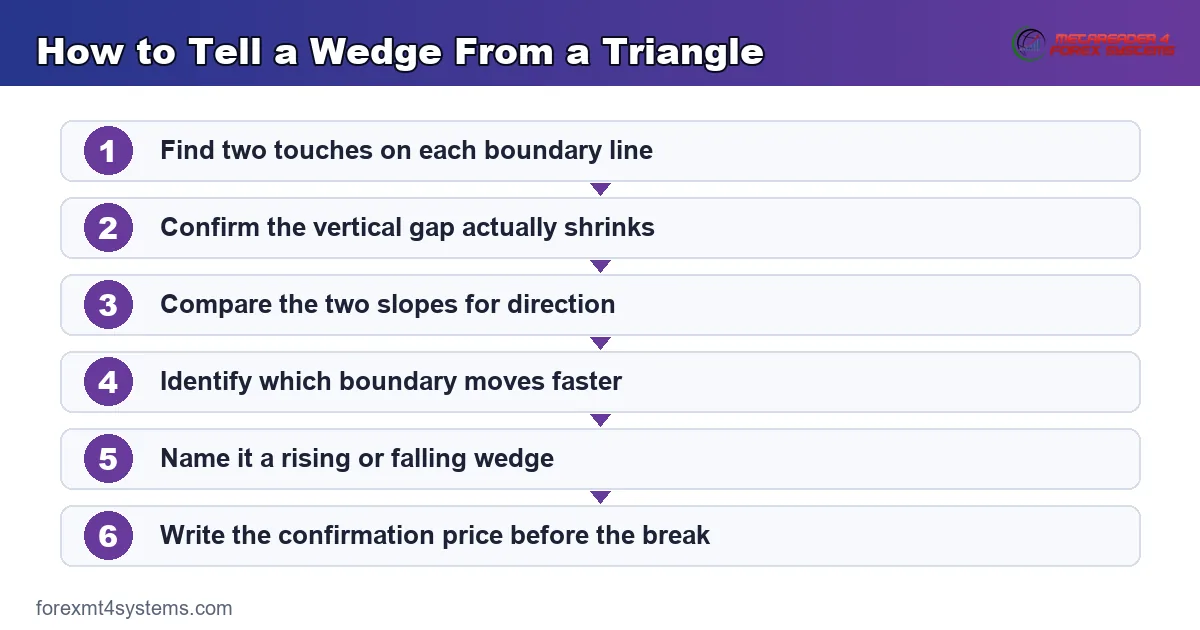
Fix both lines once the second touch confirms them. A boundary you nudge afterwards has stopped describing the market and started describing your preference.
What a Wedge Says About Momentum
Every wedge records a slowdown. Price continues in one direction while the effort behind it visibly weakens.
Why a Rising Wedge Reads Bearish
Higher highs normally look encouraging. Inside a rising wedge they arrive with less and less separation, which changes the message.
Look at the lower line for the tell. Rising lows that outpace the rising highs mean each pullback gets bought sooner while each advance stalls earlier.
Buyers end up crowded into a narrowing space. When the lower boundary finally gives way, everyone who bought inside the shape sits underwater at once.
Why a Falling Wedge Reads Bullish
Lower lows normally look discouraging. Inside a falling wedge they arrive grudgingly, with each new low only marginally under the last.
The upper line falls faster in that arrangement. Rallies get sold quickly, and yet the market cannot manufacture a proper decline.
Traders read that as supply drying up. A close above the upper boundary then confirms the shift rather than predicting it.
Reversal or Continuation
Wedges wear two hats depending on where they form. A falling wedge inside an established uptrend usually marks a pause before the advance resumes.
The same falling wedge at the end of a long decline plays a different role. There it marks the point where selling ran out of energy, which makes it a reversal shape instead.
Rising wedges work the same way in reverse. One inside a downtrend pauses the decline, while one at the top of an extended rally suggests the advance has run its course.
So read the surroundings before you assign a role. The drawing rules never change, and the meaning changes completely.
What the Shape Cannot Tell You
A wedge describes structure that has already formed. It records where the touches landed, and it says nothing certain about the next fifty bars.
Published testing of classical chart shapes has produced modest and inconsistent results. Outcomes move with the instrument, the period, the transaction costs and the exact drawing rules applied.
Treat the conventional readings as conventions, then. Rising wedges break upward often enough to ruin anyone who treats the bearish label as settled.
Where a Wedge Deserves Attention
Location decides whether a shape earns capital. These structures appear constantly on fast charts, and most of them sit nowhere interesting.
At the End of an Extended Move
The most useful wedges arrive late in a run. A rising wedge after months of advance carries a different weight from one drawn inside a quiet range.
Context supplies the meaning. Fading pressure matters when there was pressure to fade, and it means very little otherwise.
Against a Level That Already Mattered
Check what sits at the boundary before you commit. A rising wedge whose upper line runs into an old weekly high has two independent reasons to stall.
Price should have reacted there before the wedge started forming. A level created entirely by the shape itself carries far less history.
Our guide to drawing trend lines covers how to establish those boundaries before the shape tempts you into moving them.
Where the Break Would Land
Look ahead before the shape completes. A rising wedge whose lower line points straight into an old support shelf gives the break something obvious to aim at.
Empty space works in your favour too. A boundary with nothing between it and the projection tends to travel more freely than one facing a wall of prior swings.
Either way, map the ground first. Knowing where the obstacles sit turns the projection into a plan rather than a hope.
Time and Touch Count
Two touches per line make the minimum. Three or more make the boundary easier to defend, though they also consume more of the wedge’s remaining space.
Duration matters as much as touch count. A wedge built from four bars records a quiet hour, while one built over months records a genuine loss of momentum.
Both wedges shown in this guide formed over roughly a day on the hourly chart. That timescale suits an intraday trader and offers very little to a position trader.
Confirming the Break and Projecting the Move
One rule governs both versions. A close beyond a boundary completes the shape, and a wick through it completes nothing at all.
The Close Beyond the Line
Decide which close counts before the trade begins. A wedge drawn on the hourly chart deserves an hourly close, not a one-minute one.
Sloped boundaries move with every bar. That drift makes wick-based triggers even less reliable here than on a horizontal level.
Retests happen often after a genuine break. The old boundary then acts from the other side, and plenty of traders prefer that tighter second entry.
Measuring the Wedge
The usual projection takes the height at the widest part. Measure the vertical distance at the left edge of the shape, then apply it from the break point.
Treat that figure as a projection rather than a promise. Price frequently stops short of it, which is precisely why partial exits exist.
Some traders target the origin of the wedge instead. Either convention works, provided you pick one, write it down and apply it consistently.
A Falling Wedge in Practice
Now look at the bullish version on a real chart. The structure below formed on USDCAD across three sessions on the hourly timeframe.
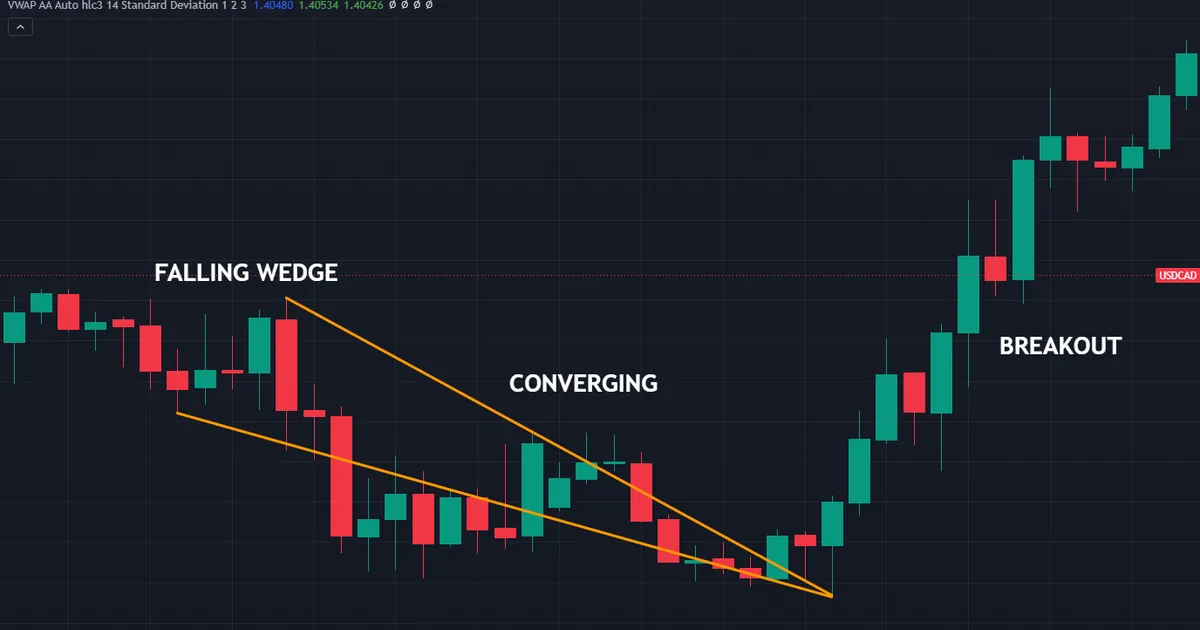
Both boundaries sloped down while the range tightened. By the break the lines had closed to almost nothing, and price settled above the upper boundary near 1.40034.
Tight structures leave little room for error. Compare the stop distance against the nearest sensible target before committing, and reject anything that fails your own ratio.
Download the complete indicator database
Put these concepts on your charts. One email unlocks the full library of 1,380+ indicators with compiled MT4 and MT5 files, plus my TradingView scripts. No paywall, no spam, unsubscribe any time.
Get free access to my indicator database
One email unlocks 1,380+ free MT4, MT5 and TradingView indicators — the complete library. No single-tool download; you get the whole database.
Sizing and Managing a Wedge Trade
Naming the shape solves the easy half. Stop placement, size and exits decide most of what actually lands in the account.
Where the Stop Belongs
Put the stop beyond the opposite boundary rather than a few pips past the line you traded. A stop tucked inside the wedge sits exactly where ordinary noise reaches.
Wedges near their apex create a trap here. The two lines sit so close together that the natural stop looks tiny, which tempts traders into oversized positions.
Size from volatility instead of from the shape. Our ATR position size calculator ties the stop to the market’s own range rather than to a boundary that happens to be nearby.
Entry on the Close or the Retest
Taking the close catches every break and accepts a worse fill. Waiting for the retest gives a tighter stop, though a fair share of breaks never come back.
Splitting the order removes the choice. Half enters on the close, half rests as a limit at the boundary, and both halves share one stop.
Scaling Out Along the Way
Mark the obvious levels between entry and projection before the trade starts. An old swing, a round number and the session extreme all deserve a note.
Then take a slice at the nearest one. Booking part of the position early makes holding the remainder through a normal pullback far easier.
Common Wedge Mistakes and the Fixes
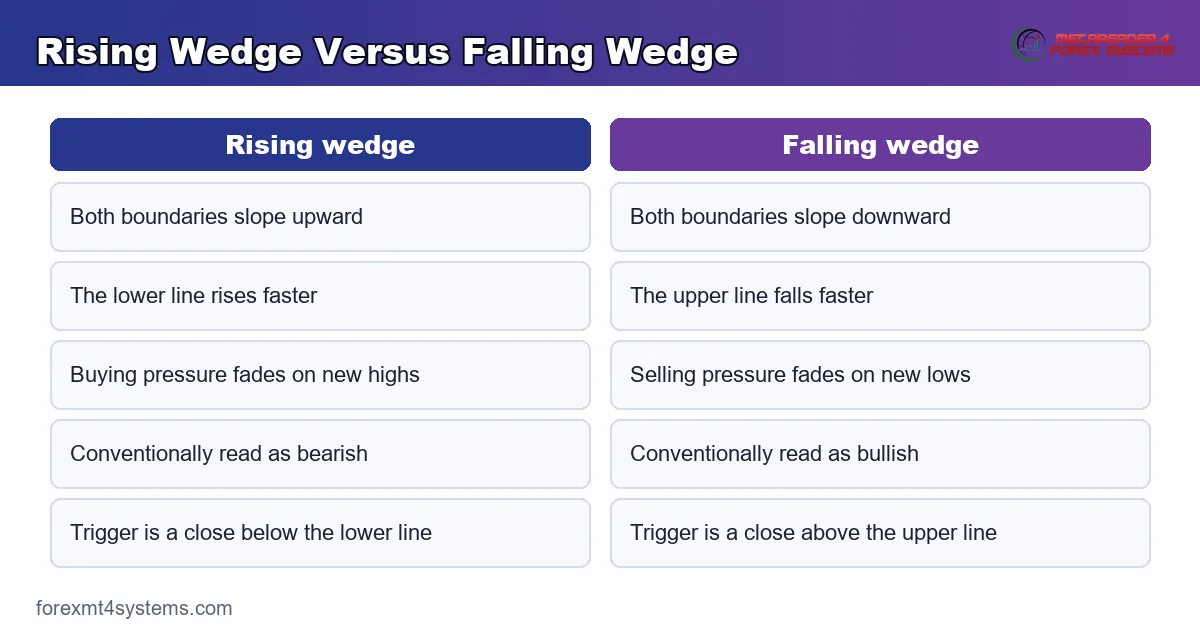
Most losses around these shapes trace back to a short list of habits. The comparison below keeps the two versions straight while you learn them.
Confusing a Wedge With a Triangle
Check the slopes before anything else. Two lines heading the same way make a wedge, and one flat line makes a triangle whatever the other side does.
Drawing a Wedge That Never Narrows
Parallel sloped lines make a channel. Measure the gap at both ends, and drop the wedge label when the second reading matches the first.
Treating the Conventional Reading as Settled
Rising wedges break upward regularly, and falling wedges break downward. Plan the invalidation before the entry, because the label offers no protection.
Trading Too Close to the Apex
Wedges lose meaning once the lines almost touch. Most traders stop taking breaks beyond about three quarters of the way along the structure.
Acting on the Wick
A spike through a sloped boundary completes nothing. Wait for the close on the timeframe that drew the lines, and most false triggers never reach your account.
Moving a Boundary to Fit
Nudging a line until a break appears defeats the exercise. Fix both lines at the second touch, then leave them exactly where they sit.
Ignoring the Higher Timeframe
An hourly wedge inside a firm daily trend fights the larger flow. Check the bigger chart first, or trade smaller when the two disagree.
Forcing a Wedge Onto Three Bars
Every chart contains countless tiny converging shapes. A structure built from a handful of candles records noise, so give the shape enough time to mean something.
Skipping the Session Check
Breaks in thin hours behave differently from breaks into a busy session. Note which session produced the closing bar, then treat a quiet-hours trigger with extra caution.
Wedge Quick Reference
Keep this table beside the chart while the two versions become familiar. Each row states a condition rather than an outcome.
| Element | Rising wedge | Falling wedge |
|---|---|---|
| Upper line | Rises | Falls faster |
| Lower line | Rises faster | Falls |
| Range | Narrows on the way up | Narrows on the way down |
| What fades | Buying pressure | Selling pressure |
| Conventional reading | Bearish | Bullish |
| Trigger | Close below the lower line | Close above the upper line |
| Stop | Beyond the upper line | Beyond the lower line |
Then run these six checks before any entry.
- Two touches minimum on each boundary
- Both lines sloping the same way
- A vertical gap that measurably shrinks
- A level, trend or session extreme that already mattered
- A written confirmation price fixed before the break
- A stop tied to volatility rather than to the nearest line
Notice what the list omits. Nothing here suggests how often either version follows through, because that figure shifts with the market, the period and the definition applied.
When a Wedge Fails
Failed shapes move quickly, and traders who trusted the conventional label feel it hardest. The chart below shows a rising wedge on the GBPCHF hourly chart that broke down exactly as the bearish reading expects, and then went nowhere.
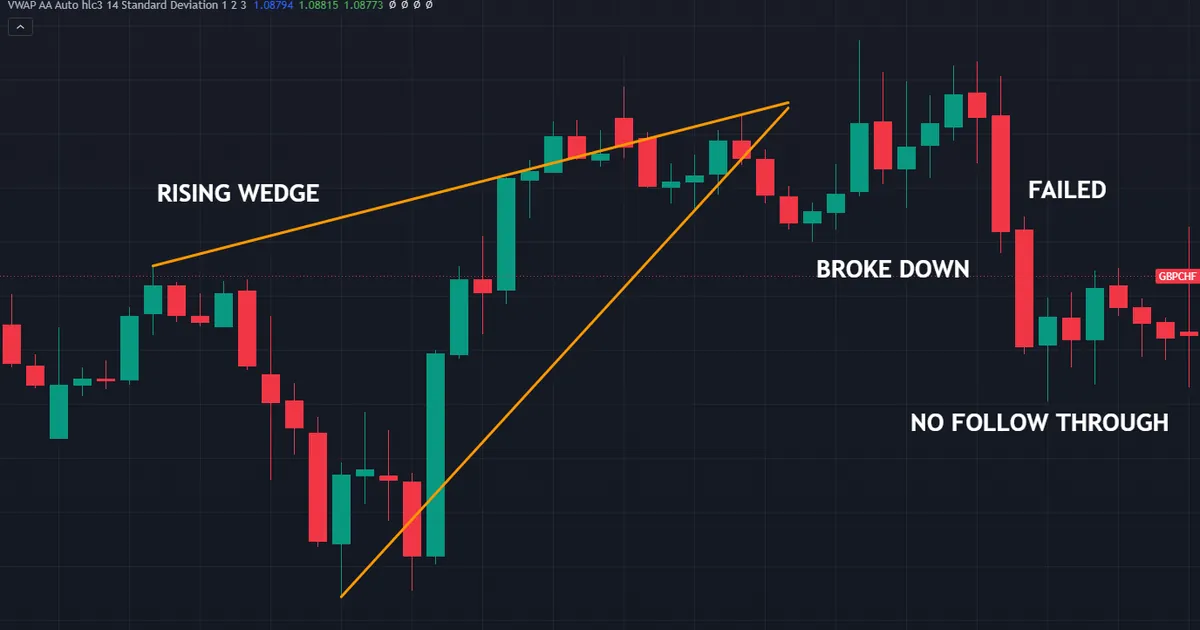
The Break Went Nowhere
Both boundaries climbed and the range narrowed, so the drawing itself was sound. Price closed below the lower line near 1.08927, which is the signal the shape is supposed to give, and then stalled and traded straight back inside.
A short taken on that close was right for a bar or two and then underwater. This is the failure mode traders underestimate: the break arrives on cue and simply does not travel.
The Structure Was Too Small
The two lines sat roughly four pips apart late in the shape. Structures that tight offer almost no room between entry and stop, so ordinary noise decides the trade.
The Larger Trend Never Agreed
A bearish shape inside a firm advance asks a lot. Check the higher timeframe before you commit, and treat any conflict as a reason to trade smaller.
News Overrode the Structure
A rate decision erases any chart shape. Check the calendar before planning a trade around a boundary that sits near a scheduled release.
Hindsight Flattered the Pattern
Scroll back through any chart and clean wedges appear everywhere. The eye picks out the tidy examples and skips the messy ones, which makes the shape look far more dependable than it is.
Real-time drawing feels nothing like that. Log every wedge you mark, including the ones you pass on, and our piece on why chart patterns fail explains what that record usually shows.
Related Shapes Worth Studying
The nastiest confusion sits between two specific shapes. Our comparison of the rising wedge and the ascending triangle turns entirely on whether the upper line stays flat or climbs.
Channels deserve a look too. A sloped channel and a wedge share the same visual feel, and only the measurement tells them apart.
Flags sit one step further along the same family. There the consolidation stays parallel and follows a sharp pole, which our note on the flag pattern meaning covers in full.
Study the failure cases with the same attention you give the textbook ones. Traders who only ever look at clean examples build expectations no live chart will meet.
Levels underpin all of it. A wedge earns attention when its boundaries land somewhere the market already cared about, so time spent on level drawing pays back faster than time spent memorising outlines.
For tooling, our pattern recognition indicators archive collects the scanners that mark these structures, and our trend indicators archive covers the tools that establish the larger direction around them.
FAQ
What is the wedge pattern meaning in simple terms?
Two converging trend lines that slope the same way. Both rise in a rising wedge and both fall in a falling wedge, and the range between them narrows as the shape develops.
How is a wedge different from a triangle?
Slope direction. A triangle has one flat boundary or two boundaries leaning from opposite directions, while a wedge has both boundaries leaning the same way.
Is a rising wedge bullish or bearish?
Conventionally bearish, because buying pressure fades even as price makes higher highs. That reading remains a convention rather than a rule, and plenty of rising wedges break upward instead.
How do I confirm a wedge break?
Wait for a close beyond the boundary on the timeframe that drew the shape. A wick through a sloped line completes nothing, and sloped lines get pierced constantly.
Where should the stop go?
Beyond the opposite boundary rather than a few pips past the line you traded. Near the apex that distance looks tiny, so size from volatility instead of from the shape.
How is the target measured?
Take the height at the widest part of the wedge and apply it from the break point. Treat the result as a projection, and book partial profit at obvious levels along the way.
Do wedge patterns work on forex charts?
They appear regularly on currency pairs across every timeframe. No chart shape offers a dependable edge on its own, so pair it with a level that already mattered, a written confirmation price and sensible sizing. Keep a log of every one you trade, because your own record teaches you more about your pairs than any general article can. Results are not guaranteed; past performance is not indicative of future results.
External references
- For background on this concept, see Rising Wedge at StockCharts ChartSchool.
- For broader market context, see Wedge at BabyPips Forexpedia.

About the author
Written by Dominic Walsh, a Forex trader and MT4/MT5 indicator, Expert Advisor and script developer. Every tool on forexmt4systems.com is tested on live charts before release and ships with ready-to-use compiled MT4 (.ex4) and MT5 (.ex5) files. Learn more about the trader and developer behind this site.
How we build, test and correct every tool: Editorial & Testing Policy. Trading carries risk; see the disclaimer.