
Two shapes with rising lows sit at opposite ends of the textbook. The rising wedge vs ascending triangle problem comes down to a single line on the chart, and most traders never check it.
That line is resistance. Flat resistance makes an ascending triangle, rising resistance makes a rising wedge, and the conventional reading flips from bullish continuation to bearish reversal on that one detail.
Rising Wedge vs Ascending Triangle: One Line Decides It
Both shapes show buyers stepping in higher each time. So the lower boundary looks almost identical in the two cases.
Look up instead. Where the highs land settles the whole argument, and nothing else on the chart comes close in importance.
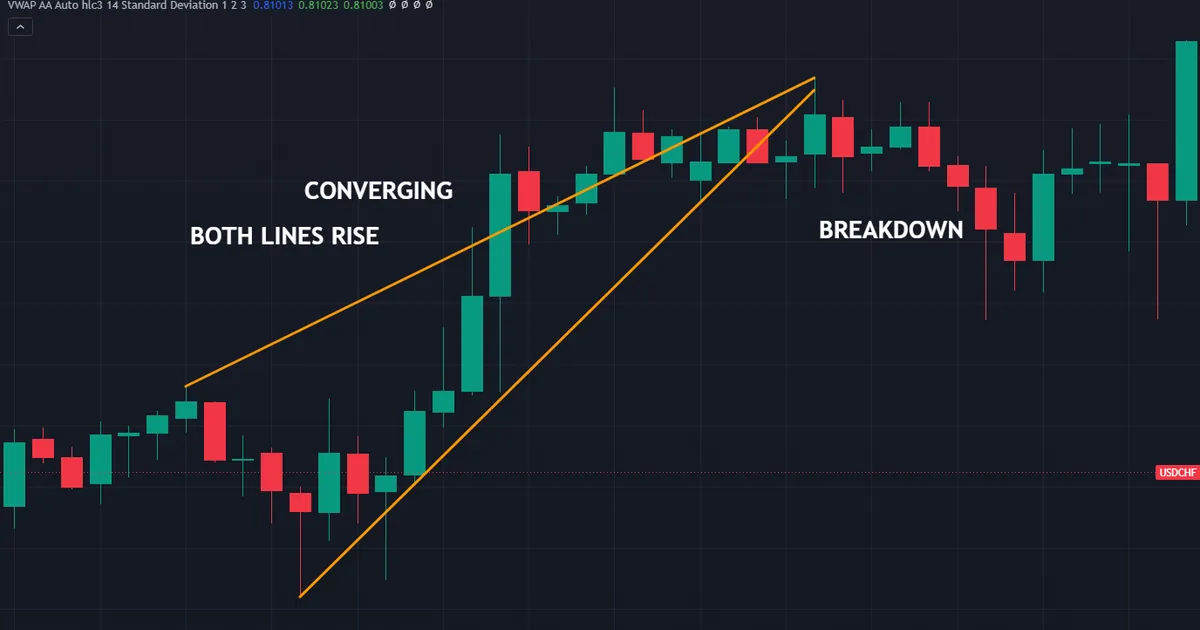
Above sits a rising wedge on USDCHF hourly bars, running from 21 to 22 July 2026. Both lines climbed and converged, with the upper edge finishing near 0.81334 and the lower edge just under it at 0.81324, before price broke down.
The Upper Line Does All the Work
An ascending triangle holds a flat ceiling. Price runs into roughly the same price several times and stops there each time.
A rising wedge has no ceiling at all. Every push makes a higher high, so the upper line slopes up along with the lows.
Because of that, the two shapes describe completely different situations. One shows sellers defending a fixed price, the other shows sellers retreating slowly.
Why the Conventional Readings Point Opposite Ways
Traders read an ascending triangle as bullish continuation. Buyers keep paying up into a fixed wall, and the wall eventually gives way.
A rising wedge reads bearish instead. Price still makes higher highs, yet each push covers less ground than the one before, so momentum fades while the chart looks strong.
Neither reading is a forecast. Both simply summarise what supply and demand already did, and both fail regularly enough that confirmation stays mandatory.
How to Draw Both Shapes Without Bias
Line placement decides the label, which makes it the place where wishful thinking creeps in. Six steps keep the drawing honest.
- Mark the swing lows first. Connect two or more lows and check that the line genuinely rises.
- Mark the swing highs next. Connect two or more highs using bar extremes, not closes.
- Measure the upper slope. A slope near zero means flat resistance; a clear upward slope means a wedge.
- Check for convergence. Both shapes narrow, so the range must be tighter at the end than at the start.
- Count the touches. Two per line is the floor; three on each side reads far better.
- Write the invalidation price down. Fix it before you think about entries, then leave it alone.
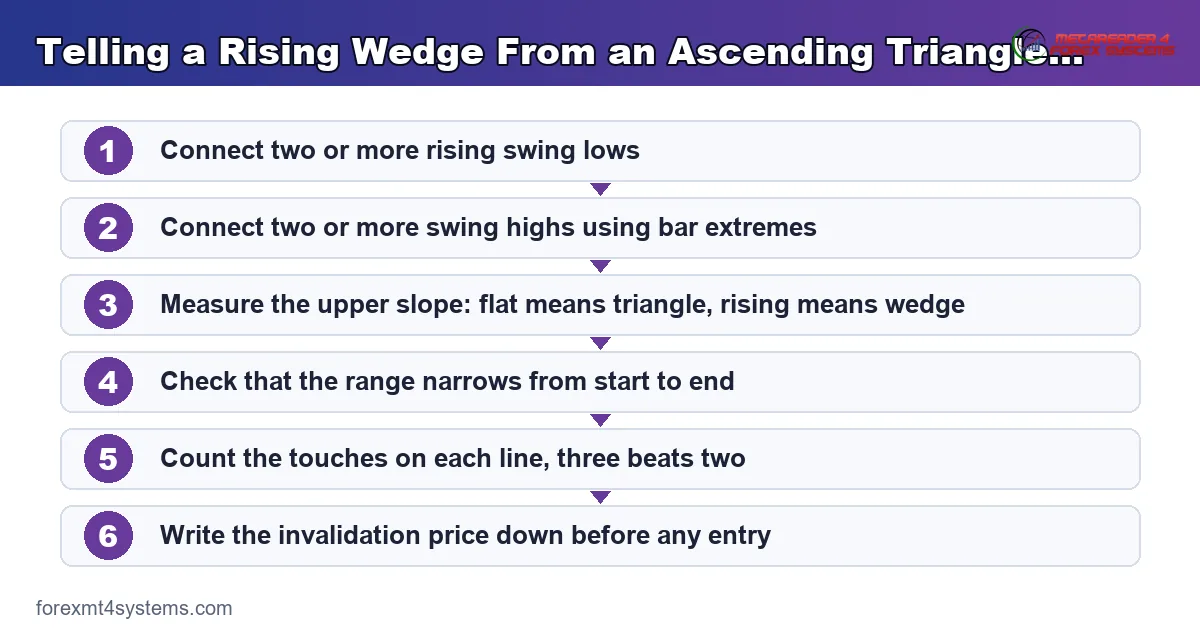
Run the steps in that order every time. Step three settles the name, and everything downstream depends on getting it right.
Anchoring the Upper Line
Sloppy anchoring turns a wedge into a triangle in seconds. Traders who want a bullish setup will happily ignore a high that sits a few points above the rest.
Use every relevant high instead. If a later high prints above an earlier one by a meaningful amount, your resistance is not flat.
Our note on how to use trend lines covers the mechanics of anchoring lines you can defend.
Anchoring the Lower Line
Rising lows appear in both shapes, so this line rarely settles anything. Draw it anyway, because it gives you the invalidation level.
Watch the angle as well. In a rising wedge the lows climb faster than the highs, which is exactly why the range narrows.
Which Timeframe Owns the Drawing
A wedge on the fifteen-minute chart can sit inside a single four-hour bar. So the same market supports both labels depending on where you look.
Choose the chart you trade, then draw only there. Flicking between timeframes until a bullish shape appears is a habit worth breaking early.
What Each Structure Shows About Order Flow
Neither shape predicts anything. Both describe an argument between buyers and sellers that already happened.
Rising Lows Into Flat Resistance
Buyers keep raising their bids while sellers hold a fixed offer. Each pullback stops higher, which means fewer sellers are willing to press the market down.
The wall itself often marks a level people remember. A round number, an old swing high, or a session extreme all serve that role.
So the structure shows patience on one side and stubbornness on the other. Nothing there says who wins, only that the space between them keeps shrinking.
Both Lines Rising, With the Lows Rising Faster
Now the sellers give ground each time. Price still reaches new highs, yet the distance gained shrinks with every push.
That fading extension is the whole point of the wedge. Buyers work harder for less, and the chart records the effort in the narrowing range.
Our explainer on wedge pattern meaning covers the same-direction-lines idea across both rising and falling versions.
Why Traders Confuse Them and Get Hurt
Both shapes look bullish while they form. Higher lows feel constructive, and higher highs feel even better.
A trader who reads a wedge as a triangle therefore buys into fading momentum. Then the break arrives on the other side, and the stop sits a long way from the entry.
That single mislabel explains most of the pain around these two shapes. Checking the upper slope takes five seconds and removes it.
The Mirror Cases Behave the Same Way
Descending triangles and falling wedges repeat this problem upside down. A descending triangle holds flat support with falling highs above it.
A falling wedge slopes both lines down while converging. Once again the flat boundary is what separates the two names.
Learn the check once and it covers all four shapes. The question never changes: does the boundary opposite the obvious slope stay flat.
Why Both Shapes Narrow at All
Convergence means volatility is falling inside the structure. Each swing covers less ground than the one before it.
Quiet stretches rarely last. Something eventually pushes price out of the wedge or the triangle, though the chart never says which way in advance.
Traders who read compression as a direction get caught over and over. Narrowing range is a statement about energy, not about who wins.
A Worked Example on the Four-Hour Chart
Numbers make the process concrete. Consider the ascending triangle on USDJPY four-hour bars between 18 and 26 June 2026.
Resistance sat flat near 161.958 while the lows climbed toward it, reaching about 161.532 by the end of the shape. Price then closed above the ceiling.
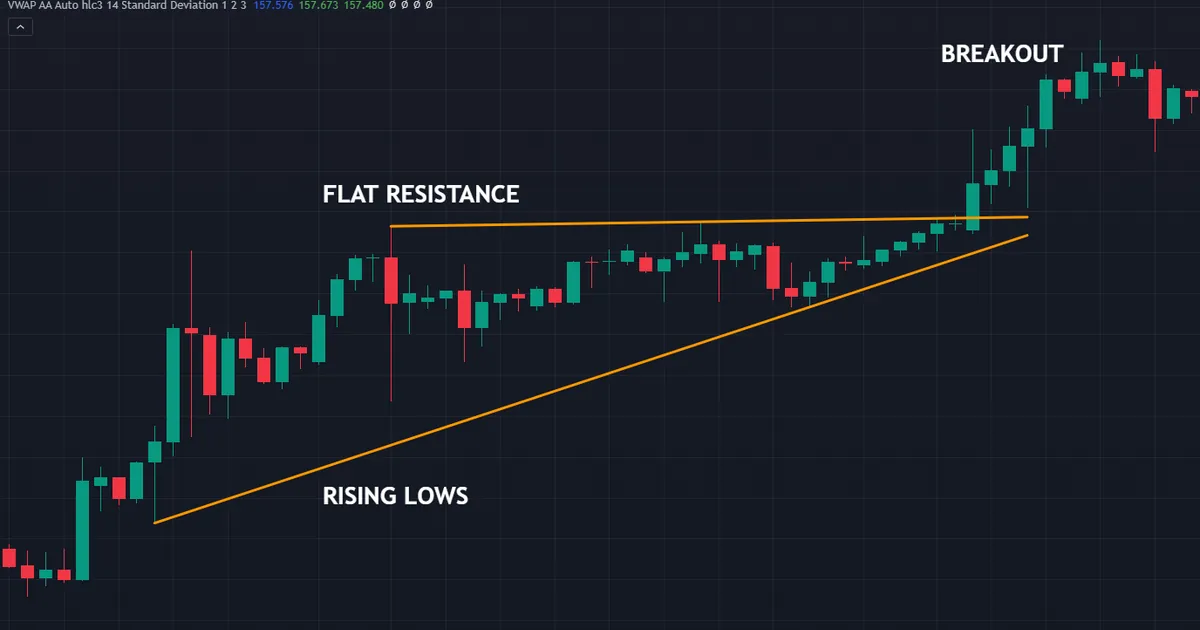
Reading the Shape Before the Break
Repeated touches of the same ceiling gave the flat line credibility. The rising lows underneath narrowed the range on every attempt.
No part of that read required an opinion about direction. The lines described the situation, and the close settled it afterwards.
Entry, Stop and Confirmation
Confirmation means a four-hour close above 161.958, not a wick through it. Traders who wait for that close accept a worse price in exchange for evidence.
A stop then sits below the most recent higher low, plus a buffer for spread. Our ATR position size calculator converts that distance into a lot size that matches your risk.
The Projection and Its Limits
The usual projection adds the height of the triangle to the break level. It gives you a rough objective and nothing firmer than that.
A measured move is a projection, never a promise. Price often stalls well short, which is precisely why partial exits exist.
Treat the number as a planning aid. Use it to decide whether the trade is worth taking, then manage what the market actually gives you.
Where Each Structure Carries the Most Weight
Location matters more than geometry. A shape that forms somewhere meaningful reads very differently from one floating in open space.
An Ascending Triangle Under a Level People Watch
The flat ceiling earns its weight from history. A round number, a prior swing high, or a weekly extreme all give the level a reason to exist.
Sellers park orders at prices they remember. So a triangle built under such a level describes a genuine queue rather than a random ceiling.
Draw your levels before the shape forms. Marking them afterwards invites you to fit the picture to the trade you already want.
A Rising Wedge Late in an Extended Move
Wedges read best after a long run. By then buyers have already paid up for hours or days, and fresh demand comes at a premium.
The narrowing extension then records genuine fatigue. Early in a move, the same shape usually just reflects a quiet stretch of the session.
So check how far price travelled before the wedge started. Context turns a drawing into an argument.
Neither Shape in the Middle of a Range
Sideways markets manufacture converging lines constantly. Highs and lows scatter enough that a patient trader can find a wedge or a triangle almost anywhere.
Those shapes carry almost no information. Without a trend or a defended level behind them, the whole premise falls away.
Scroll left before you draw. Two minutes of context saves a great deal of arguing with yourself afterwards.
Reading the Break Itself
Most of the work happens after the shape completes. The break tells you whether anyone stood behind the boundary you drew.
Close Beyond, Not Wick Through
Wicks record attempts. Closes record agreement, which is why a close beyond the defining line is the only confirmation worth the name.
Pick the timeframe that owns the drawing and use its close. Borrowing a lower timeframe close to speed things up defeats the purpose entirely.
What a Retest Adds
Price often returns to the broken boundary within a few bars. A retest that holds gives you a second, cheaper entry with a tighter stop.
A retest that fails tells you something too. Once price closes back inside the shape, the break has lost its argument and the idea is over.
Speed Off the Line
Breaks that stall immediately tend to disappoint. Breaks that travel quickly suggest orders were waiting on the other side of the boundary.
Neither observation carries a number worth quoting. Both simply help you decide whether to hold, trim, or step aside early.
Download the complete indicator database
Put these concepts on your charts. One email unlocks the full library of 1,380+ indicators with compiled MT4 and MT5 files, plus my TradingView scripts. No paywall, no spam, unsubscribe any time.
Get free access to my indicator database
One email unlocks 1,380+ free MT4, MT5 and TradingView indicators — the complete library. No single-tool download; you get the whole database.
Common Mistakes and Their Fixes
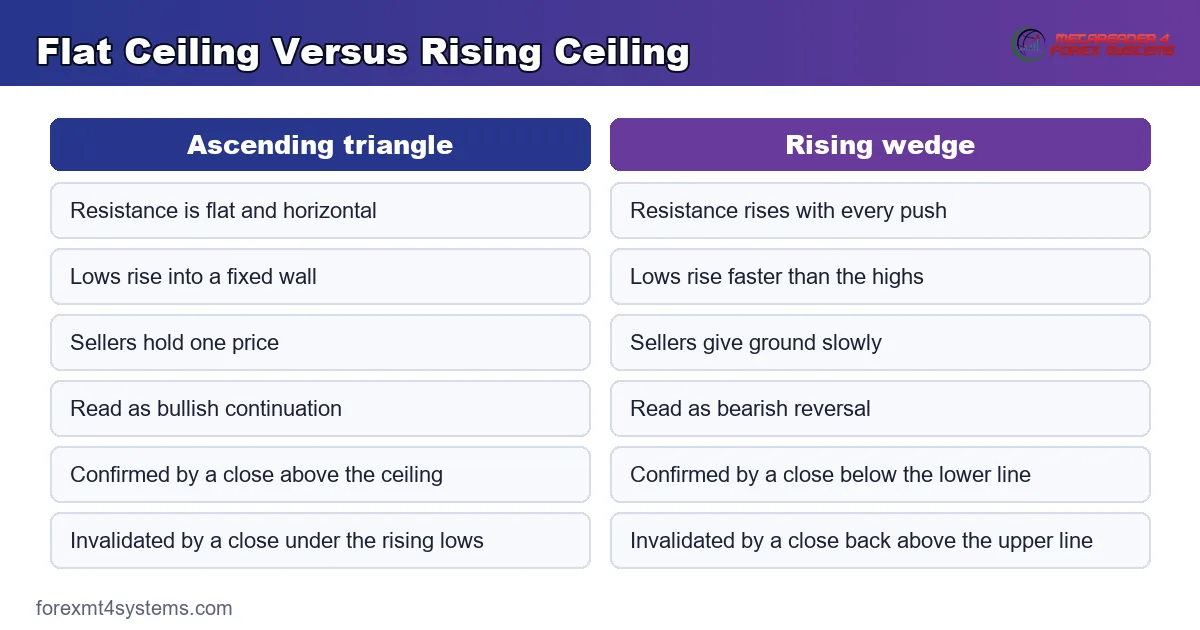
Six errors cause most of the damage with these two shapes. The panel below sets the flat ceiling and the rising ceiling side by side.
Calling Every Rising-Low Structure a Triangle
Rising lows appear in both shapes, so they settle nothing. Check the highs before you reach for a name.
Flattening a Sloping Ceiling by Eye
A ceiling that climbs a few points per swing still climbs. Draw the line properly and accept the wedge if that is what the bars show.
Trading the Touch Instead of the Close
A wick through resistance proves very little. Wait for a close beyond the line on your working timeframe, then act on that evidence.
Ignoring Where the Shape Formed
A shape in mid-range carries far less weight than one built at a level people already defended. Mark your levels first, then look for structure near them.
Assuming the Wedge Must Break Down
Rising wedges break upward often enough to hurt. Our capstone on why chart patterns fail collects the reasons in one place.
Sizing From Habit Rather Than From the Stop
A tight wedge and a wide triangle produce very different stop distances. Fixed lot sizes therefore hand you wildly different exposure without any decision on your part.
Quick Reference: Wedge or Triangle
Keep this table beside the chart until the check becomes automatic. The first two rows do most of the sorting.
| Check | Ascending triangle | Rising wedge |
|---|---|---|
| Upper boundary | Flat, horizontal | Rising |
| Lower boundary | Rising | Rising, and steeper than the upper line |
| Do the lines converge | Yes | Yes |
| What the highs show | Sellers holding one price | Sellers giving ground slowly |
| What the range does | Narrows toward the ceiling | Narrows as extension fades |
| Conventional reading | Bullish continuation | Bearish reversal |
| Confirmation | Close above the flat ceiling | Close below the lower line |
| Invalidation | Close back under the rising lows | Close back above the upper line |
Work down the rows in order. Row one settles the name, and the rest settle the trade.
Turning the Check Into a Written Rule
A shape you label by feel will drift with your mood. Writing the test down converts a fuzzy impression into a plain yes or no.
Define Flat in Advance
Perfectly horizontal resistance almost never appears. Pick a tolerance now, such as a ceiling whose swings stay within a tenth of the shape’s height.
Any sensible threshold works. Applying the same one every week matters far more than the exact figure you choose.
Write the Confirmation Rule Once
Confirmation means a close beyond the defining boundary. Put that sentence in your plan, then stop renegotiating it while a trade is open.
Some traders add a retest condition on top. Either version works, provided the choice happens before the shape appears on your screen.
Log Both Labels, Not Only the Winners
Screenshot every wedge and every triangle you mark, along with what followed. Thirty entries later, your own record teaches you more than any article.
Sort the log by label and by location. Patterns in your own results surface quickly once the sample grows past a handful.
When the Structure Does Not Follow Through
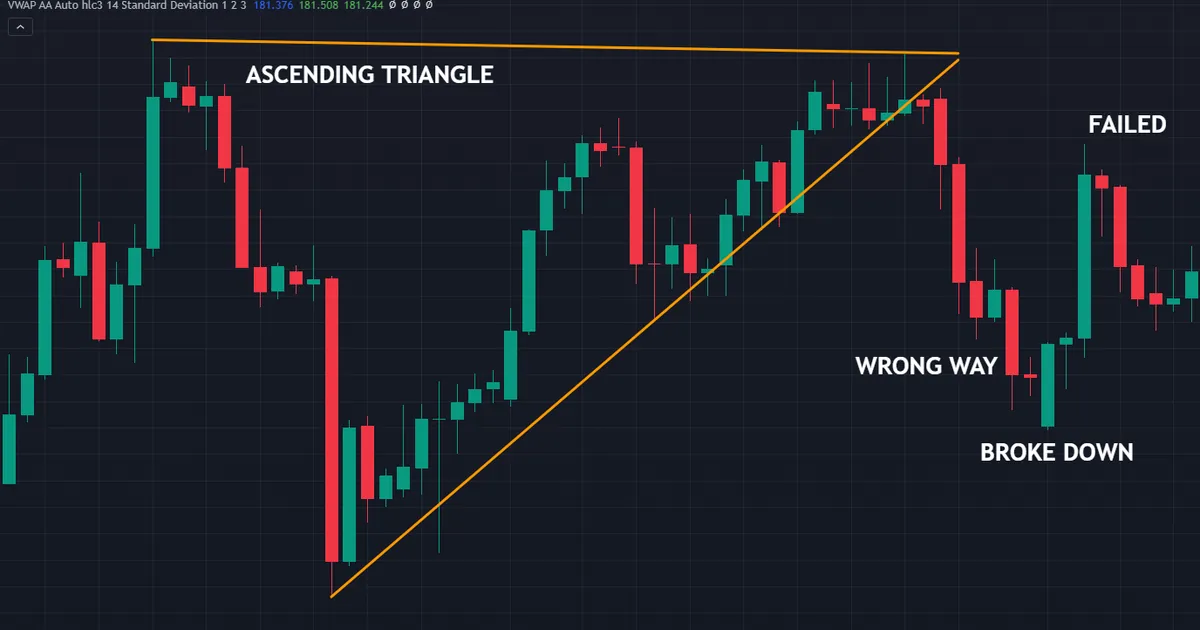
Failures teach more than tidy examples. Below sits an ascending triangle on EURJPY four-hour bars, running from 30 June to 9 July 2026, that broke the wrong way.
What Actually Happened
Flat resistance sat near 185.818 with rising lows underneath, exactly as the textbook describes. Price then broke down through the rising support line around 185.616 instead of clearing the ceiling.
Nothing about the drawing was wrong. The lines were defensible, the touches were real, and the conventional reading still failed.
Why That Outcome Is Normal
A shape summarises orders that already traded. Fresh orders arrive afterwards, and they owe nothing to the picture on your screen.
Buyers who kept bidding higher may simply have finished. Sellers may have waited for the third touch before pressing. The chart never shows either decision in advance.
How to Trade Around That Reality
Define invalidation before entry, then size so a loss feels dull. A break that fails should cost you a shrug rather than a bad month.
Treat the rising lows as your line in the sand. Once price closes below them, the bullish reading has gone regardless of how good the ceiling looked.
What a Failed Shape Still Gives You
A broken structure leaves useful information behind. The boundary that failed becomes a level worth watching from the other side.
Traders who flipped with the EURJPY break had a clear reference above them. That is often the most valuable thing a failed pattern hands over.
Failure Versus Mistake
A shape that fails is not the same as a bad decision. You can draw the lines properly, wait for the close, size sensibly, and still lose.
Judge the process rather than any single outcome. Only a run of thirty or forty entries says anything useful about your rules.
Keep the screenshots either way. A cluster of failures usually shows the slopes drifting long before the losses arrive.
Related Guides Worth Reading Next
These two shapes belong to a wider family of converging structures. A few neighbouring guides finish the picture.
Start with our overview of triangle pattern types for the ascending, descending and symmetrical variants side by side. Then read our how-to on the falling wedge pattern, which mirrors everything here at a low.
Traders who want the levels marked automatically can browse our support and resistance indicators archive. Any such tool works as a spotter, though, and the drawing decisions stay yours.
Automated pattern tools deserve one warning. They apply a fixed tolerance to every chart, so they will happily label a wedge as a triangle whenever the slope sits near their threshold.
Use the alert to look, never to trade. Open the chart, draw the two lines yourself, and check the upper slope before you accept the machine’s answer.
The same caution applies to screenshots shared online. A shape someone else labelled may not survive your own tolerance test, and their entry rules almost certainly differ from yours.
FAQ
What is the difference between a rising wedge and an ascending triangle?
The resistance line. An ascending triangle has flat, horizontal resistance with rising lows beneath it. A rising wedge has resistance that rises too, with the lows climbing faster so the range narrows. That single difference flips the conventional reading from bullish continuation to bearish reversal.
Do both shapes have to converge?
Yes. Convergence is what makes either one a pattern rather than a channel. If the two lines stay the same distance apart while both rise, you are looking at a rising channel instead, and the whole squeeze argument disappears.
Can a rising wedge break upward?
Often. The bearish reading is a convention, not a rule, and plenty of wedges resolve in the direction of the prior trend. That is exactly why confirmation on a close and a defined invalidation level matter more than the label itself.
How many touches does each line need?
Two is the minimum for a line to exist at all, and three reads far better. Fewer touches means you drew a guess. More touches on the flat ceiling of an ascending triangle also tell you the level genuinely matters to other participants.
Which timeframes suit these shapes best?
Both appear on every timeframe, from one minute to weekly. Higher timeframes produce fewer shapes with cleaner lines, while lower ones produce many more with far more noise. Pick the chart you actually trade and draw there consistently.
Does the flat ceiling need to be perfectly level?
No, and it almost never is. Real resistance wanders by a few points from touch to touch, especially on lower timeframes and volatile pairs. Set a tolerance in advance, such as swings staying within roughly a tenth of the shape’s height, and apply that same test every time rather than judging by eye.
What invalidates each structure?
An ascending triangle loses its argument when price closes back below the rising lows, because the buyers who kept paying up have stopped. A rising wedge loses its bearish argument when price closes back above the upper line with room to spare. Write both levels down before you enter, then let the chart make the decision instead of your nerves.
How reliable are these patterns?
No honest figure exists. Published testing of classical chart shapes has produced modest and inconsistent findings once transaction costs and drawing choices enter the picture, and results shift with the market, the period and the exact rules used. Treat both structures as a way to frame a level, a stop and a size, then let the close beyond the boundary do the deciding. Results are not guaranteed; past performance is not indicative of future results.
External references
- For background on this concept, see Ascending Triangle at Investopedia.
- For broader market context, see Rising Wedge at BabyPips Forexpedia.

About the author
Written by Dominic Walsh, a Forex trader and MT4/MT5 indicator, Expert Advisor and script developer. Every tool on forexmt4systems.com is tested on live charts before release and ships with ready-to-use compiled MT4 (.ex4) and MT5 (.ex5) files. Learn more about the trader and developer behind this site.
How we build, test and correct every tool: Editorial & Testing Policy. Trading carries risk; see the disclaimer.