
The harami candlestick pattern describes a market that just stopped expanding. A big body prints, then a small body sits entirely inside it, and the argument that drove the previous session runs out of fuel.
Traders often meet the harami candlestick pattern right after learning the engulfing pattern, and the two get confused constantly. They are mirror images of each other, so this guide leans on that contrast to make the shape stick.
What the Harami Candlestick Pattern Actually Shows
Harami comes from Japanese, where the word means pregnant. The large first bar plays the mother, and the small second bar plays the child inside her.
That image does real work. It tells you the second body sat entirely inside the body the first session left behind.
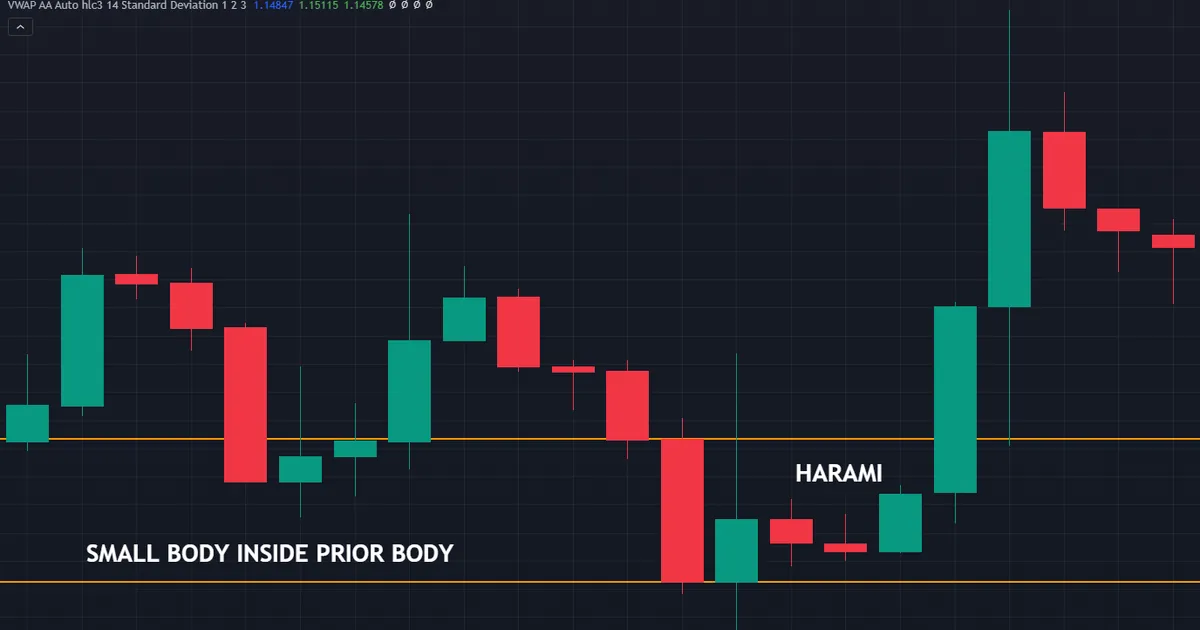
So the message is contraction. One session swept a wide range; the next barely moved, and neither side pressed the advantage.
Nothing here forecasts a reversal on its own. This shape reports a pause, and a pause only matters where a pause would matter.
Exact Geometry of the Two Bars
Every candle carries four numbers: open, high, low and close. Its body spans open to close, while the wicks run out to the extremes.
Mother Bar: the Large First Body
Your first bar needs a large body relative to its neighbours. A wide range with a tiny body does not qualify, because the pattern reads bodies rather than ranges.
Direction matters too. In a bullish harami the mother bar closes down; in a bearish harami it closes up.
So the mother bar always runs with the move that preceded it. It represents the last strong push before the pause.
Child Bar: the Small Second Body
Your second bar opens and closes within the mother’s body. Both ends of that small body must land inside the larger one.
Colour of the child bar varies by convention. Classic Japanese sources expect the opposite colour to the mother, while many modern screeners accept either.
Size matters more than colour. A child body barely smaller than the mother says almost nothing, whereas a very small one shows a real collapse in range.
Bodies or Full Ranges: Pick One Rule
Traditional definitions compare bodies and let the wicks fall where they may. Under that rule, the child bar can print a high above the mother’s high and still count.
A stricter version asks for the child’s whole range to sit inside the mother’s body. Far fewer bars pass that test, so your sample shrinks quickly.
Neither rule outranks the other. Write your choice into your plan, then apply it the same way on every chart so your notes stay comparable.
Bullish and Bearish Versions
A bullish harami appears after a decline: a large down body, then a small body inside it. Sellers had the run of the market, then suddenly stopped covering ground.
A bearish harami mirrors that after an advance. Buyers pushed hard, then the next session shrank to a fraction of the range.
Both versions describe the same event in opposite directions. Momentum faded, and the market paused to think.
Where the Name Comes From
Candlestick charting grew out of Japanese rice trading, and much of the vocabulary travelled with it. Steve Nison introduced the technique to Western traders in the early 1990s, which is when these names entered common use.
Harami kept its original word rather than picking up an English label. That quirk helps, since the picture of a mother and child explains the geometry in one glance.
Some older texts add extra conditions, such as opposite colours or a gap between the closes. Modern screeners tend to drop those, so check what your tool means by the word.
How to Spot a Harami, Step by Step
Screeners flag these bars in bulk, and most of the flags mean nothing. Work through the sequence yourself instead.
- Find the move first. Look for a run of bars heading one way, since a pause only means something after a push.
- Mark the mother bar. Identify a large body that runs with that move and closes near its extreme.
- Check the next open. The following session must open inside the mother’s body, not beyond it.
- Wait for the close. That close must also land inside the mother’s body for the shape to hold.
- Measure the shrink. Compare the two body sizes, because a dramatic contraction carries more information than a mild one.
- Check the location. Ask what level, swing or trend line sits underneath the pair before you read anything into it.
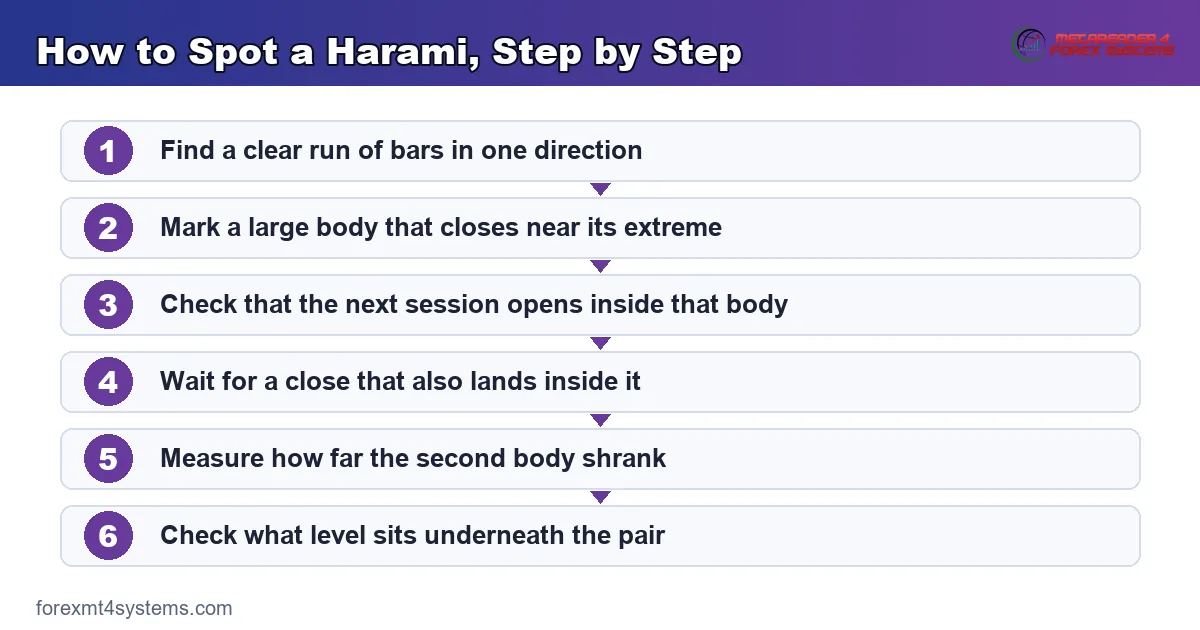
So the pattern completes at the second close, never before. A child bar can drift outside the mother’s body in the final minutes and cancel the whole shape.
Because the second bar is small, it usually forms quickly and quietly. Set an alert on the mother bar’s extremes rather than watching every tick.
Harami Versus Engulfing: The Deliberate Contrast
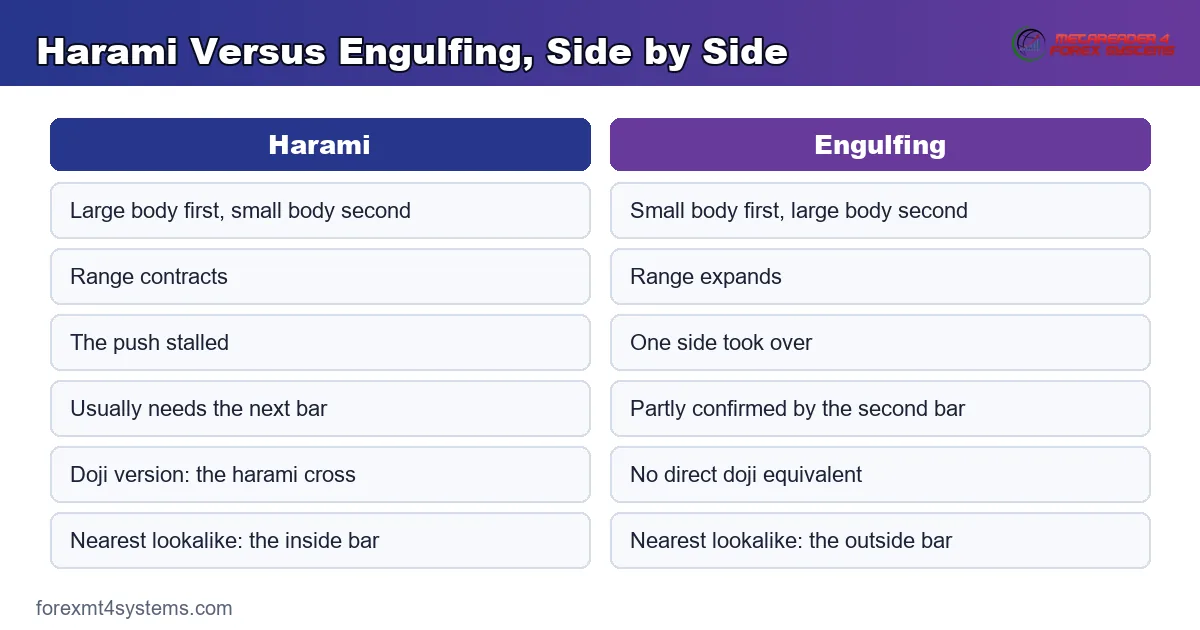
Learn these two together and both become easier. They use the same two ingredients in the opposite order.
Same Two Bodies, Reversed Order
An engulfing pattern puts the small body first and the large body second. A harami puts the large body first and the small body second.
Swap the order and the meaning flips completely. One shape describes expansion; the other describes contraction.
Our page on engulfing candle meaning covers the expansion case in detail, and reading the two side by side fixes the difference quickly.
Expansion Against Contraction
An engulfing bar shows one side taking ground the other side held minutes earlier. Effort went up, and the range went with it.
A harami shows effort dropping away. Nobody took new ground, and the range collapsed instead.
So an engulfing pair reports a takeover. A harami reports a stall, which is a quieter and less committed message.
What Each Says About Momentum
Momentum traders read the engulfing bar as a burst and the harami as a brake. Neither reading predicts the next bar.
Still, the practical difference matters. After an engulfing bar you already hold a direction; after a harami you hold only a pause.
That is why many traders treat the harami as a warning rather than a signal. It flags a market that stopped doing what it was doing.
When Both Shapes Turn Up Together
Sequences happen. A harami forms, then the following session engulfs the whole pair, which turns a quiet pause into an active takeover.
Read that combination as one story rather than two signals. Momentum stalled first, then the other side stepped in and took the ground.
The opposite order also appears. An engulfing bar followed by a harami says the takeover itself ran out of steam, so both shapes lose some of their force.
The Harami Cross
One variant deserves its own name. When the child bar turns into a doji, traders call the shape a harami cross.
When the Second Bar Becomes a Doji
A doji opens and closes at effectively the same price, so its body shrinks to a line. Drop that into a harami and the contraction becomes extreme.
The session went nowhere at all. Buyers and sellers both showed up, and neither finished ahead.
Our note on doji candle meaning unpacks the variants, since a long-legged doji tells a different story from a tiny one.
Why the Cross Reads Differently
A standard harami still shows a small directional body. The cross removes even that, so the pause looks cleaner.
Many traders therefore treat the cross as the stronger version of the same message. Frame that as a convention among traders rather than a measured fact.
Either way, the next bar carries the weight. A doji followed by a strong close in one direction says far more than the doji alone.
Reading a Harami Across Timeframes
Timeframe changes what a contraction means. Same shape, very different information.
On the Daily Chart
A daily harami says one whole session failed to extend the previous day’s range. That covers three trading centres and a full news cycle, so the stall carries genuine weight.
Daily bars also print far fewer of these shapes. Scarcity helps, because you can actually review every occurrence rather than drowning in them.
So most swing traders work from daily or four-hour bars here. The pattern still needs a level underneath it, but the sample stays manageable.
On Intraday Charts
Drop to fifteen-minute bars and haramis appear constantly. Ordinary lulls between sessions produce the same geometry without any change in conviction.
Filter hard at this speed. Require a clear prior run, a genuine level, and a mother bar that stands out against the last twenty bars.
Otherwise the shape becomes noise. Intraday charts reward location far more than they reward pattern spotting.
Nesting the Two Together
A useful habit pairs the timeframes. Find the level on the higher chart, then look for the contraction on the lower one.
That approach borrows structure from the slower chart and timing from the faster one. It also keeps you from reading a fifteen-minute pause as a daily turn.
A Worked Example at a Level
Location turns this shape from a curiosity into information. The chart below boxes off the mother body, and the scene underneath adds a level to it.
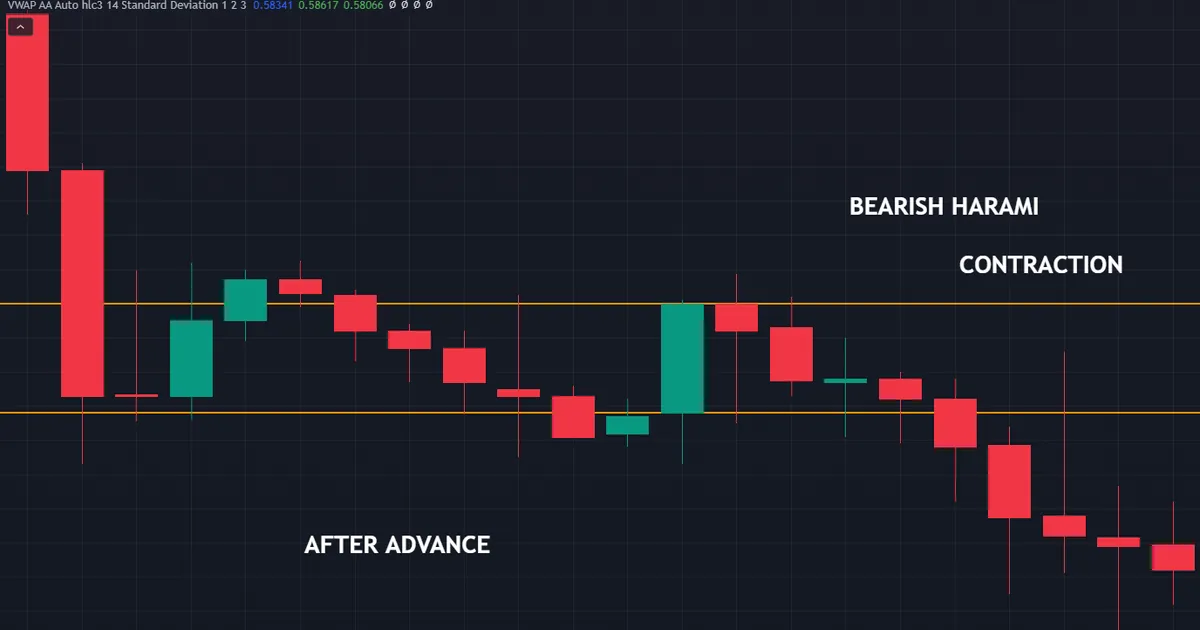
Setting the Scene
Price runs down into an old range low that held twice before. The final push prints a wide down body that closes near the session low.
Next session, the market opens inside that body and stays there. The close lands inside as well, leaving a small body wrapped by the previous one.
That combination says the sellers who dominated yesterday did not turn up today. Because the level already mattered, the stall carries a little more weight.
Building the Trade Around It
The pattern alone gives you no entry. Most traders wait for a close above the mother bar’s high, which turns the pause into an actual move.
The stop then goes below the pair’s combined low. That distance sets the position size, not the other way round.
Run the numbers through our position size calculator before you commit. A wide mother bar can push the stop further than the setup deserves.
Reading the Range Around It
Compare the mother bar against the average range for the pair and timeframe. A mother bar twice the normal size makes any child bar look tiny by comparison.
That check keeps you honest. Our guide to ATR in trading shows how to measure a normal range before you judge a contraction.
So measure first, then label. The eye exaggerates contrast, and a quick average keeps the reading grounded.
Download the complete indicator database
Put these concepts on your charts. One email unlocks the full library of 1,380+ indicators with compiled MT4 and MT5 files, plus my TradingView scripts. No paywall, no spam, unsubscribe any time.
Get free access to my indicator database
One email unlocks 1,380+ free MT4, MT5 and TradingView indicators — the complete library. No single-tool download; you get the whole database.
Where the Harami Actually Matters
Context decides everything here. A pause in open space describes ordinary quiet; a pause at a level describes hesitation somewhere meaningful.
At a Tested Level
Support and resistance give the shape a reason to exist. A market that stops expanding exactly where it stopped twice before tells you something about the orders sitting there.
Our guide to candlestick patterns at support and resistance walks through that logic in full. The short version: mark the level first, then look for the candle.
Without a level, you have a small bar after a big one. Markets produce that combination constantly.
Inside a Trend Pullback
Trend traders use the harami as a timing tool. A pullback runs, momentum fades, and the small body marks the moment the pullback stopped working.
That reading asks less of the pattern. The trend supplies the direction, and the candle only supplies the timing.
So a harami against the trend deserves far more caution than one that lines up with it.
After an Extended Run
Here the shape gets over-read. A pause after a long move might mark exhaustion, or it might mark a rest before another leg.
Wait for the next bar in this situation. A close back through the mother bar’s far end converts the pause into evidence.
Beside Session Timing
Forex trades around the clock, so a daily bar bundles Asia, London and New York together. A contraction built entirely in quiet hours means less than one built across the busy overlap.
Check which session produced the small bar. One glance at a lower timeframe usually answers it.
So treat a thin-session harami as weak evidence. The range shrank because fewer people traded, not because anybody changed their mind.
Common Mistakes, and How to Fix Them
The harami attracts a specific set of errors. Each one has a short correction.
Reading a Harami With No Prior Move
A pause needs something to pause. The fix: require a visible run of bars in one direction before the mother bar, or skip the setup entirely.
Confusing It With an Inside Bar
An inside bar compares full ranges; a harami compares bodies. The fix: read our note on inside bar meaning and keep the two definitions separate in your notes.
Treating the Pattern as an Entry
The shape marks a stall, not a turn. The fix: wait for a close beyond the mother bar before you act, and treat the pattern as a reason to watch.
Accepting a Barely Smaller Child Bar
A child body at ninety percent of the mother says nothing useful. The fix: set a maximum ratio, such as half the mother’s body, and hold yourself to it.
Ignoring the Mother Bar’s Size
A huge mother bar creates a wide stop. The fix: convert the invalidation level into position size before you judge whether the trade fits your plan.
Hunting Them on Very Low Timeframes
One-minute charts print haramis endlessly. The fix: trade the timeframe your plan uses, and let the higher timeframe supply the level.
Quick Reference Checklist
Run this list before you label anything a harami. Seven answers cover it.
- Does a clear run of bars sit ahead of the mother bar?
- Is the mother body large against its recent neighbours?
- Do both ends of the child body land inside the mother body?
- Which rule are you using: bodies only, or the full range?
- How small is the child body as a fraction of the mother?
- Did the child bar close, or does it still have time to escape?
- What level, trend or swing sits underneath the pair?
Side-by-Side Summary
| Feature | Harami | Engulfing |
|---|---|---|
| Order of bodies | Large first, small second | Small first, large second |
| Range behaviour | Contraction | Expansion |
| Core message | The push stalled | One side took over |
| Confirmation | Usually needed from the next bar | Partly built into the second bar |
| Doji variant | Harami cross | No direct equivalent |
| Nearest lookalike | Inside bar | Outside bar |
When the Harami Fails
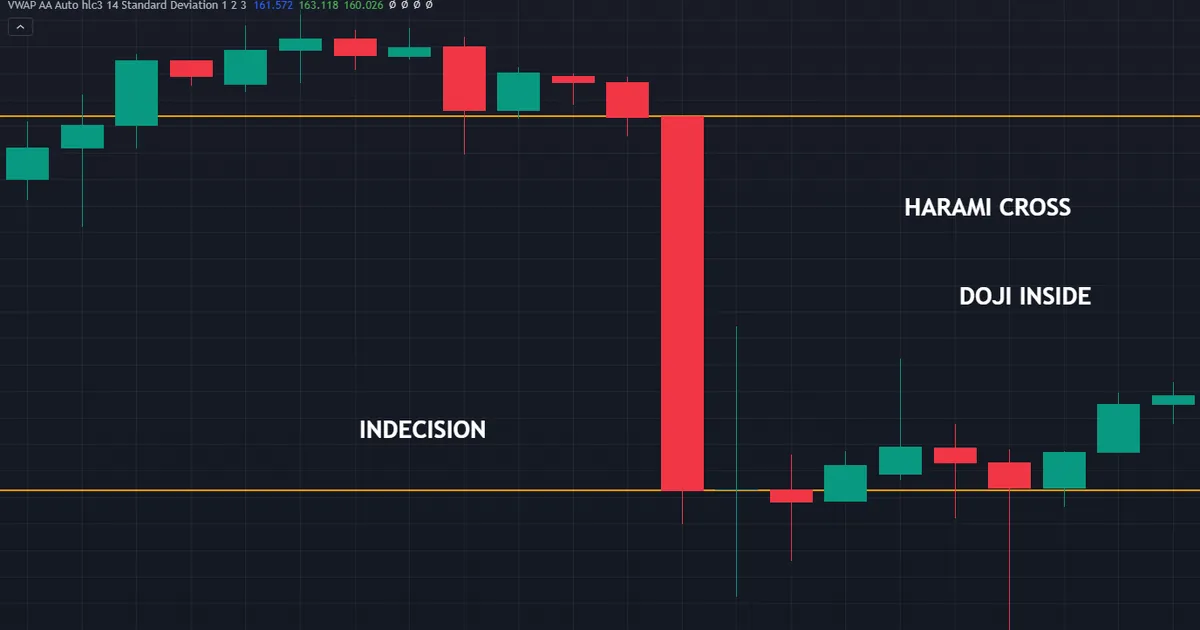
Failures teach the shape faster than successes do. The chart below shows a textbook harami that led nowhere.
The Trend Simply Resumes
A pause is only a pause. Very often the next bar reopens in the original direction and carries straight on, leaving the harami as a footnote.
The Child Bar Escapes Late
A shape that looked perfect an hour before the close can break out of the mother’s body at the last moment. Only the closing print counts.
Quiet Sessions Fake the Contraction
Holiday sessions and thin hours shrink every bar. A small body during a quiet period reflects the clock rather than a change in conviction.
The Level Underneath Gives Way
Sometimes the stall happens at a level that then breaks anyway. The pattern described real hesitation, and the market simply pushed through it.
Screeners Flood You With Them
Automated scans return dozens of haramis a day across a watchlist. Most sit in open space, so filter by location before you look at a single chart.
The Definition Silently Changes
Two tools can disagree about the same pair of bars, because one reads bodies and the other reads full ranges. Check the setting in your scanner, then match it to the rule you wrote down.
Related Concepts to Study Next
A harami makes most sense beside its neighbours. Two short detours finish the picture.
Browse the wider candlestick indicators library for tools that mark these shapes automatically, then look through the pattern recognition indicators collection for scanners that cover the whole family.
After that, practise on your own charts. Mark twenty haramis, note what came next, and your record will teach you more than any general claim about the pattern.
Keep the notes plain and factual. Record the pair, the timeframe, the level underneath, the size ratio between the two bodies, and what price did over the following five bars.
Patterns from your own market, on your own timeframe, carry far more meaning than a textbook illustration. Because the sample belongs to you, the conclusions actually apply to your trading.
FAQ
What does the harami candlestick pattern mean?
It describes contraction after expansion. A large body prints, then a small body forms entirely within it, which shows the previous session’s momentum fading. The name comes from the Japanese word for pregnant, since the small bar sits inside the larger one like a child.
Is a harami bullish or bearish?
Both versions exist. A bullish harami follows a decline and starts with a large down body; a bearish harami follows an advance and starts with a large up body. The direction of the mother bar and the move before it tell you which version you have.
What is a harami cross?
A harami cross replaces the small child body with a doji, so the second session opens and closes at effectively the same price. Traders generally treat that version as the cleaner expression of the same idea, because the contraction goes all the way to zero.
How does a harami differ from an inside bar?
An inside bar compares the full high-to-low ranges of two bars. A harami compares bodies, so the child bar may print a wick outside the mother’s range under the traditional rule. Many bars qualify as one and not the other, which is why definitions matter.
Do I enter as soon as the harami completes?
Most traders do not. The shape marks a stall rather than a turn, so a common approach waits for a close beyond the mother bar’s far end. That extra bar costs you some of the move and buys you evidence that the pause turned into something.
How small should the second body be?
No fixed threshold exists in the classic texts, so traders pick their own. A common working rule caps the child body at roughly half the mother’s body, and the harami cross takes that idea to its limit. Choose a number, write it down, and keep it steady so your review notes stay comparable.
Does the harami pattern work in forex?
It appears on forex charts as readily as anywhere else, since the shape only needs two bars. Remember that it describes what already happened rather than what comes next, and that location, risk and exits still do the heavy lifting. Results are not guaranteed; past performance is not indicative of future results.
External references
- For background on this concept, see Harami (Candlestick Pattern) on Wikipedia.
- For broader market context, see Bullish Harami at Investopedia.

About the author
Written by Dominic Walsh, a Forex trader and MT4/MT5 indicator, Expert Advisor and script developer. Every tool on forexmt4systems.com is tested on live charts before release and ships with ready-to-use compiled MT4 (.ex4) and MT5 (.ex5) files. Learn more about the trader and developer behind this site.
How we build, test and correct every tool: Editorial & Testing Policy. Trading carries risk; see the disclaimer.