
Doji candle meaning starts with one geometric fact. The open and the close finish at effectively the same price, so the body shrinks to a thin line.
Everything else about that bar sits in its wicks. They record how far price travelled during the session before it came back to where it began.
So the bar describes a standoff. It does not forecast the next session, and this guide keeps repeating that point because most articles quietly drop it.
Doji Candle Meaning: The Exact Anatomy
Every candle holds four numbers: open, high, low and close. The body spans the first and last of those, while the wicks stretch from the body out to the extremes.
A doji collapses the body distance to nearly zero. Its remaining shape depends entirely on how the two wicks divide the session’s range.

Notice what that definition leaves out. It says nothing about direction, nothing about the wider trend, and nothing about what follows.
Body, Wicks and the Close
Traders call the body the real body, and the wicks go by shadows or tails. A bullish body closes above its open; a bearish body closes below.
A doji sits between those two states. Neither side won the session, so the colour of the bar carries almost no information.
Because of that, the wicks do all the talking. A long lower shadow records buyers pushing back, and a long upper shadow records sellers doing the same.
How Close Counts as Equal
Charting software rarely demands a perfect match. Most working definitions accept a body worth a few percent of the bar’s total range.
Pick a threshold and write it down. Under a five percent rule, a bar with a hundred pip range may show a five pip body and still qualify.
Then apply that rule everywhere. Traders who eyeball the shape find dojis on every chart, which drains the term of any meaning at all.
Why Timeframe Changes the Count
A daily doji summarises twenty-four hours of two-way trade. A one-minute doji summarises sixty seconds, and frequently nothing more than a quiet spread.
So treat the fastest charts with suspicion. The higher the timeframe, the more participants had to agree on that closing price.
Many traders simply set a floor. Below the fifteen-minute chart they log the bar and act on nothing.
Our guide to multi-timeframe analysis shows how to check a candle against a slower chart. One glance upward settles most arguments.
What the Bar Refuses to Tell You
Order flow stays hidden behind the four prices. A doji cannot show you who traded, in what size, or why they stopped.
Two very different sessions can print the identical shape. One might reflect a genuine battle at a level, and the other a holiday afternoon with nobody at the desk.
So volume and session context matter alongside the geometry. Neither appears in the candle itself, which forces you to fetch them separately.
The Four Doji Variants Worth Knowing
One shape splits into several names, and the wick distribution decides which name applies. Work through the list below in order.
- Neutral doji. Short wicks on both sides with the body in the middle. A quiet session that covered very little ground.
- Long-legged doji. Long wicks above and below, body near the centre. A wide, volatile session that resolved nothing at all.
- Dragonfly doji. A long lower wick, no meaningful upper wick, and the body pinned at the top of the range.
- Gravestone doji. A long upper wick, no meaningful lower wick, and the body pinned at the bottom of the range.
- Four-price doji. Open, high, low and close all at one level, so the bar renders as a bare horizontal dash.
Only the middle three turn up often enough to matter on liquid pairs. Study those and you cover almost every doji you will meet.
Long-Legged Doji
This variant shows the widest disagreement of the group. Price ran well above and well below the open, then settled back at the starting point.
So the session burned energy and produced nothing. On a daily chart the shape frequently follows a strong run, when a trend meets its first real supply.
Dragonfly Doji
Sellers drove price lower through the session, then buyers reclaimed the whole move before the close. The result leaves a long tail hanging below a flat body.
That shape overlaps heavily with a hammer. A dragonfly simply applies a stricter rule: the body must vanish, not merely stay small.
Read it as a rejection of lower prices during that one session. Whether the rejection holds depends on the level where it happened.
Gravestone Doji
Flip the dragonfly and you get the gravestone. Buyers pushed price up, sellers returned it to the open, and a long upper shadow marks the failed advance.
Its cousin among ordinary candles is the shooting star. Again the doji version demands a body of essentially nothing.
Four-Price Doji
This one appears mostly on illiquid instruments or dead sessions. A single price for all four values usually signals thin data rather than a market decision.
Treat it as noise on a major pair. Holiday sessions and the hour around the daily rollover produce most of them.
Naming the Variant Before You Judge It
Name the shape first, then decide what it might mean. Traders who reverse that order tend to see whichever variant suits their existing bias.
A simple habit fixes this. Measure the upper wick and the lower wick, compare them, and only then reach for a label.
Where the Doji Comes From
Candlestick charting grew out of Japanese rice trading, and traders associate its early development with Munehisa Homma. Much of the Homma legend remains unverified, so the sensible line stops at the attribution itself.
Steve Nison gets the credit for bringing the technique to Western traders in the early 1990s. His books gave the shapes the English names traders still use today.
Why the History Matters
The vocabulary arrived from a market with daily bars and genuine overnight gaps. Continuous forex behaves differently, which quietly changes several classic definitions.
Keep that difference in mind as you read older material. A pattern that leaned on a gap in rice or equities often shows up without one on a currency chart.
What a Doji Actually Tells You
Here the honest answer disappoints many readers. The bar reports indecision for one session, and that report expires quickly.
Academic testing of standalone candlestick signals has generally struggled to find a consistent edge once costs enter the sum. Results shift with the market, the period and the exact definition used.
None of that renders the bar useless. It simply moves the bar out of the trigger role and into the context role.
Indecision, and Nothing More
The candle tells you buyers and sellers finished level. It does not name the winner of the next session.
So resist the phrase “reversal signal”. A doji after a long decline shows selling pressure pausing, which makes a far smaller claim.
That smaller claim still earns its place. Knowing that pressure paused at a specific price gives you something concrete to plan around.
Why Location Decides Everything
Ten dojis in the middle of a range mean almost nothing. One doji at a level buyers defended twice already means considerably more.
Because the bar only measures balance, it needs a reason for that balance to matter. Support, resistance, a prior swing or a session extreme each supply one.
Our guide to support and resistance covers how to mark those levels before the candle arrives. Draw first, then read.
Confirmation Comes From the Next Bars
A doji leaves exactly two live scenarios. The following bar picks one by breaking the doji’s high or its low.
Many price-action traders wait for that break before acting. The wait costs a little entry quality and removes a great deal of guessing.
Some traders add a second filter as well. A break that also clears the previous swing carries more weight than a break of the doji alone.
Doji Versus the Other Small-Body Bars
Several shapes look similar at a glance, and traders mix them up constantly. The table below separates them by geometry rather than by story.
| Bar | Body | Wicks | What it records |
|---|---|---|---|
| Doji | Effectively a line | Any length | Open and close finished level |
| Spinning top | Small but visible | Long on both sides | Two-way trade, slight edge to one side |
| Hammer | Small, at the top | Long lower only | Lows rejected after a decline |
| Inside bar | Any size | Inside the previous range | Contraction against the prior bar |
Read that table as a naming guide, not a ranking. Each row describes a session shape, and each still needs a location before it earns any weight.
Using a Doji as a Filter Rather Than a Trigger
Most disappointment with candles comes from the wrong job description. Traders ask a single bar to start trades, then blame the bar when it misses.
Give it a smaller job and it performs far better. The candle can rank locations, size positions and time entries without ever launching a trade by itself.
Ranking Locations
Suppose three support levels sit below current price. A doji printing on one of them tells you which level the market actually noticed.
So the shape becomes a tiebreaker among candidates. That role costs nothing, and it makes your watchlist shorter.
Timing an Entry You Already Wanted
Plenty of traders decide direction from structure long before any candle forms. The doji then answers a narrower question: when to press the button.
Waiting for a pause at the level often improves the entry price. It also gives you the doji’s extreme as a tidy invalidation point.
Sizing From the Bar’s Range
A wide long-legged doji implies a wide stop, and a wide stop implies a smaller position. Read the bar as a volatility reading rather than a direction reading.
Feed that distance into a position calculator instead of guessing. Traders who skip the arithmetic end up risking three times their intended amount on volatile days.
Dojis on Continuous Forex Versus Gapping Markets
Classic candlestick literature grew up on markets with an overnight break. Stocks and rice both open at a fresh price each morning, which produces genuine gaps.
Spot forex trades around the clock five days a week. Gaps appear mainly at the Sunday open, and even those usually close within a session or two.
What Changes Without Gaps
Any classic definition that leans on a gap needs translation. On a currency chart the open normally sits within a pip of the previous close.
So the doji itself survives the translation intact, because it never needed a gap. Multi-bar star patterns lose more in the move.
Session Boundaries Replace the Gap
Forex still has natural breaks in behaviour. The Tokyo, London and New York sessions each bring a different mix of participants.
A doji at a session high or low therefore carries something like the weight a gap once carried. Mark the session extremes and the bar gains context immediately.
A Worked Doji Example at a Fresh Low
Picture a pair grinding lower for a week into a fresh low. The final push down stalls, and a dragonfly doji prints as buyers reclaim the whole wick.
Two facts now sit together. Price stretched to a new low for the move, and the session which reached it resolved nothing.

Reading the Sequence
Mark the doji’s high and its low. Those two prices become the decision boundaries for the following session.
A close above the high says buyers took control after the pause. A close below the low says the pause served as a rest inside the decline.
Neither outcome carries certainty. So plan both branches before either one arrives.
Where the Stop Belongs
The doji’s extreme gives you a natural invalidation point. Below the low for a long, above the high for a short, plus a buffer for the spread.
That buffer matters more than newer traders expect. A stop parked exactly on the wick invites a one pip sweep and an immediate reversal.
Size the position from the stop distance rather than from a fixed lot. Our risk reward calculator turns that distance and your target into a ratio before you commit.
Managing the Trade Afterwards
Once the break happens, the doji stops doing useful work. From that point the wider structure takes over the decision.
Trail behind swing points rather than behind the original candle. A single bar from several sessions ago cannot guide an exit.
Download the complete indicator database
Put these concepts on your charts. One email unlocks the full library of 1,380+ indicators with compiled MT4 and MT5 files, plus my TradingView scripts. No paywall, no spam, unsubscribe any time.
Get free access to my indicator database
One email unlocks 1,380+ free MT4, MT5 and TradingView indicators — the complete library. No single-tool download; you get the whole database.
Common Doji Mistakes and the Fixes
Six habits account for most doji trouble. The keypoints panel below collects the checks that prevent them.

Trading the Bar in Isolation
A doji floating in the middle of a range gives you nothing to lean on. Fix it by demanding a level, a trend context or a session extreme before the bar counts.
Calling Every Small Body a Doji
Small and equal describe different things. Write a numeric threshold into your plan, then apply it to every chart without exception.
Ignoring the Timeframe
A one-minute doji rarely survives contact with the next five minutes. Move up the timeframes and demand agreement before you act.
Assuming the Colour Matters
Some platforms tint a doji green or red on a fraction of a pip. That colour reflects rounding rather than conviction, so leave it out of the decision entirely.
Entering Before the Break
Buying inside the doji means guessing which side wins. Wait for a close beyond the high or the low, and let the market choose first.
Forgetting the Spread
Exotic pairs and late sessions widen the spread enough to fake a tiny body. Check the spread and the session before you trust the shape.
Doji Quick Reference Checklist
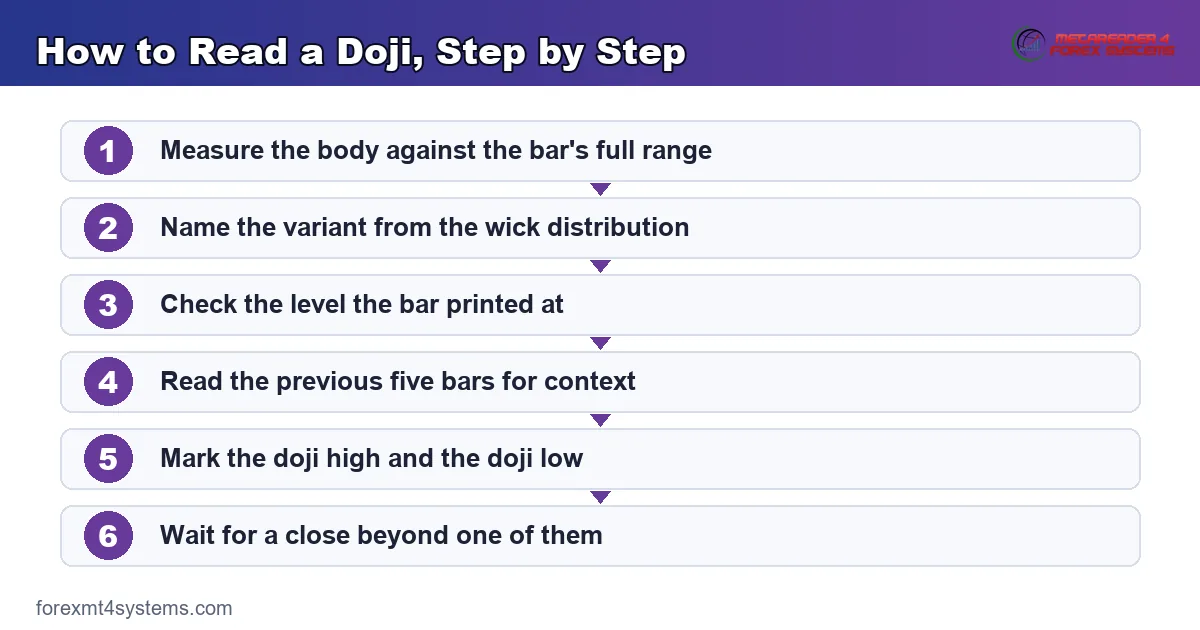
Run these seven questions whenever the bar appears. Two minutes of checking beats an hour of regret afterwards.
- Does the body fall inside your written threshold, measured as a share of the bar’s range?
- Which variant printed: neutral, long-legged, dragonfly, gravestone or four-price?
- Does the bar sit at a level you had already marked before it formed?
- What did the previous five bars do: trend, pullback or range?
- Where do the doji’s high and low sit, in exact prices?
- Which spread and which session produced the bar?
- Which close would invalidate the whole idea?
Write the answers beside the chart in your notes. Our trade journal keeps those observations attached to the trade itself.
When a Doji Fails
Failure deserves as much study as success. The chart below shows a doji whose long upper wick rejects a high, after which price climbs straight back through it.

Continuation Right Through the Pause
Strong trends absorb indecision easily. A doji inside a powerful run frequently marks a one-session breather, after which the trend simply resumes.
The Sweep Below the Low
Stops cluster under a doji’s low, and that cluster attracts price. A quick dip beneath the wick can trigger exits before the move you expected finally begins.
Our note on liquidity sweep trading explains why those clusters draw price toward them. Place the stop with that behaviour in mind.
News Overrides the Shape
A scheduled release can erase any candle logic within seconds. Check the calendar before you trade a bar that formed just ahead of one.
Repeated Dojis Inside a Range
Quiet ranges print dojis constantly. Counting each one as a signal produces a stream of small losses and a great deal of frustration.
The Break That Immediately Reverses
Sometimes the confirming close arrives and then fails within two bars. Price clears the doji high, stalls, and drops back under the whole structure.
That sequence costs you a full stop for a textbook entry. Accepting it as normal keeps you steady, since no shape removes the possibility.
Turning the Bar Into a Written Rule
Vague rules produce vague results. A doji you can define in numbers behaves consistently across every chart you open.
So write three lines into your plan and follow them without debate. Each line removes a judgement call that costs money later.
The Three Lines Worth Writing
Line one fixes the body threshold as a percentage of the bar’s range. Line two names the minimum timeframe you will act on.
Line three states the confirmation you require, usually a close beyond the doji’s extreme. Together those lines convert a vague shape into a repeatable check.
Reviewing the Rule Monthly
Pull every doji trade from the past month and sort them by location. Patterns emerge quickly once you separate levels from open space.
Then adjust one line at a time. Changing all three at once teaches you nothing about which line mattered.
Related Candle Concepts to Study Next
The bar makes far more sense beside its neighbours, since several patterns share its rejection logic. Two short reads fill the gaps quickly.
Start with our guide to candlestick wicks meaning, then compare it against pin bar meaning for the single-bar rejection case. Both use the same geometry with a looser body rule.
After that, read our even-handed look at whether candlestick patterns work. It sets expectations properly before you build any rules around a shape.
For tooling, browse the candlestick indicators archive and the pattern recognition indicators archive. Both mark shapes automatically, which frees your eyes for context.
FAQ
What does a doji candle mean?
It means the open and the close finished at effectively the same price, so buyers and sellers ended the session level. The bar records indecision for that period. On its own it says nothing about the direction of the next bar.
Is a doji bullish or bearish?
Neither by itself. The bar reports balance, and its colour usually reflects rounding rather than conviction. Context supplies any directional reading: a dragonfly at defended support and a gravestone under old resistance tell very different stories.
How small must the body be?
Most traders accept a body under roughly five percent of the bar’s high-to-low range. Pick a number, write it into your plan, and apply it everywhere. Consistency matters far more than the exact threshold you choose.
What separates a dragonfly from a gravestone doji?
A dragonfly carries a long lower wick with the body at the top of the range. A gravestone carries a long upper wick with the body at the bottom. One records rejected lows, the other rejected highs.
Do dojis work on lower timeframes?
They appear constantly there, and most of them reflect spread and thin flow rather than genuine balance. Higher timeframes involve more participants, so their dojis carry more weight. Plenty of traders ignore anything below the fifteen-minute chart.
Should I trade a doji on its own?
Most experienced traders do not. They treat the bar as context at a level marked earlier, then wait for a close beyond its high or low before acting. Results are not guaranteed; past performance is not indicative of future results.
External references
- For background on this concept, see Dragonfly Doji at Investopedia.
- For broader market context, see Long-Legged Doji at BabyPips Forexpedia.

About the author
Written by Dominic Walsh, a Forex trader and MT4/MT5 indicator, Expert Advisor and script developer. Every tool on forexmt4systems.com is tested on live charts before release and ships with ready-to-use compiled MT4 (.ex4) and MT5 (.ex5) files. Learn more about the trader and developer behind this site.
How we build, test and correct every tool: Editorial & Testing Policy. Trading carries risk; see the disclaimer.