
The inside bar meaning is simple enough to state in one line, which is why so many traders stop there. A bar sits entirely inside the range of the bar before it, and nothing more happened than that.
That single line hides most of what makes the pattern useful. This guide covers the inside bar meaning in exact geometric terms, then moves to location, context and the failure case that catches people out.
Inside Bar Meaning at a Glance
An inside bar describes a pause. Neither buyers nor sellers pushed price beyond where the previous bar already traded.
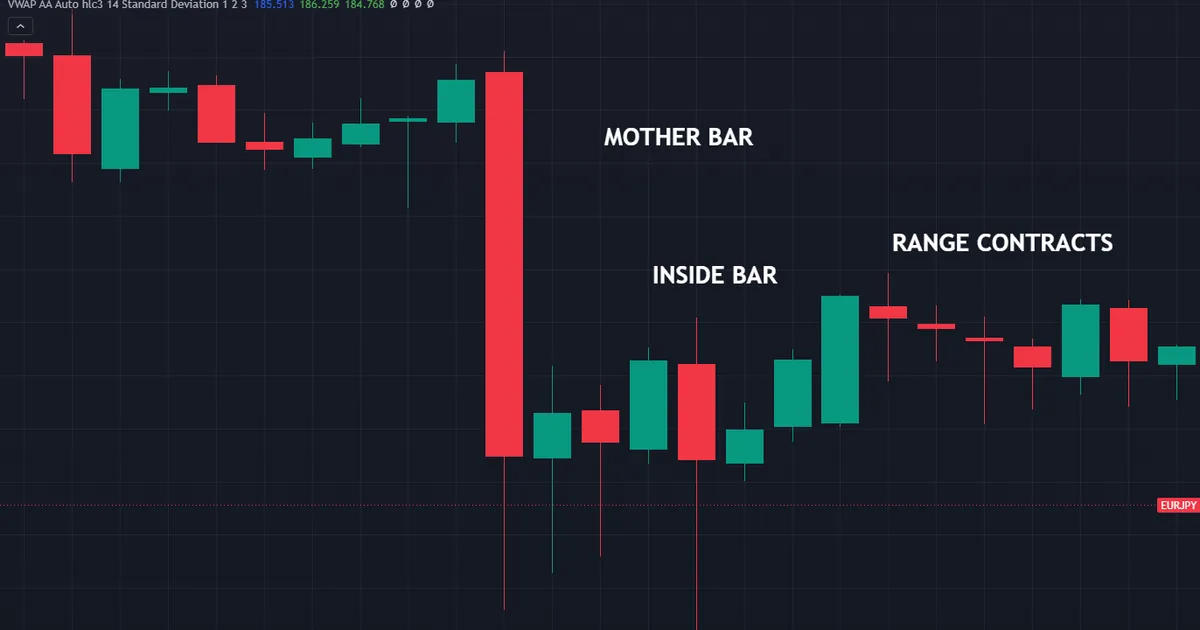
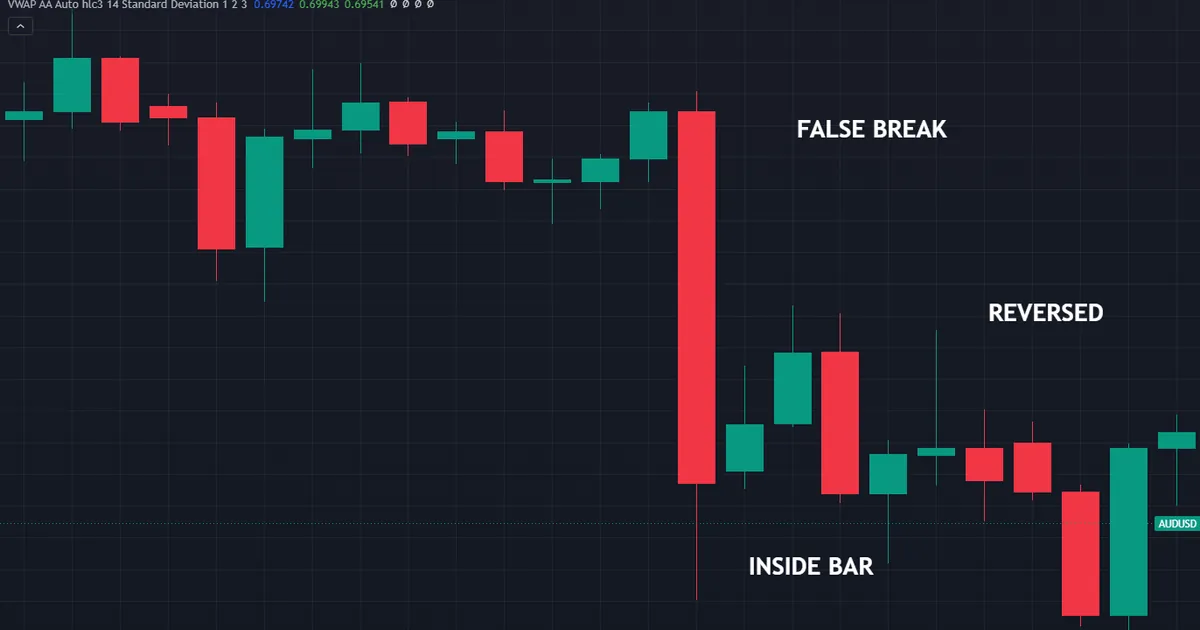
Look at the two labelled bars in the chart above. The smaller one opens, moves and closes without touching either extreme of the tall bar before it.
The Short Definition
An inside bar has a high at or below the previous high, and a low at or above the previous low. That whole range fits within the range before it.
Traders call that previous bar the mother bar. Some call it the setup bar, though the meaning stays identical.
Notice that the definition uses the full range. Wicks count here, which separates the inside bar from its body-based cousin later in this guide.
What the Bar Actually Describes
The pattern reports a fact about one period. Nobody managed to extend the prior range in either direction.
Descriptions are not forecasts. An inside bar tells you the market contracted, and it says nothing on its own about the direction of the next move.
A Note on Names
Price-action traders say inside bar. Older technical writing often says inside day, because the concept began on daily charts.
Two or more in a row pick up their own labels. Traders write “ii” for two and “iii” for three, and each extra bar tightens the coil further.
The Exact Anatomy of an Inside Bar
Every candle carries four prices. Open, high, low and close between them build the body and the wicks you see on screen.
Body, Wicks and Range
The body spans open to close. Wicks run from the body up to the high and down to the low.
Range means high minus low, so it covers the body plus both wicks. That whole span matters for this pattern.
Colour does not enter the definition. A bullish inside bar and a bearish one both qualify, though the close still tells you something about the session.
The Containment Rule
Two comparisons settle the question. The current high must not exceed the previous high, and the current low must not undercut the previous low.
Both conditions must hold at once. A bar that stays under the prior high but breaks the prior low is an outside move on one side, so it fails the test.
Equal Highs or Equal Lows
Traders disagree about exact ties. Some accept a high that matches the mother bar exactly, while others demand a strictly lower high.
Pick one convention and record it. Because tie handling changes how many bars qualify, mixing the rules makes your own notes impossible to compare.
Reading the Close Inside the Range
Where the inner bar closes still carries information. A close near the top of its own range shows buyers held the session, even though they never pressed further.
Compare that close against the mother bar too. A close in the upper third of the larger range reads differently from one hugging its floor.
Treat this as texture rather than a rule. The pattern stays neutral overall, and the close simply colours in how the pause developed.
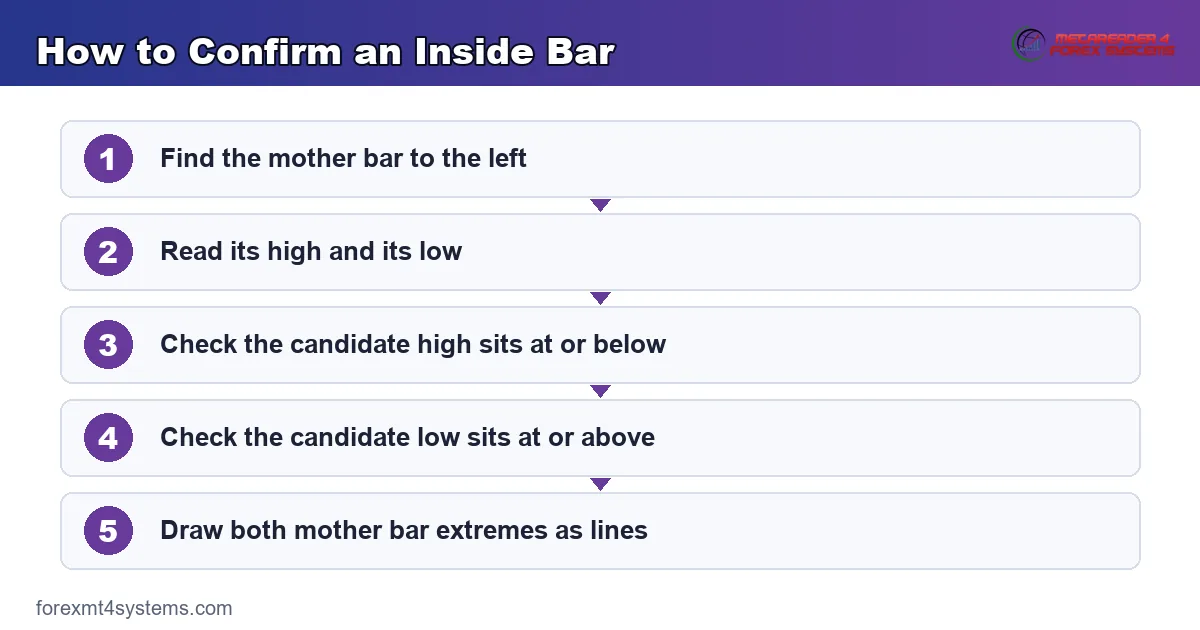
Confirming One in Six Steps
Run this sequence on any candle before calling it an inside bar. It takes about ten seconds on a chart.
- Find the mother bar. Look at the bar immediately to the left of the candidate.
- Read its high and low. Note both extremes rather than the body edges.
- Compare the highs. The candidate high must sit at or below the mother bar high.
- Compare the lows. The candidate low must sit at or above the mother bar low.
- Check the size gap. A much smaller inner range makes the contraction clearer.
- Mark both extremes. Draw the mother bar high and low, since those levels drive everything afterwards.
Step six does the real work. Without those two lines drawn, the pattern stays a curiosity rather than a reference point.
Why Contraction Comes Before Expansion
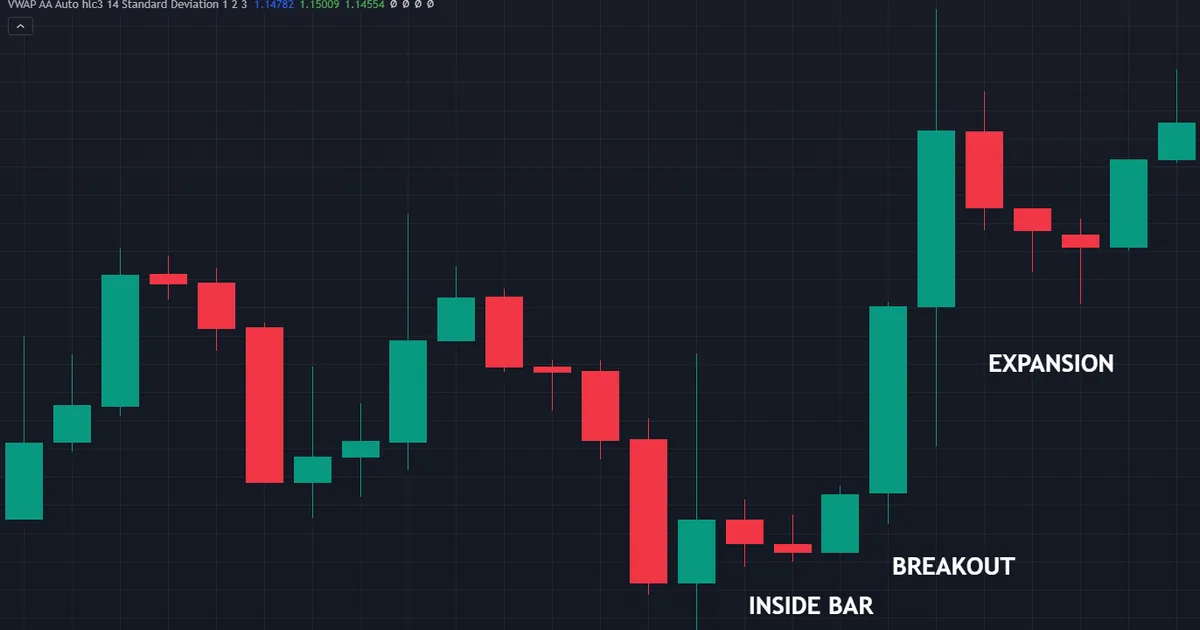
Markets do not move at a constant speed. Quiet stretches and violent stretches alternate, and that alternation gives the pattern its reputation.
Volatility Arrives in Clusters
Big ranges tend to follow big ranges, and small ranges tend to follow small ones. Researchers describe that behaviour as volatility clustering.
Clustering cuts both ways though. A quiet bar frequently precedes another quiet bar, so contraction alone predicts nothing about timing.
What a Narrow Range Tells You
A narrow bar shows agreement about value for that period. Buyers and sellers found each other comfortably, and neither side chased.
Agreement rarely lasts forever. Eventually fresh information or a fresh session arrives, and the range widens again.
That eventual widening is the honest claim. Nobody can tell you the direction from the contraction itself.
Where Inside Bars Cluster
Three places produce most of them. Look inside consolidation ranges, before scheduled news, and across quiet holiday sessions.
Lower timeframes produce enormous numbers of them. A five-minute chart in a dead hour prints inside bars constantly, and almost none carry meaning.
Measuring the Contraction
Eyeballing tightness works poorly across pairs. A forty-pip bar looks tiny on one instrument and huge on another.
Average true range fixes that. Compare the inner bar range against the recent average, and a genuine squeeze stands out immediately.
Some traders go further with a ratio. Dividing the inside bar range by the mother bar range gives a single number you can log and compare over time.
Multiple Inside Bars and Tighter Coils
One inside bar shows a pause. Several in a row show something rarer.
Two in a Row
A second inside bar nests within the first. Traders write this as “ii”, and the whole cluster still sits inside the original mother bar.
Each additional bar narrows the zone. So the distance from entry to invalidation shrinks, which is why coils attract traders hunting a tight stop.
Three or More
Three nested bars turn up far less often. On a daily chart of a major pair you might see a handful across a year.
Rarity does not equal reliability. A tighter coil simply produces a sharper move when the range finally breaks, in whichever direction that happens to be.
The Trade-Off Nobody Mentions
Tight stops sit close to obvious extremes. Close stops get reached by ordinary noise, so a smaller risk per trade often buys a higher rate of stop-outs.
Balance those two effects deliberately. A wider stop on smaller size frequently survives the same sequence that a tight stop cannot.
Location Decides Whether It Matters
The same shape means different things in different places. Context does the heavy lifting that geometry cannot.
At a Tested Level
An inside bar at a level people already watch adds information. Price reached the level, then stopped extending, which shows hesitation exactly where hesitation matters.
Support, resistance, a prior swing or a session high all qualify. Our guide to the ATR indicator helps you judge whether the contraction is genuinely unusual for that market.
Inside a Trend Pullback
Trends pause before they continue. An inside bar during a shallow pullback shows sellers running out of supply in an uptrend, or the mirror image in a downtrend.
That reading depends entirely on the trend being real. Check the higher timeframe first, because a pullback in your view may be a range on somebody else’s.
After a Long Directional Run
A sharp run often ends with a pause rather than a turn. An inside bar there shows the push losing steam, though it never announces a reversal.
Two outcomes follow that pause regularly. Price resumes the run after digesting the move, or it rolls over into a proper correction.
So the bar marks a decision point rather than a direction. Mark both extremes, then let the market pick a side while you wait.
In the Middle of Nothing
Most inside bars appear in featureless price. No level sits nearby, no trend runs through, and the bar simply reports a slow session.
Skip those. Because the pattern carries no directional information by itself, an inside bar without context gives you nothing to act on.
Session and Timeframe Context
Forex trades around the clock, so bar boundaries follow your broker’s server time. An inside bar built across the Asian session means something different from one built across the London open.
Daily and four-hour charts filter most of the noise. Our forex volatility calculator shows typical ranges per pair, which makes an unusually tight bar easier to spot.
Download the complete indicator database
Put these concepts on your charts. One email unlocks the full library of 1,380+ indicators with compiled MT4 and MT5 files, plus my TradingView scripts. No paywall, no spam, unsubscribe any time.
Get free access to my indicator database
One email unlocks 1,380+ free MT4, MT5 and TradingView indicators — the complete library. No single-tool download; you get the whole database.
The Inside Bar and the Harami
These two patterns describe the same idea with different rulers. Knowing which ruler you use prevents a lot of confusion.
Same Idea, Different Measurement
The harami compares bodies. A small second body sits inside the previous large body, and the wicks play no part in the test.
The inside bar compares full ranges. Wicks count, so the test is stricter and fewer bars qualify.
Every inside bar is therefore a harami. The reverse fails often, because a small body can easily sit inside a large one while its wick still pokes past the prior high.
When the Two Overlap
Both patterns say the same thing at heart. Momentum stalled, and the previous period still contains the current one.
Our guide to the harami candlestick pattern covers the body-based version in detail. Read both and you will stop treating them as separate discoveries.
Where the Candlestick View Came From
Candlestick charting grew out of Japanese rice trading. Traders in that market plotted open, high, low and close centuries before the technique reached the West.
The Historical Line
Writers commonly associate the method with Honma Munehisa, a rice merchant who traded at Osaka in the eighteenth century. Much of the legend around him stays unverified, so treat the attribution loosely.
Steve Nison introduced candlesticks to Western traders in the early nineteen nineties. His books gave the patterns their familiar English names.
Why the History Matters Here
The vocabulary came from a market with daily sessions and real gaps. Currency markets trade around the clock, so several classic patterns behave differently on a forex chart.
Inside bars survive that translation well. Because the definition needs only two ranges, no gap and no session close is required for the shape to appear.
How Traders Actually Use the Pattern
Two approaches dominate. Neither one carries any promise, and both need a level worth trading around.
The Breakout Approach
Traders wait for price to leave the mother bar range. A stop order sits just beyond the high for longs, or just beyond the low for shorts.
Direction usually comes from context rather than the pattern. In an uptrend most traders only take the upside break, since a countertrend break has the larger trend against it.
The Fade Approach
Others do the opposite at strong levels. They let the first break fail, then trade back into the range once price closes inside again.
This approach suits ranges rather than trends. Because the first break often runs into resting orders, the fade tries to profit from that specific behaviour.
Stop Placement
Two obvious homes exist for a stop. Beyond the inside bar extreme keeps risk small, while beyond the mother bar extreme survives more noise.
The tighter stop trades size for durability. Choose deliberately rather than by habit, and write the choice into your plan.
Waiting for the Close
Intrabar breaks reverse constantly. Waiting for a close beyond the mother bar extreme removes a share of those head fakes.
Patience costs you part of the move. So the choice trades entry price against a cleaner signal, and neither option is objectively correct.
Test both against your own records. Because the answer depends on your market and your costs, somebody else’s preference means little here.
Sizing Off the Mother Bar
Stop distance sets position size, not the other way round. Measure from entry to your chosen stop, then work the lot size from your risk per trade.
Our risk reward calculator turns those distances into a ratio before you commit. A tight coil often produces an attractive ratio, which is much of the pattern’s appeal.
Common Mistakes With Inside Bars
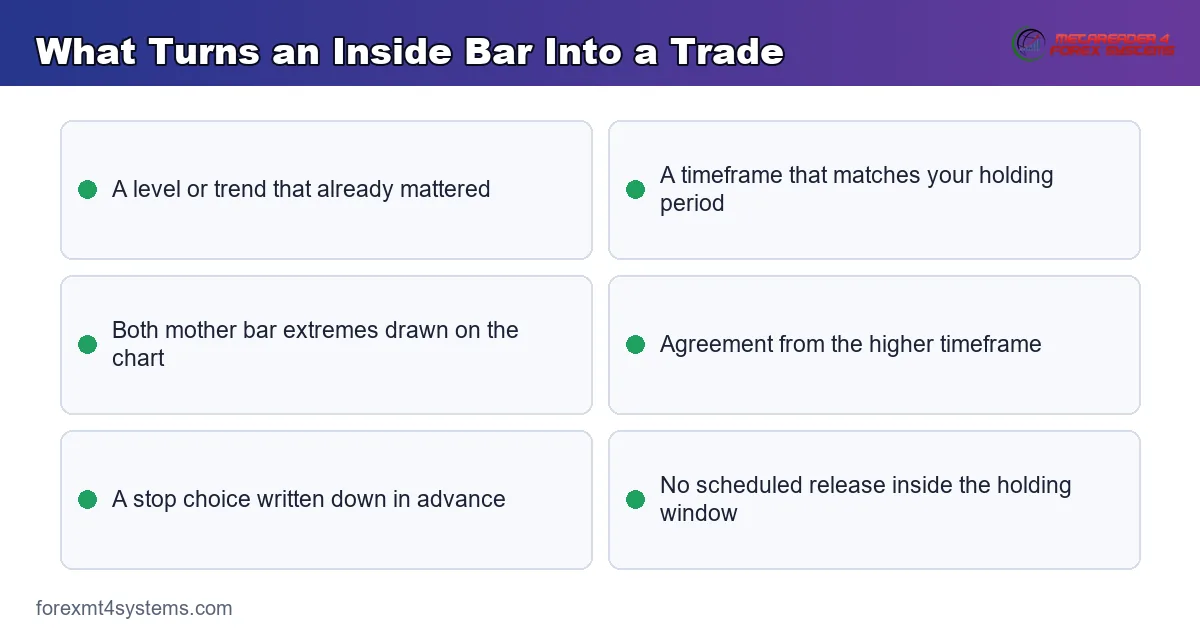
Traders repeat the same handful of errors with this pattern. The graphic below lists what actually turns an inside bar into a trade worth considering.
Trading Every One You See
Inside bars appear constantly on fast charts. Taking them all buys you costs and nothing else. So filter by location first and by timeframe second.
Ignoring the Mother Bar Extremes
The pattern only becomes useful once both lines sit on the chart. Traders who skip that step have no reference for entry, stop or invalidation. So draw the high and the low before anything else.
Assuming a Direction
Contraction says nothing about which way the range breaks. Traders who pick a side in advance simply front-run their own bias. So let the level and the trend choose the side for you.
Confusing Small With Inside
A tiny candle is not automatically an inside bar. Its high can still exceed the previous high while its body looks minuscule. So check the extremes rather than trusting the visual.
Using the Same Stop Everywhere
A coil inside a wide mother bar behaves nothing like a coil inside a narrow one. Copying one stop rule across both invites random results. So match the stop to the structure in front of you.
Trading Straight Through News
Quiet bars often form because everybody waits for a release. A break driven by that release moves faster than your order can follow. So check the calendar before you place a resting stop order.
Inside Bar Quick Reference
Work down this list whenever a candidate appears. It takes under a minute.
- Confirm the high sits at or below the mother bar high.
- Confirm the low sits at or above the mother bar low.
- Draw both mother bar extremes as lines.
- Name the level or trend that gives the bar meaning.
- Check the higher timeframe for agreement.
- Check the calendar for a release inside your holding window.
- Choose the inside bar stop or the mother bar stop.
- Size the position from that stop distance.
- Write the invalidation point next to the entry.
Steps four and five reject most candidates. That rejection rate is the point, since the pattern earns its keep as a filter rather than a trigger.
The False Breakout Case
Every honest guide has to cover this part. The chart below shows a break that reverses straight back through the range.
What a Failed Break Looks Like
Price clears the broken extreme by a few pips. Then it turns, closes back inside the range, and often runs out the other side within a bar or two.
Traders who entered on the break now hold a losing position. Traders who set a stop beyond the opposite extreme watch it disappear as well.
Why It Happens So Often
Stops cluster just past obvious extremes. A tight two-bar coil creates two very obvious extremes, so the orders pile up in exactly two places.
Reaching those orders produces a quick move that fades. Nothing sinister drives it, since the same mechanics operate in every liquid market.
The Two-Sided Trap
Some sessions sweep both extremes in turn. A break upward fails, a break downward fails, and both directions cost a trader who chased each one.
One rule limits the damage. Take a single attempt per coil, then step away until fresh structure forms.
What Honest Expectations Look Like
Failures are ordinary rather than exceptional. Any pattern based on a two-bar shape will fail regularly, and no filter removes that.
So treat the setup as one input among several. Position size, location and a written invalidation point matter more than the shape ever will.
What the Research Actually Suggests
Academic tests of candlestick patterns have generally found little consistent edge once costs enter the sum. Results also shift by market, by period and by the exact definition applied.
None of that makes the shapes useless. It does mean the pattern belongs in your process as a filter for trade location, rather than as a standalone reason to click.
Read the evidence honestly and the pattern gets easier to use. You stop expecting it to carry the trade, and you start giving that job to context and risk control.
Related Concepts to Study Next
Three neighbouring guides round out this topic. Each covers a shape that appears in the same situations.
Read our explainer on the hammer candlestick for the single-bar rejection case, then compare it with the engulfing candle for the expansion case. For tools that mark these shapes automatically, browse our candlestick indicators and the wider pattern recognition collection.
FAQ
What does an inside bar actually mean?
It means the current period stayed entirely within the previous period’s high and low. Neither side extended the range, so the market paused. That description carries no direction on its own.
Is an inside bar bullish or bearish?
Neither, by itself. The pattern is directionally neutral, and the surrounding trend or level supplies any bias you use. Traders who read a direction into the shape alone are adding something the data does not contain.
What is the difference between an inside bar and a harami?
The inside bar compares full ranges including wicks, while the harami compares only the candle bodies. Every inside bar therefore qualifies as a harami, but plenty of harami patterns fail the stricter range test.
Which timeframe suits inside bars best?
Daily and four-hour charts produce fewer and cleaner examples. Fast charts print them constantly during quiet hours, and most of those carry no information. Choose the timeframe that matches your holding period.
What is a mother bar?
The mother bar is simply the candle immediately before the inside bar. Its high and low define the range that contains the smaller bar, and those two levels become the reference points for entry, stop and invalidation. Some traders call it the setup bar instead.
Where should the stop go on an inside bar trade?
Two conventional choices exist: just beyond the inside bar extreme, or just beyond the mother bar extreme. The first keeps risk small, and the second survives more noise. Write your choice into the plan rather than deciding in the moment.
Do inside bar breakouts fail often?
Failed breaks are a normal part of trading this shape, because resting orders cluster just past both extremes. Treat the pattern as a location filter rather than a trigger, size the position from the stop distance, and accept that a portion of attempts will not follow through. Results are not guaranteed; past performance is not indicative of future results.
External references
- For background on this concept, see Harami at BabyPips Forexpedia.
- For broader market context, see Three Inside Up/Down at Investopedia.

About the author
Written by Dominic Walsh, a Forex trader and MT4/MT5 indicator, Expert Advisor and script developer. Every tool on forexmt4systems.com is tested on live charts before release and ships with ready-to-use compiled MT4 (.ex4) and MT5 (.ex5) files. Learn more about the trader and developer behind this site.
How we build, test and correct every tool: Editorial & Testing Policy. Trading carries risk; see the disclaimer.