
The flag pattern meaning starts with a pole. A sharp, near-vertical move runs first, and only then does a small, shallow consolidation drift back against it.
Without that pole you have a range, not a flag. This guide covers the two halves, the confirmation rule, the projection, and the way these shapes let traders down.
Flag Pattern Meaning in Plain Terms
A flag records a pause inside a fast move. Price surges, buyers or sellers stop pressing for a while, and the chart drifts gently in the opposite direction.
The outline resembles a flag on a pole. A steep run forms the staff, and a small tilted rectangle forms the cloth.
Two boundaries define that rectangle. Draw one line across the drift highs, another across the drift lows, and keep them roughly parallel.
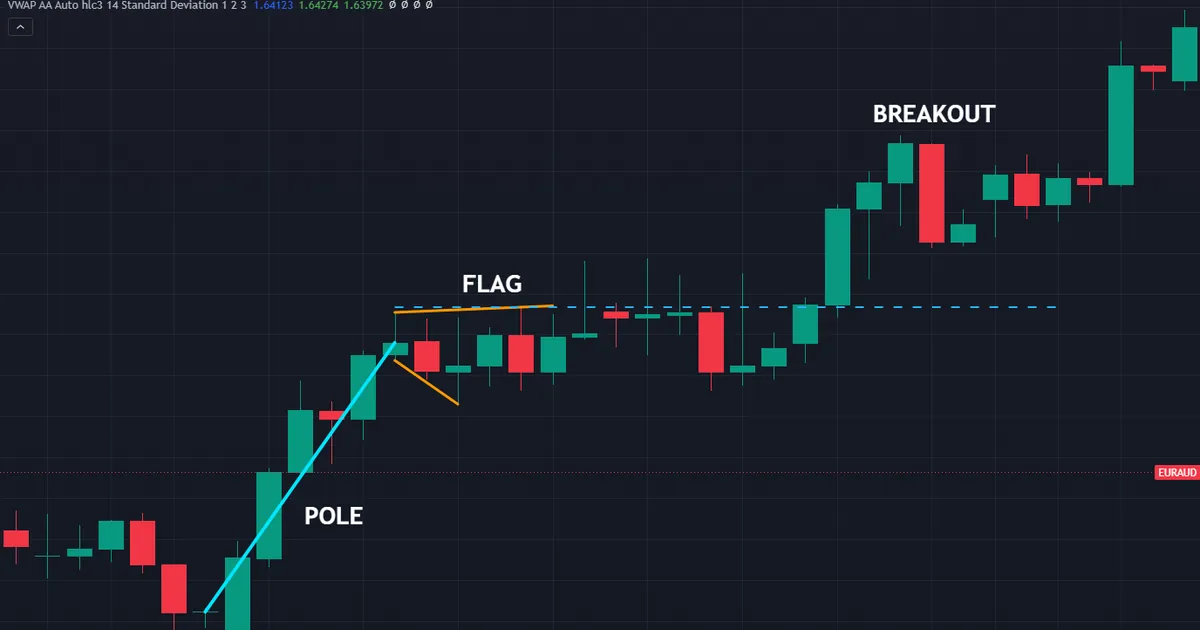
Above sits a bull flag on the EURAUD four-hour chart. The pole covered roughly 132 pips, the drift tilted gently downward, and price then closed above the flag near 1.64734.
The Pole Comes First
Everything depends on the move that arrives before the pause. A pole should look impulsive: few overlapping bars, little hesitation, and a clear direction.
Slow grinding advances make poor poles. If the run took thirty bars of overlapping candles, the shape that follows describes a range rather than a flag.
Length matters too, because the pole supplies the projection later. A short pole gives a short target, which changes whether the trade covers its costs at all.
The Flag Itself Drifts Against the Move
After the pole, price eases back. In a bull flag the drift tilts down, and in a bear flag it tilts up.
That opposition matters. A pause that continues in the same direction as the pole describes a slowdown, not a flag, and the projection rules no longer apply.
Boundaries stay roughly parallel through the drift. Once they start converging noticeably, you have a pennant instead, which our note on flags versus pennants separates properly.
Why the Drift Has to Stay Shallow
Depth tells you how much of the move got given back. A drift that retraces most of the pole says the buyers who drove it have left.
Most traders want the pullback to stay well inside the pole. Half of it makes a sensible ceiling, and anything deeper turns the read into a reversal question rather than a continuation one.
Duration works the same way. Flags that drag on for dozens of bars lose the urgency the pole created, and the shape quietly becomes an ordinary range.
How a Flag Forms, Step by Step
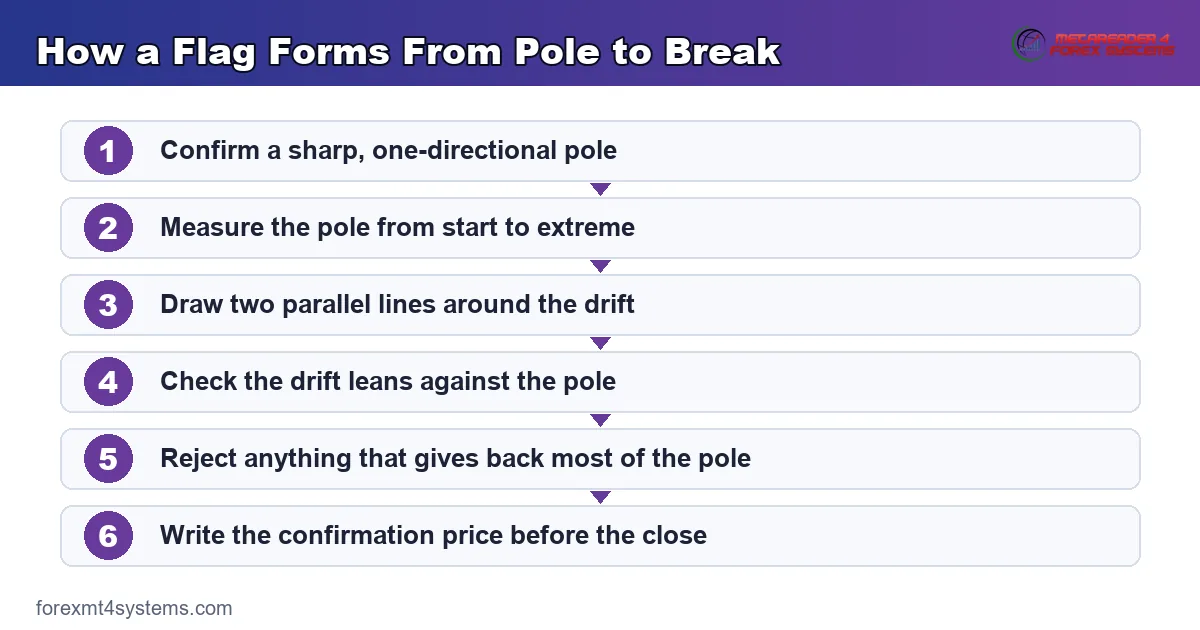
Work through the same six checks each time. The order protects you, because step one rejects most of the shapes that merely look right.
- Find the pole. Confirm a sharp, one-directional run with little overlap between bars.
- Measure it. Note the distance from the start of the run to its extreme.
- Mark the drift. Draw two roughly parallel lines around the consolidation.
- Check the tilt. The drift must lean against the pole, not with it.
- Check the depth. Reject anything that gives back most of the pole.
- Write the confirmation price. Fix the level a close must clear before you act.
Step six deserves the most discipline. A confirmation price chosen after the break tends to land wherever the trader already wanted it.
Keep the lines fixed once the second touch confirms them. Boundaries that move to suit the story stop describing the market.
What the Shape Says About Supply and Demand
A flag records behaviour rather than intent. The pole shows one side overwhelming the other, and the drift shows what happened once that pressure eased.
Who Sold Into the Pole
Fast moves leave traders behind. Some took profit early, some never got filled, and some now hold losses on the wrong side.
The drift gives all of them a second chance. Profit taking supplies the gentle pullback, and latecomers supply the demand that stops it going further.
Why the Pause Stays Orderly
Shallow, tidy consolidation suggests nobody panicked. Sellers into a bull flag take small profits rather than dumping size, so the retracement stays contained.
Compare that with a violent give-back. Bars that erase the pole in two candles describe a different market, and the flag label stops fitting.
Activity Through the Pole and the Drift
Classical descriptions expect heavy participation in the pole and lighter participation in the drift. That pairing suggests the crowd drove the run and then stepped aside rather than reversing.
Currency charts complicate the check. Retail feeds report tick counts rather than traded size, so treat any volume reading on forex as a rough proxy at best.
Bar range gives you a usable substitute. Wide candles through the pole followed by visibly smaller candles through the drift describe the same behaviour without relying on the volume column.
What the Shape Cannot Tell You
A flag describes structure that has already formed. It records where the pole ran and where the drift held, and it says nothing certain about the next fifty bars.
Published testing of classical chart shapes has produced modest and inconsistent results. Outcomes move with the instrument, the period, the costs and the exact drawing rules applied.
So treat the shape as a framework for planning. It gives you a level, a stop and an invalidation in advance, which already justifies the effort.
Where a Flag Deserves Attention
Location separates the shapes worth trading from the rest. These structures appear constantly on lower timeframes, and most of them sit nowhere useful.
Behind a Genuine Impulse
The best examples follow a move that changed something. A break of an old range, a reaction to data, or a session opening drive all leave real poles behind.
Weak poles produce weak flags. If nothing on the chart explains the run, the pause afterwards rarely carries much either.
Volatility gives you a rough yardstick. Compare the pole against the recent average range using our note on ATR in trading, and treat anything smaller than a normal daily swing with caution.
After a Level Actually Broke
The cleanest poles start where something gave way. An old range ceiling, a weekly high or a prior swing all supply a reason for the run.
Price then drifts back toward the broken level during the flag. That old boundary now sits under the drift, which gives the pause somewhere sensible to stop.
So check what the pole broke before you draw anything. A run that started from the middle of a range has nothing beneath it to catch the pullback.
Inside the Larger Trend
Flags work as continuation shapes, so the surrounding direction matters. A bull flag inside a rising market simply pauses that move.
The same shape inside a firm downtrend asks far more. You are trading against the higher timeframe, so either skip it or size down deliberately.
Away From Scheduled News
Data releases erase chart structure. A flag that sits on top of a central bank decision offers a level, though the release rather than the shape will decide the outcome.
Check the calendar before planning around a boundary. Then either wait for the print or accept that your stop faces a very different kind of move.
Confirming the Break and Projecting the Move
One rule governs every flag. A close beyond the boundary completes the shape, and a wick through it completes nothing.
The Close Beyond the Boundary
Decide which close counts before the trade. A flag drawn on the four-hour chart deserves a four-hour close, not a five-minute one.
Price pierces these small boundaries constantly. Waiting for the settled close removes most of those probes from your day.
Retests happen often after a genuine break. The old boundary then acts from the other side, and many traders prefer that tighter second entry.
Which Boundary Actually Counts
Only one line triggers the trade. In a bull flag that means the upper boundary, and in a bear flag it means the lower one.
The opposite line still earns its place. It defines the drift, it caps the acceptable depth, and it usually holds your stop.
Draw both before the break rather than one. A flag with a single line drawn on it invites you to invent the other side once price starts moving.
Measuring From the Pole
The classic projection copies the pole. Measure the run, then add that distance to the break point in the direction of the original move.
Treat the result as a projection rather than a promise. Price frequently stops short of it, which is exactly why partial exits exist.
Some traders measure from the flag low instead of the break. Pick one convention, write it down, and apply it to every trade so your records stay comparable.
A Bear Flag in Practice
Now turn the shape upside down. The chart below shows a bear flag on the EURUSD four-hour chart across two sessions in June.
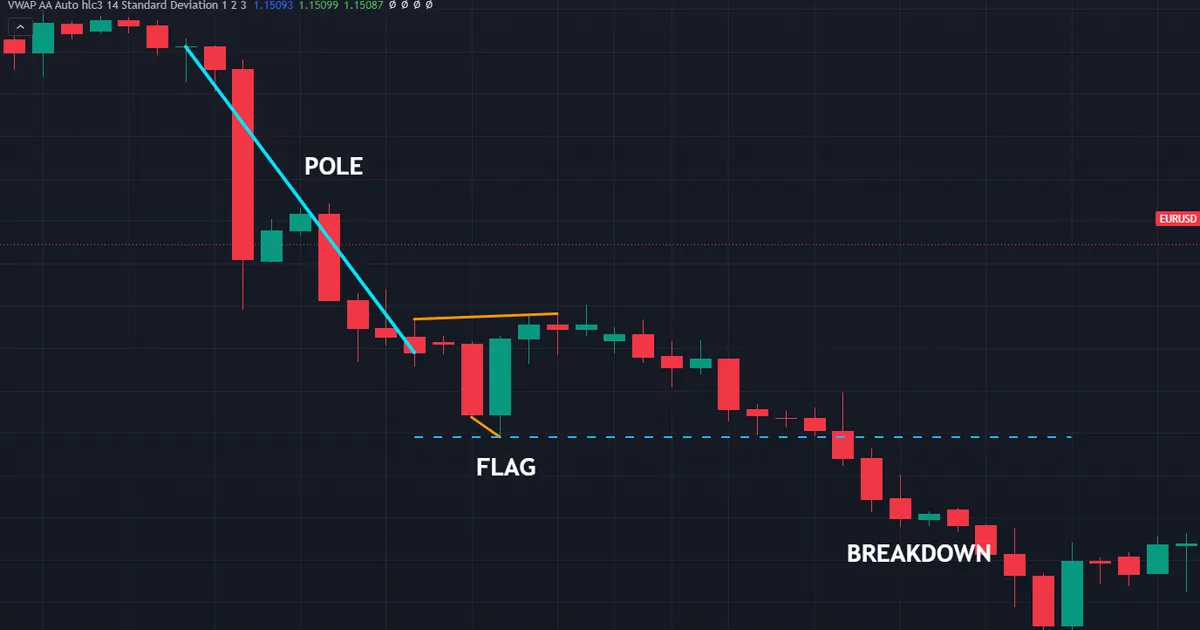
The pole ran roughly 144 pips down. Price then drifted gently upward, and the close came below the flag near 1.1418.
Copy that pole from the break and the projection lands well below. Before committing, run the stop and target distances through our risk reward calculator and reject anything that fails your own ratio.
Download the complete indicator database
Put these concepts on your charts. One email unlocks the full library of 1,380+ indicators with compiled MT4 and MT5 files, plus my TradingView scripts. No paywall, no spam, unsubscribe any time.
Get free access to my indicator database
One email unlocks 1,380+ free MT4, MT5 and TradingView indicators — the complete library. No single-tool download; you get the whole database.
Sizing and Managing a Flag Trade
Spotting the shape solves the easy half. Stop placement, size and exits decide most of what actually lands in the account.
Where the Stop Belongs
Put the stop beyond the far side of the flag rather than a few pips past the boundary you traded. A stop inside the drift sits exactly where ordinary noise reaches.
Some traders use the pole start instead. That placement survives almost any shakeout, though it demands a much smaller position for the same risk.
Work the two numbers together with our position size calculator. Whatever the flag measures, the amount at risk should stay the same.
Entry on the Close or the Retest
Taking the close catches every break and accepts a worse fill. Waiting for the retest gives a tighter stop, though many breaks never return to the line.
Splitting the order removes the choice entirely. Half enters on the close, half rests as a limit at the boundary, and both share one stop.
Scaling Out Along the Way
Mark the obvious levels between entry and projection first. An old swing, a round number and the session extreme all deserve a note.
Then take a slice at the nearest one. Booking part of the position early makes holding the rest through a normal pullback far easier.
Common Flag Mistakes and the Fixes
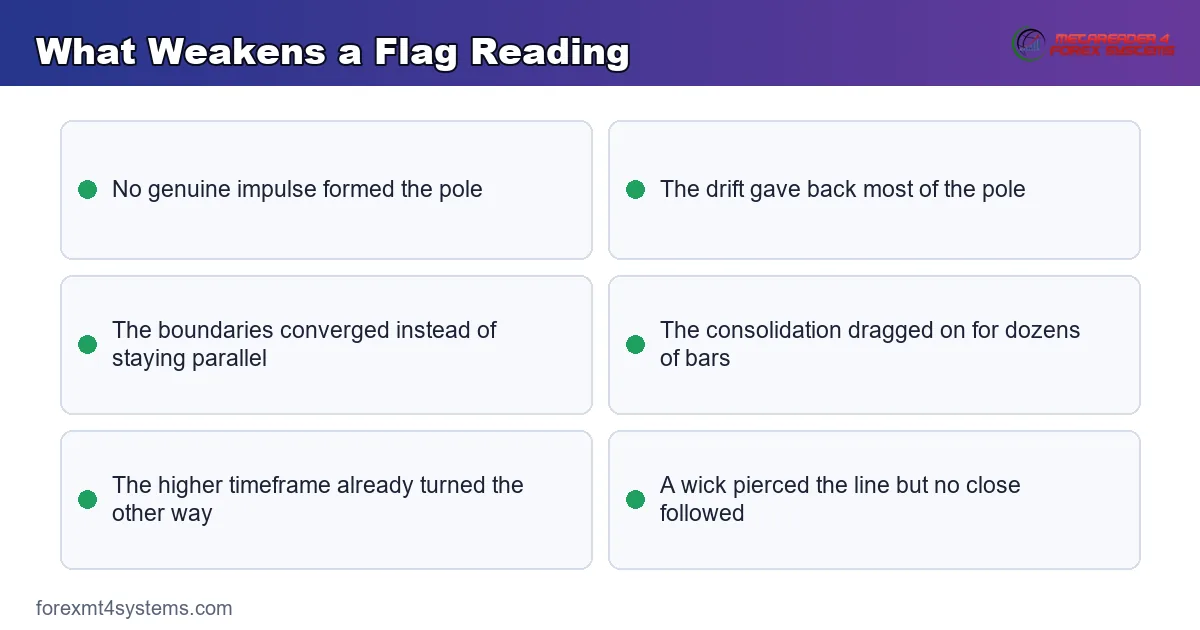
Most losses around this shape trace back to a short list of habits. The panel below collects what weakens a flag reading before the break even arrives.
Calling Any Pause a Flag
No pole means no flag. Check the run first, and file the shape under ranges when the move behind it never happened.
Accepting a Deep Retracement
A drift that gives back most of the pole has changed character. Set a depth limit, write it down, and apply it without exceptions.
Trading the Wick
A spike beyond the boundary completes nothing. Wait for the close on the timeframe that drew the lines, and most false breaks never reach your account.
Letting the Flag Run Too Long
Urgency fades with every bar. A consolidation that drags on for dozens of candles has become a range, whatever the original pole looked like.
Measuring the Pole Inconsistently
Some traders measure from the swing low, others from the breakout of the prior range. Both work, and mixing them ruins any record you keep.
Holding for the Full Projection
The pole gives a reference, not a destination. Book part of the position at the first obvious level, then trail the rest behind structure.
Ignoring the Cost of Small Shapes
An hourly flag with a fifty pip pole leaves little room. Spread and swap consume a real share of that target, so tight structures demand sharper execution.
Skipping the Session Check
Breaks in thin hours behave differently from breaks into a busy session. Note which session produced the closing bar, then treat a quiet-hours trigger with extra caution.
Redrawing the Flag After the Break
Shifting a boundary once price moves turns the shape into a story. Fix both lines when the second touch confirms them, then leave them exactly where they sit.
Flag Quick Reference
Keep this table beside the chart while the shape becomes familiar. Each row states a condition rather than an outcome.
| Element | What to check | Common practice |
|---|---|---|
| Pole | Sharp, one-directional, little overlap | Compare it against the recent average range |
| Drift | Tilts against the pole | Two roughly parallel boundaries |
| Depth | Well inside the pole | Often capped near half of it |
| Duration | Short relative to the pole | A handful of bars, not dozens |
| Trigger | A close beyond the boundary | Close on the timeframe that drew the shape |
| Stop | Beyond the far side of the flag | Or behind the pole start for more room |
| Target | Pole distance from the break | Partial exits at levels along the way |
Then run these six checks before any entry.
- A pole that stands out against the recent range
- A drift leaning against the original direction
- Two boundaries that stay roughly parallel
- A retracement inside your written depth limit
- A confirmation price fixed before the break
- A first target at the nearest obvious level
Notice what the list leaves out. Nothing here suggests how often the shape follows through, because that figure shifts with the market, the period and the definition applied.
When a Flag Fails
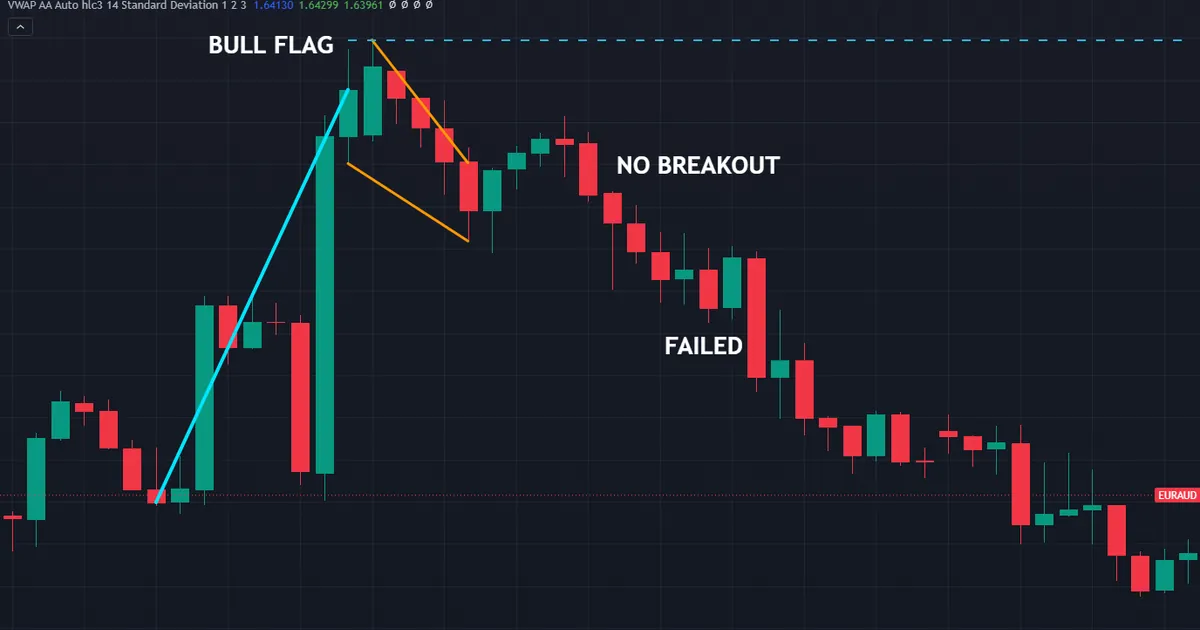
Failed continuation shapes hurt because traders size them confidently. The chart below shows a bull flag on the EURAUD hourly chart where the close above 1.64995 never arrived at all.
The Break Never Arrives
Price built the pole, drifted back tidily, and then simply drained away from the upper boundary. No hourly bar ever settled above 1.64995, so the shape never completed and no trade was ever triggered.
The pole measured roughly 98 pips, which set a modest projection. Waiting for the close cost nothing here, while anticipating it would have bought a drift that quietly rolled over.
The Pole Was Too Small
Short poles produce short targets. Once the projection shrinks toward the size of your stop, the trade stops making sense whatever the shape looks like.
The Trend Had Already Turned
A continuation shape needs something to continue. Check the higher timeframe before you commit, because a bull flag inside a fading advance continues very little.
Thin Liquidity Around the Boundary
Quiet hours rarely supply the buying a break needs. Note which session the drift is sitting in, then adjust what you expect from the bars ahead.
The Boundaries Were Drawn Too Loosely
Wide lines swallow the shape. A boundary drawn generously enough to contain every wick produces a confirmation price nobody would trade.
Tight lines create the opposite problem. They trigger on noise, and the break arrives before the consolidation finished.
Pick the touches that mattered and ignore the rest. Two clean highs and two clean lows beat six approximate ones every time.
Hindsight Made It Look Obvious
Scroll back through any chart and clean flags appear everywhere. The eye picks out the tidy ones and skips the messy ones, which flatters the shape considerably.
Real-time drawing feels nothing like that. Log every flag you mark, including the ones you pass on, and our guide to why chart patterns fail explains what that record usually shows.
Related Shapes Worth Studying
Pennants sit closest to flags. They follow the same pole and serve the same purpose, though their boundaries converge instead of running parallel.
Triangles offer the wider family. Our guide to the types of triangle patterns covers the three converging variants and how each one differs.
Wedges look similar and mean something else again. Both boundaries slope the same way there, and our note on the wedge pattern meaning makes the distinction clear.
Failure deserves its own study session. Continuation shapes break the wrong way often enough that planning the invalidation matters as much as planning the entry.
Levels underpin all of it. A flag only earns attention when the pole started somewhere the market already cared about, so time spent on level drawing pays back faster than time spent memorising outlines.
For tooling, our trend indicators archive collects the tools that help establish the direction a flag would continue, and our pattern recognition indicators archive covers the scanners that mark these shapes automatically.
FAQ
What is the flag pattern meaning in simple terms?
A sharp move called the pole, followed by a small consolidation that drifts against it between two roughly parallel lines. The shape completes when price closes back beyond the drift in the direction of the pole.
How do I tell a bull flag from a bear flag?
Look at the pole. An upward pole with a downward drift makes a bull flag, while a downward pole with an upward drift makes a bear flag.
How deep can the flag pull back?
Most traders cap it near half the pole. Deeper retracements suggest the move behind the pole has finished, so the continuation reading no longer holds up.
Where do I place the stop on a flag trade?
Beyond the far side of the drift, or behind the start of the pole if you want more room. The wider placement demands a smaller position so the amount at risk stays fixed.
How is the target calculated?
Copy the pole length and add it to the break point. Treat that number as a projection rather than a destination, and take partial profit at the obvious levels in between.
What is the difference between a flag and a pennant?
Boundary shape. A flag keeps its two lines roughly parallel, while a pennant converges into a small symmetrical triangle after the same kind of pole.
Do flag patterns work on forex charts?
They appear regularly across currency pairs and every timeframe. No chart shape offers a dependable edge on its own, so pair it with a real pole, a written confirmation price and sensible sizing. Keep a log of every one you trade, because your own record teaches you more about your pairs than any general article can. Results are not guaranteed; past performance is not indicative of future results.
External references
- For background on this concept, see Flag and Pennant at StockCharts ChartSchool.
- For broader market context, see Flag at BabyPips Forexpedia.

About the author
Written by Dominic Walsh, a Forex trader and MT4/MT5 indicator, Expert Advisor and script developer. Every tool on forexmt4systems.com is tested on live charts before release and ships with ready-to-use compiled MT4 (.ex4) and MT5 (.ex5) files. Learn more about the trader and developer behind this site.
How we build, test and correct every tool: Editorial & Testing Policy. Trading carries risk; see the disclaimer.