
Plenty of traders learn the five-three shape and then stall. Knowing how to use elliott wave counts on a live chart takes a different set of habits from reciting the model.
This guide covers the practical side. Where to start a count, which degree to work on, how to write a preferred reading with an alternate beside it, and what to do the moment price breaks the count.
Say the awkward part first. Counting waves calls for judgement, two capable analysts routinely label one chart in opposite directions, and everybody revises counts once fresh price arrives.
How to Use Elliott Wave Counts Day to Day
A count answers one question. It places the swing in front of you inside a larger structure, so you can judge whether to press, trim or stand aside.
Notice what that leaves out. No entry price, no stop, no target and no timing come with the label.

Above sits a workable example. A five-wave advance runs across the XAUUSD daily chart, wave three peaks at 3674.695, and wave five carries the move to 3707.555.
What a Count Gives You
Context arrives first. A pullback inside wave four reads very differently from a pullback after wave five, even though both look identical in isolation.
Bias comes second. When the larger structure points up, you weight long setups more heavily and take fewer counter-trend trades.
Then comes a discipline benefit. Writing the level that would break the count forces you to state, in advance, what would prove you wrong.
What It Does Not Give You
Timing stays absent. Elliott described shape, not schedule, so a wave four can drift for two sessions or for two months.
Precision stays absent too. Wave endings only become certain after price moves away from them, which arrives well after the useful moment.
Our Elliott wave theory guide covers the model itself and where it came from. This page assumes you already know the shape.
When Counting Is Not Worth It
Some charts refuse to cooperate. Overlapping swings, long ranges and choppy sessions produce structures that three different analysts would label three different ways.
Walk away from those. A forced count on a messy chart adds confidence without adding information, which costs more than skipping the pair entirely.
Clean trends reward the effort instead. Distinct pushes with visible pullbacks give you turning points everybody would mark in roughly the same places.
Keep a short list of pairs you count. Watching six charts properly beats scanning thirty and labelling whatever moved yesterday.
Starting a Count From Scratch
Beginners usually start too small. Work through the order below and the common tangles mostly disappear.
- Choose the chart first. Pick the timeframe that matches how long you hold trades, then leave it alone for the whole session.
- Find the largest clear swing. Zoom out until one obvious move dominates the screen, and treat its start and end as your outer boundary.
- Mark only significant turns. Use swing points that stand clear of the surrounding bars, not every minor wiggle.
- Decide five or three. Ask whether the move in front of you splits into five legs or into three, before you label anything.
- Test the three hard rules. Check wave two, wave three and wave four against the conditions that void an impulse.
- Write the invalidation price. Note the exact number that would force a relabel, and put it beside the chart.
Step six converts the whole exercise into something usable. A count without a number attached absorbs any outcome and commits to nothing.

Repeat the same order every session. Traders who begin from a conclusion always find the labels that support it.
Pick the Chart Before the Labels
Order matters more than people expect. Choosing a timeframe after you spot a shape lets the shape choose the chart, which is backwards.
Swing traders generally settle on the daily and four-hour charts. Those two cover moves that last days to weeks, which suits most retail holding periods.
Below the hourly chart, counting gets noisy quickly. Session opens, data releases and thin Asian hours all create swings that mean very little.
Our guide to the three Elliott wave rules covers the conditions you test at step five. Learn those before you spend time on ratios.
Choosing a Degree to Work On
Every wave contains smaller waves and sits inside larger ones. Deciding which layer you actually trade removes most of the confusion.
Match the Degree to Your Holding Period
Pick the degree whose waves last roughly as long as your trades. A position you hold for a week needs waves measured in days, not in minutes.
Then ignore the rest for the moment. Counting three degrees at once produces charts nobody can read a fortnight later.
Label the degree beside every wave. Roman numerals, plain digits and bracketed letters all work, as long as you keep one system for good.
Look One Degree Up and One Down
Two neighbours give you plenty of context. The degree above tells you which direction carries weight, and the degree below shows whether the current leg looks complete.
Conflicts deserve respect. A four-hour count that fights the daily structure earns a smaller position, or none at all.
Our page on multi-timeframe analysis covers how to keep those views aligned without drowning in charts.
Keeping the Notation Straight
Elliott named each scale, from Grand Supercycle down to Minute and smaller. Practical work rarely needs more than two or three of those names.
Notation carries the degree on the chart. Analysts use roman numerals, plain digits and letters in different cases, so one screen can hold three counts without confusion.
Adopt a single scheme and stay with it. Mixing styles turns a chart review a month later into guesswork about what you meant at the time.
Colour helps as much as symbols. One colour per degree lets you strip a layer off the chart without deleting anything.
Counting Currency Charts
Elliott studied stock indices, and currency charts differ in ways that matter. Spot forex runs around the clock, so daily bars flow session to session without opening gaps.
Wave endings therefore sit at exact prices. Equity analysts often argue about which side of a gap a wave finished on, and that argument never arrives here.
Volume offers less help, though. Your platform shows tick counts rather than traded size, so structure and levels carry more of the load.
Check the mirror pair when a count looks murky. A tangled advance on one chart sometimes reads perfectly as a decline on the pair that trades against it.
Where a Count Actually Helps
Wave analysis earns its keep at the edges of a move. Two situations reward it far more than the middle of a trend does.
Late in a Fifth Wave
Structure suggests the move has matured. That reading pushes you toward trimming winners rather than adding to them, and toward tighter stops on the rest.
Nothing about it justifies a short position on its own. A fifth wave can extend for weeks past the point where everybody expected the top.
Use the count as a brake instead. Reducing exposure costs little when the trend continues and saves a great deal when it does not.
After a Completed Correction
The opposite edge offers the better trade. A three-wave pullback that finishes near an obvious level gives you direction, a stop and a reason in one place.
Wait for price to confirm the turn. A close back through the correction’s own structure beats guessing the exact low.
Then let the level define your risk. The count merely explains why that level deserved your attention in the first place.
Standing Aside in the Middle
Mid-trend counts help least. Wave three can extend far beyond any reasonable projection, so the label rarely changes what a trend follower would do anyway.
Trade the trend on its own merits there. Pullback entries, moving-average structure and prior levels all work without a single wave label.
Save the counting effort for the turns. That is where structure genuinely changes your decision rather than decorating it.
Reading a Correction in Progress
Corrections cause more trouble than impulses. They arrive in several shapes, they take longer than expected, and they tempt traders into calling the turn early.
Start by counting the legs. Three legs against the larger trend suggest a correction; five suggest something bigger has begun.

The chart above carries a three-wave move higher on AUDJPY. Wave B gives back roughly 68 percent of wave A, then wave C covers almost exactly the distance wave A did.
Where the Correction Might End
Two landmarks help. Corrections often finish near the territory of the previous fourth wave of one smaller degree, and wave C frequently runs a similar length to wave A.
Watch both as zones rather than prices. Price stops short of these areas as often as it reaches them.
Our deep dive on Elliott wave corrective patterns covers zigzags, flats and triangles in detail.
Turning It Into an Entry
Take the trade from a level, never from a label. An old swing low, a prior reaction high or a session extreme all give you something concrete.
Layer the count on top for direction. When the structure and the level agree, the trade rests on more than one reading.
Then size from the stop distance. Our free position size calculator turns the gap between entry and stop into a lot size in seconds.
Our page on support and resistance covers how to pick levels worth trading around.
Writing a Preferred Count and an Alternate
Serious wave analysts never publish one label alone. They rank two readings and name the price that switches between them.
The Switch Price
One number does the heavy lifting. It marks the level where the preferred reading dies and the alternate takes over as your working view.
Choose something structural. The origin of wave one, the extreme of wave four or the start of wave A all serve well.
Write it before you trade, not after. A switch price invented mid-drawdown always lands conveniently far from the current price.
The panel below sets a preferred count beside its alternate, which is the habit that prevents most of the errors listed further down.

A Template You Can Reuse
Keep the note short enough to write every weekend. Four lines cover it: preferred count, what it implies, alternate count, and the switch price.
Add a screenshot with the levels drawn. Words drift in memory, while a dated image settles arguments with yourself months later.
Store the lot in one place. Our free trade journal keeps the note, the chart and the outcome together.
Download the complete indicator database
Put these concepts on your charts. One email unlocks the full library of 1,380+ indicators with compiled MT4 and MT5 files, plus my TradingView scripts. No paywall, no spam, unsubscribe any time.
Get free access to my indicator database
One email unlocks 1,380+ free MT4, MT5 and TradingView indicators — the complete library. No single-tool download; you get the whole database.
Sharing a Count Without Overselling It
Wave posts on social media rarely include a switch price. A single confident label lets the author claim credit whichever way price moves.
Write yours the other way round. Name the preferred reading, the alternate, the switch price and what each one implies for your risk.
Judge other people’s analysis by the same test. Analysis without conditions tells you about the author rather than about the market.
Grading Your Counts
Review the file on a schedule. Count how often the preferred reading survived untouched, and how often the alternate turned out closer to reality.
Patterns show up fast. Many traders discover they favour continuation counts during drawdowns, which tells them more than any book could.
Adjust the habit, not the history. Rewriting an old count to look clever destroys the only honest feedback you have.
Common Mistakes When Using Wave Counts
Six habits cause most of the damage. Each one has a simple fix.
Counting Every Wiggle
Zoom in far enough and any move splits into five parts. Start from the largest clear swing instead, then work down only as far as your trade needs.
Trading the Label Instead of the Level
A wave label supplies no stop and no target. Anchor every entry to a visible price, and let the count explain why that price matters.
Falling in Love With One Reading
A single confident label leaves nowhere to go when price disagrees. Rank two counts from the start and name the switch price between them.
Relabelling Quietly
Traders shift labels without admitting the change, then remember themselves as right all along. Date every count and keep the old version.
Forgetting the Degree
A wave three on the five-minute chart means little inside a weekly correction. Note the degree beside every label, or the context evaporates.
Waiting for a Textbook Structure
Diagram waves look tidy and live charts rarely do. Accept a rough count that respects the three rules rather than skipping every move that fails to match the drawing.
A Quick Reference Checklist
Run this list before you act on any count. It takes about a minute once the habit settles.
- Chart and degree chosen before any labels went on the screen
- Largest clear swing marked as the outer boundary of the count
- Move classified as five legs or three legs
- Wave two holding above the origin of wave one
- Wave three not the shortest of waves one, three and five
- Wave four clear of wave one’s price territory
- Preferred count written in one sentence
- Alternate count written in one sentence
- Switch price recorded as an exact number
- Entry anchored to a level rather than to a label
Ten lines, one minute, and most of the usual tangles never form. Traders who skip the last three lines account for most of the frustration around this topic.
Running the Checklist Under Pressure
Live markets tempt everybody to shortcut. Print the list, keep it beside the screen, and work down it even when the move looks obvious.
Watch for the tell-tale rush. Skipping straight to a label usually means you already decided the direction and want the structure to agree.
Slow the process with one rule. Nothing gets a label until the invalidation price sits in writing, which removes most impulsive counts on its own.
When the Count Invalidates
Sooner or later price ignores your labels. What you do in the next ten minutes matters more than the count itself.
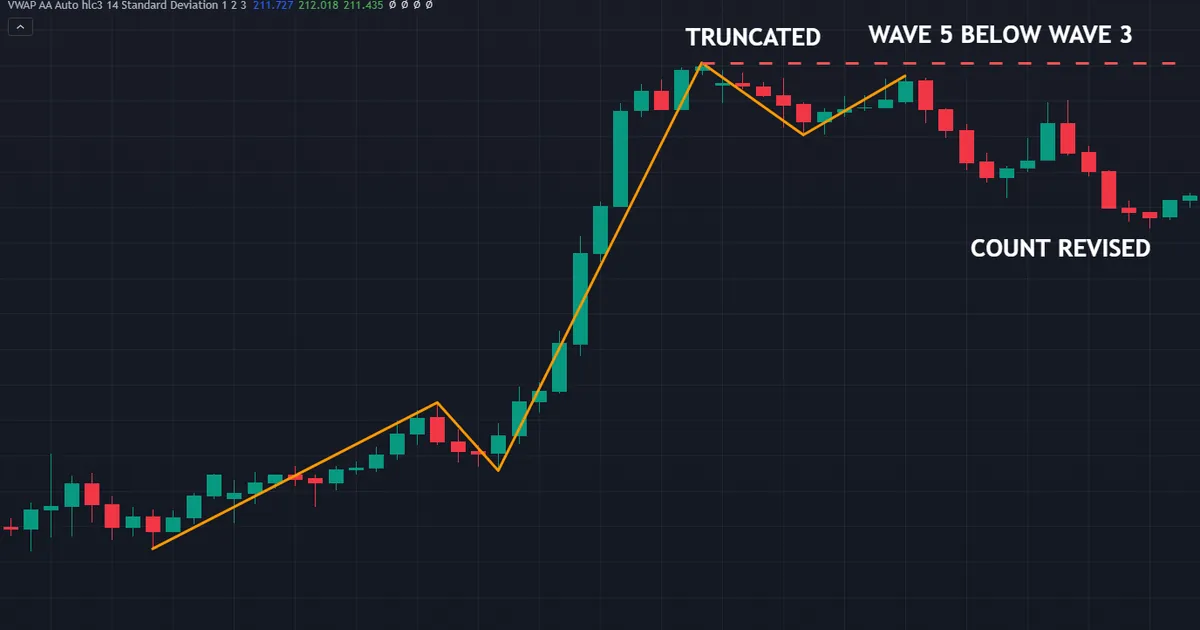
Reading the Truncated Fifth
The chart above shows GBPJPY on the hourly timeframe. Wave five stops at 219.54, just under wave three’s 219.614 high, so the fifth wave truncates and the count needs revising.
Nothing about that outcome breaks a rule. Even so, a fifth wave that fails to clear wave three leaves the sequence looking unfinished, and the labels usually move afterwards.
Truncation frequently follows a powerful third wave. Buyers spend themselves, the final push runs short of fuel, and the reversal arrives ahead of schedule.
What to Do Next
Close the analysis before you touch the position. Decide whether the structure still supports the trade, using the level you entered against rather than the label you liked.
Promote the alternate if it fits. That switch costs nothing when you wrote it down in advance.
Then rebuild from the degree above. Re-read the parent structure first, and only afterwards rework the smaller labels underneath it.
Protecting the Position While You Think
Move the stop to a structural price. The low of wave four, or the origin of the leg you traded, both give you a line worth defending.
Reduce size rather than argue. Halving a position buys you room to think without pretending the count still works.
Never widen a stop to save a label. That single habit turns a small loss into the kind that reshapes an account.
A Worked Invalidation Note
Picture the GBPJPY case above as a weekend note. The preferred count called for a fifth wave above 219.614, and the alternate said the advance had already finished.
One number separated them. A close back beneath wave four’s low switched the reading from the first to the second, without any drama or rewriting.
Price took the second route. The fifth wave stalled at 219.54, the switch price triggered, and the alternate became the working view that evening.
Notice how little emotion that requires. Both outcomes existed on paper before the week began, so neither one arrived as a surprise.
Related Concepts Worth Studying Next
Ratios come next once the mechanics settle. Our page on Elliott wave Fibonacci targets covers the common leg relationships and why they behave as tendencies.
Tooling helps with the drawing work. The Elliott wave indicators archive collects automatic labelling tools you can test on your own charts.
Treat their output as one opinion. Each tool applies somebody else’s counting logic, so check the three rules yourself before you act.
FAQ
How do I know which wave I am in right now?
Honestly, you never know for certain until later. Rank the two most plausible readings, write the price that switches between them, and act on levels rather than on the label. Certainty about the current wave arrives only after price has moved on.
What timeframe suits wave counting best?
Daily and four-hour charts serve most forex traders well. Pick the degree that matches your holding period, then check one degree above and one below for context. Below the hourly chart, news spikes and session opens create swings that carry little structural meaning.
How long should a wave count take to build?
A few minutes per chart once the routine settles. Choose the chart, find the largest clear swing, mark the significant turns, decide between five legs and three, test the rules, then write the invalidation price.
What should I do when a count invalidates?
Promote the alternate you wrote earlier, protect the position with a structural stop, and rebuild the count from the degree above. Avoid widening stops to keep a label alive, because that habit turns manageable losses into serious ones.
Can indicators count waves for me?
Several tools attempt it, and they save drawing time. Each one applies a fixed set of assumptions, though, so two tools often disagree on the same chart. Check the three hard rules yourself before you trade any automatic label.
Which pairs suit wave counting?
Any liquid pair works, provided the chart shows distinct pushes and visible pullbacks. Skip instruments stuck in long overlapping ranges, since three analysts would label them three different ways. A short watchlist counted carefully beats a long one scanned quickly.
How many counts should I keep at once?
Two per chart, ranked. A preferred reading and an alternate cover almost every situation, and a third label usually signals that the structure is too unclear to trade. Add the switch price between the first two and the pair becomes workable.
Is wave counting worth the effort for a beginner?
Learn the three rules and the basic shapes first, then decide. Many traders find the framework useful as context and unhelpful as a trigger, which suggests pairing it with levels and a defined risk. Keep positions small while you test the habit on your own charts. Results are not guaranteed; past performance is not indicative of future results.
External references
- For background on this concept, see Fractal on Wikipedia.
- For broader market context, see Elliott Wave Theory at BabyPips Forexpedia.

About the author
Written by Dominic Walsh, a Forex trader and MT4/MT5 indicator, Expert Advisor and script developer. Every tool on forexmt4systems.com is tested on live charts before release and ships with ready-to-use compiled MT4 (.ex4) and MT5 (.ex5) files. Learn more about the trader and developer behind this site.
How we build, test and correct every tool: Editorial & Testing Policy. Trading carries risk; see the disclaimer.