
Wave analysts lean on a small set of ratios. Elliott wave fibonacci targets describe where a leg has often finished in the past, and nothing stronger than that.
This guide covers the relationships one leg at a time. Wave two against wave one, wave three against wave one, wave four against wave three, and the looser projections traders use for wave five.
Take the caveat first, though. Counts rest on judgement, two analysts label the same chart differently, and a projection built on a shaky count inherits every bit of that uncertainty.
Where Elliott Wave Fibonacci Targets Come From
Elliott linked his wave counts to the Fibonacci series, and modern practice keeps the link. Analysts noticed that certain proportions between legs recurred across many charts.
Recurrence never became a rule. The three hard conditions of a valid count say nothing about ratios, so a count that misses every one of them still qualifies.
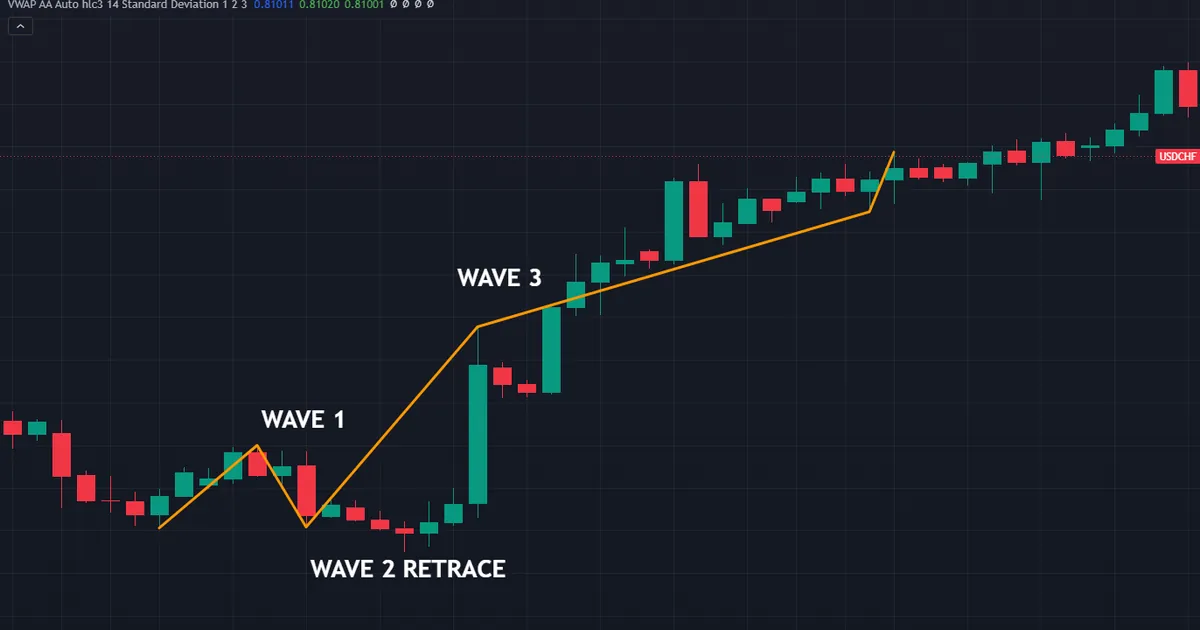
Above sits the basic idea. Wave one, the wave two retracement and wave three all carry labels on the USDCHF four-hour chart, with wave three topping at 0.80155.
The Ratios Themselves
Four numbers do most of the work. Traders watch 0.382, 0.5, 0.618 and 1.618 far more often than any other value.
Two of those come straight from the sequence. Divide any Fibonacci number by the next one and the answer settles near 0.618, while dividing by the previous one settles near 1.618.
The half retracement has no such pedigree. It arrived through Dow theory and stayed because traders found it useful, which tells you something about how this toolkit grew.
Zones, Not Prices
Treat every level as an area. Price reverses a few pips short of a ratio as readily as it reaches one exactly.
A zone earns attention when something else agrees. An old swing high, a session extreme or a round number sitting inside the same band gives the level a second reason to matter.
Our page on whether Fibonacci retracement works covers the evidence question honestly. Read it before you build a process around these numbers.
Why These Ratios Attract Suspicion
Critics raise a fair objection. Draw enough retracement and extension levels on a chart and something lands near every meaningful turn.
Selection bias does the rest. Traders remember the level that held and forget the four that price sliced through last week.
Published testing has produced mixed results. Outcomes shift with the market, the period and the exact rules applied, so nobody has demonstrated a stable edge from ratios alone.
None of that makes them useless. It does mean you should use them to organise attention rather than to justify a position.
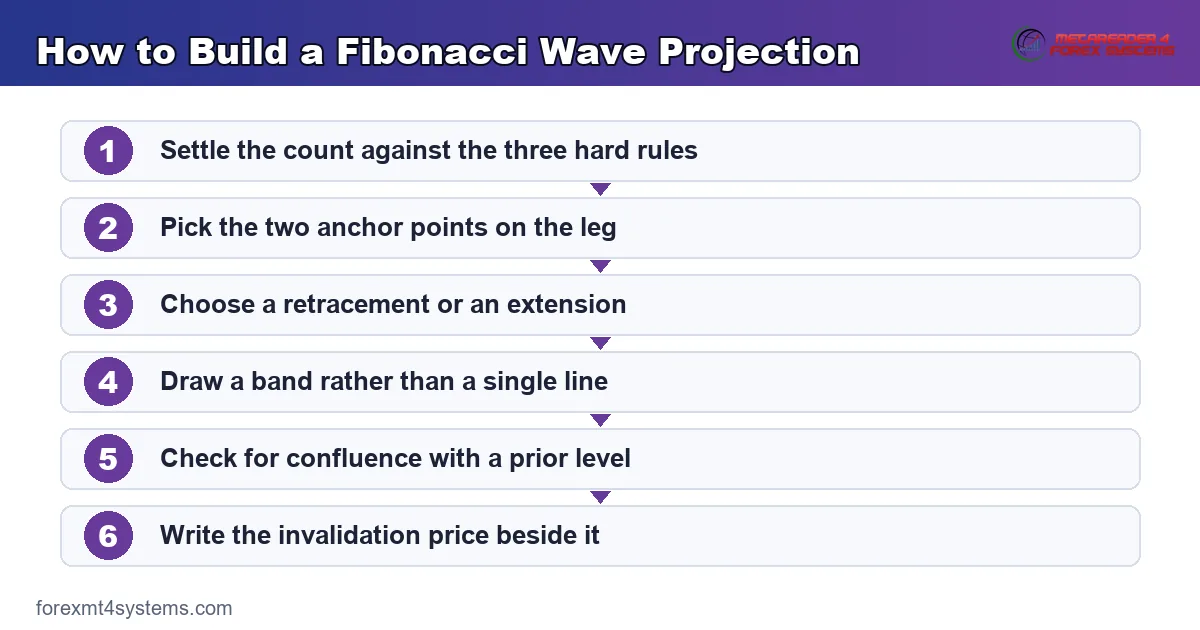
How to Build a Projection, Step by Step
Order matters more than the arithmetic. Work through the sequence below and the common errors mostly disappear.
- Settle the count first. Test the three hard rules before you draw anything, because a ratio on a broken count means nothing.
- Pick the two anchor points. Use the exact start and end of the leg you measure, and keep the same convention every time.
- Choose retracement or extension. Retracements measure a give-back inside a leg; extensions project beyond the leg’s end.
- Draw the band, not the line. Mark the whole area between two ratios rather than a single price.
- Check for confluence. Look for a prior level, a channel edge or a session extreme inside the same band.
- Write the invalidation price. Note the level that would end the count and therefore the projection with it.
Step one carries the whole exercise. Skip it and you produce tidy arithmetic on top of an arbitrary label.
Keep the same anchors on every chart. Switching between wicks and closes halfway through a week makes your own levels impossible to compare.
Wave Two Against Wave One
Wave two gives back part of the first push. Depth here does more to shape a plan than any other single reading.
The Common Band
Most wave two retracements land between roughly half and 62 percent of wave one. Deeper cases reach toward 78 percent without breaking anything.
One hard limit does apply. Wave two never retraces all of wave one, and a move through that origin voids the count outright.
Our guide to the three Elliott wave rules separates that condition from the ratio habits around it.
When Wave Two Runs Shallow
Shallow second waves happen. A give-back near 38 percent suggests strong demand and often precedes a powerful third wave.
Do not treat that as a signal, though. Plenty of shallow second waves lead nowhere at all.
Use the depth for planning instead. A shallow wave two leaves less room between entry and invalidation, which changes your position size rather than your conviction.
Wave Three Against Wave One
Third waves attract the most attention. They usually cover the most ground and move fastest.
The 162 Percent Habit
Wave three frequently reaches about 162 percent of wave one, measured from the end of wave two. That relationship appears often enough that most platforms ship a tool for it.
Frequency never equals obligation. Wave three stops short of the zone regularly, and it overshoots just as often.
Our Fibonacci indicators archive collects tools that draw these projections automatically on MetaTrader charts.
Extended Third Waves
Sometimes wave three runs much further. A reading near 262 percent of wave one marks an extended third, and those moves subdivide into their own five waves.
Extensions change what follows. When wave three extends, waves one and five often cover similar distances, which gives you a rough handle on the final leg.
Only one leg usually extends. Analysts expect either wave one, wave three or wave five to run long, and wave three takes that role most often.
Anchoring the Extension Correctly
Two conventions circulate, and they produce different numbers. Some traders project wave one’s length from the end of wave two, while others measure from wave one’s own origin.
Neither convention wins on merit. Consistency matters far more than the choice you make.
Write your method into your notes. A projection you cannot reproduce next month tells you nothing when you review the trade.
Check the two against each other occasionally. When both land in the same area, that zone deserves a little more attention than usual.
Wave Four Against Wave Three
Fourth waves behave differently from second waves. They drift rather than plunge, and they frustrate traders waiting for a repeat of the earlier dip.
The Shallow Give-Back
A retracement near 38 percent of wave three appears most often. Shallower readings around 24 percent turn up as well, particularly after an extended third.
Depth beyond half of wave three raises a question. It does not break a rule, yet it should make you check whether the leg you called wave three was really wave one of something smaller.
Alternation supplies the reasoning. A sharp wave two suggests a sideways wave four, and the reverse holds as well.
The Overlap Boundary
One line matters more than any ratio here. Wave four stays out of wave one’s price territory in a standard impulse.
Draw that line before you draw the retracement. A ratio band sitting inside wave one’s range warns you the count may already be wrong.
Diagonals form the exception. Those structures allow overlap, and they carry their own conditions.
Wave Five and the Loosest Projections
Fifth waves resist measurement most. Several methods exist, and they routinely disagree with each other.
Equality With Wave One
The simplest approach projects wave one’s distance from the end of wave four. When wave three extended, that estimate lands surprisingly close reasonably often.
A second method uses the whole structure. Project 62 percent of the combined distance of waves one through three from the wave four low.
Treat the spread between methods as information. Two projections far apart tell you the leg carries genuine uncertainty.
Channel Projections
Elliott favoured a channel for this job. Draw a line across the ends of waves two and four, then add a parallel across wave three’s extreme.
The upper line gives a rough landing area. Price often finishes somewhere near it, and it often does not.
Our free Fibonacci calculator handles the arithmetic while you concentrate on the structure.
Fibonacci Time Projections
Some analysts project time as well as price. They count bars between wave endings and look for the same proportions along the horizontal axis.
Evidence here looks thinner still. Bar counts depend on the timeframe you happen to open, which makes the whole exercise fragile.
Treat time work as an experiment. Log the projections, grade them later, and avoid building a plan around one until your own record supports it.
Ratios Between Degrees
Every wave sits inside a larger wave. Ratios therefore appear at several scales on the same screen, which creates more confusion than most guides admit.
Measure Within One Degree
Compare legs of the same degree only. A four-hour wave three measured against a daily wave one produces a number with no meaning behind it.
Note the degree beside every projection. A band drawn from hourly swings deserves far less weight than one drawn from weekly swings.
Colour the levels by degree as well. Stripping one layer off a busy chart then takes a single click.
When Two Degrees Agree
Occasionally bands from different degrees overlap. That coincidence gives the zone a second reason to matter, much as an old swing high would.
Weight it accordingly, without overstating the case. Two lines agreeing tells you where other traders may watch, not what price will do.
Then look for a reaction. A zone earns a trade only once price shows something at it that you can define risk against.
Ratios Inside Corrections
Corrective structures carry their own relationships. They matter because most traders spend more time waiting through corrections than riding impulses.
Wave B measures against wave A, and wave C measures against wave A too. Those two readings do most of the classification work.

The chart above shows a three-wave decline on EURUSD weekly. Wave B recovers close to half of wave A, then wave C covers almost exactly wave A’s distance.
Wave B Against Wave A
Depth names the family. A recovery between roughly 38 and 62 percent points toward a zigzag, while a recovery near 90 percent or beyond points toward a flat.
Deeper cases exist in both families. Our page on Elliott wave corrective patterns covers the shapes and their variants in detail.
Wave C Against Wave A
Equality appears constantly. Wave C running the same distance as wave A shows up across zigzags and flats alike, exactly as the EURUSD example does.
Extended cases cluster near 162 percent. Traders watch both zones and treat neither as an appointment price must keep.
Download the complete indicator database
Put these concepts on your charts. One email unlocks the full library of 1,380+ indicators with compiled MT4 and MT5 files, plus my TradingView scripts. No paywall, no spam, unsubscribe any time.
Get free access to my indicator database
One email unlocks 1,380+ free MT4, MT5 and TradingView indicators — the complete library. No single-tool download; you get the whole database.
Common Wave Ratios Worth Watching
The panel below gathers the relationships that recur most. Keep it beside the chart while the vocabulary settles.

Reading the Panel Properly
Every entry describes a tendency. None of them constrains price, and none of them belongs in the rule list.
Use them to prepare rather than to predict. Knowing where a leg has often stopped tells you where to watch for evidence of a turn.
Then demand that evidence. A ratio alone offers no reason to trade, while a ratio plus a reaction at a level offers something you can define risk against.
Confluence Turns a Ratio Into a Level
A ratio on its own draws a line through empty space. Confluence gives that line a reason to exist.
What Counts as Confluence
Prior structure ranks first. An old swing high, a broken support shelf or a well-tested range edge all carry independent weight.
Channel edges qualify too. A projection landing on the upper line of a wave channel gives you two readings pointing at one area.
Session extremes finish the list. The previous day’s high, the Asian range boundary or a weekly open all attract genuine order flow.
How to Rank Confluence
Count the independent reasons. One ratio plus one structural level beats three ratios stacked on top of each other.
Weight the higher timeframe more heavily. A weekly swing high matters more than a fifteen-minute reaction, whatever the ratio says.
Then demand price action at the zone. Our page on how to use Fibonacci retracement covers the drawing mechanics in detail.
Common Mistakes With Wave Ratios
Six habits cause most of the damage. Each one has a straightforward fix.
Measuring Before the Count Holds
A projection built on a broken count inherits the error. Test the three rules first, every time.
Treating a Ratio as a Target
Price owes nobody a visit to 162 percent. Scale out in parts, and let a trailing stop handle the rest rather than a fixed number.
Drawing Lines Instead of Bands
A single price creates false precision. Mark the area between two ratios and treat the whole band as the zone of interest.
Switching Anchors Mid-Analysis
Wicks one week and closes the next produce levels nobody can compare. Pick one convention and record it.
Stacking Ratios Until Something Fits
Draw enough tools and a level lands near every price. Limit yourself to the legs your count actually names.
Ignoring Confluence
A ratio with nothing else nearby carries little weight. Favour bands that overlap an old level, a channel edge or a session extreme.
Wave Ratio Quick Reference
Keep this table within reach while you practise. Every figure describes a habit rather than a requirement.
| Relationship | Common reading | Status |
|---|---|---|
| Wave 2 against wave 1 | Roughly 50 to 62 percent, sometimes 78 | Tendency |
| Wave 3 against wave 1 | Around 162 percent, extended near 262 | Tendency |
| Wave 4 against wave 3 | Around 38 percent, sometimes 24 | Tendency |
| Wave 5 against wave 1 | Roughly equal after an extended wave 3 | Tendency |
| Wave B against wave A | 38 to 62 percent, or near 90 in a flat | Tendency |
| Wave C against wave A | Roughly equal, or near 162 percent | Tendency |
| Wave 2 past wave 1’s origin | Voids the count immediately | Rule |
Notice the final row. One line carries real authority, and every row above it describes a habit.
When the Projection Simply Misses
Sooner or later a projection fails outright. The fifth wave never reaches the zone, and the count comes apart around it.
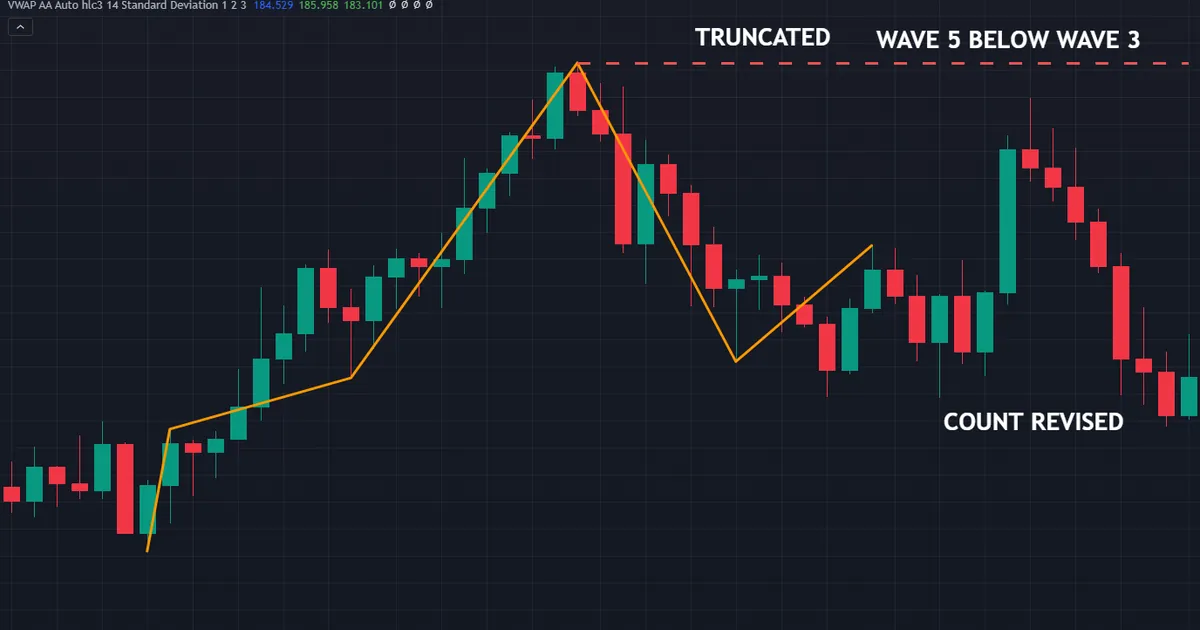
Reading the EURJPY Case
The chart above covers EURJPY on the weekly timeframe. The projection for wave five sat above wave three’s 134.126 high, price stalled at 130.744, and the labels needed revising.
That outcome describes a truncated fifth. Wave five failed to exceed wave three, which leaves the sequence looking unfinished whatever the ratios promised.
No rule broke along the way. Truncation simply happens, and it appears most often after an unusually forceful third wave.
What to Do About It
Stop assuming a projection will print. Traders hold positions for weeks waiting on a zone that price never revisits.
Take partial exits along the route instead. Booking part of a move removes the need for any single number to arrive.
Then protect the rest with a level. The low of wave four gives you a concrete line, and a close beneath it settles the argument.
Grading Your Projections
Log every projection with its outcome. Note the zone, whether price reached it, and how far the move ran either side.
Review the file each month. Most traders find the ratios work as rough guides and fail badly as precise exits, which changes how they scale out.
That record teaches faster than any course. It also shows which legs your own counting handles well.
Grade the misses hardest. A projection that price ignored by a wide margin usually points at a count problem rather than a ratio problem.
Then adjust one thing at a time. Changing the anchors, the degree and the exit rule together leaves you unable to tell which change helped.
Related Concepts Worth Studying Next
Retracements and extensions confuse newcomers constantly. Our page on Fibonacci retracement versus extension separates the two clearly.
Structure comes before arithmetic, though. Our guide on how to use Elliott wave counts covers building the count these ratios sit on, and the Elliott wave theory guide covers the model behind it.
Tooling comes last. The Elliott wave indicators archive collects labelling tools, and every one of them applies somebody else’s assumptions.
FAQ
Which elliott wave fibonacci targets matter most?
Wave two near half to 62 percent of wave one, wave three near 162 percent of wave one, and wave four near 38 percent of wave three. Wave C matching wave A shows up constantly inside corrections. Treat all four as zones to watch rather than prices that must print.
Do these ratios count as Elliott wave rules?
No. The framework carries exactly three hard rules, and none of them mentions a ratio. A count that misses every common relationship still qualifies as valid, provided wave two, wave three and wave four satisfy their conditions.
How far does wave three usually extend?
Around 162 percent of wave one appears most frequently, measured from the end of wave two. Extended third waves reach toward 262 percent and subdivide into their own five-wave structure. Both figures describe habits rather than obligations.
Why does price stop short of the zone so often?
Because a projection describes where a leg has finished before, not where this one must finish. Order flow, data releases and nearby levels all interrupt a move. Partial exits exist precisely because of that gap between projection and outcome.
Should I use wicks or closes as anchors?
Either works, provided you stay consistent. Elliott read price extremes, so wicks fit the original approach, while some analysts prefer closes to filter thin-liquidity spikes. Write your convention down and apply it whether or not you hold a position.
What happens when wave two runs shallow?
A give-back near 38 percent often precedes a strong third wave, though plenty of shallow second waves lead nowhere. The practical effect sits in your sizing: less room between entry and invalidation means a smaller position, not a stronger conviction.
Do Fibonacci time projections work?
Evidence for them looks thinner than for price ratios, and bar counts change with the timeframe you open. Treat time projections as an experiment, log the results, and avoid trading them until your own record supports the habit.
Can Fibonacci levels be traded on their own?
Most experienced traders combine them with something else. A ratio band overlapping an old level, a channel edge or a session extreme carries more weight than a lone line on an empty chart. Define your invalidation price first, size the position from your stop distance, and review the outcome honestly afterwards. Results are not guaranteed; past performance is not indicative of future results.
External references
- For background on this concept, see Fibonacci Retracement Levels at Investopedia.
- For broader market context, see Fibonacci on Wikipedia.

About the author
Written by Dominic Walsh, a Forex trader and MT4/MT5 indicator, Expert Advisor and script developer. Every tool on forexmt4systems.com is tested on live charts before release and ships with ready-to-use compiled MT4 (.ex4) and MT5 (.ex5) files. Learn more about the trader and developer behind this site.
How we build, test and correct every tool: Editorial & Testing Policy. Trading carries risk; see the disclaimer.