
Knowing how to use a position size calculator turns a risky guess into an exact lot in seconds. The tool does the arithmetic, yet you still supply the inputs and read the result, so a little understanding goes a long way.
This guide shows how to use a position size calculator step by step, for a trader who wants the number to be right every time. You will learn each input, where to read it from, and how to feed a live chart into the tool. Worked examples on real pairs tie the output straight to an order ticket.
What a Position Size Calculator Does
A position size calculator converts your risk plan into a tradable lot. You tell it how much you will risk and how far your stop sits, and it returns the exact size. So the tool removes the mental math that trips up so many new traders.
The value is speed paired with accuracy. Sizing by hand invites slips, especially on yen pairs and crosses. A calculator runs the same steps flawlessly, which frees your focus for the trade itself.
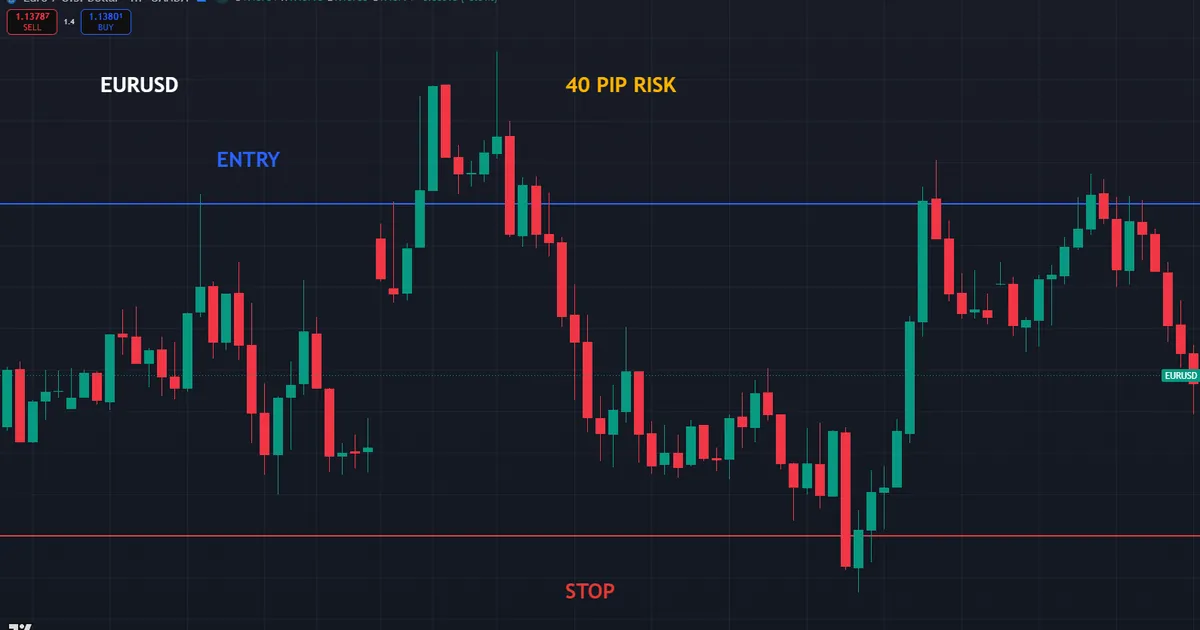
Still, the tool is only as good as what you type. Feed it a careless stop or the wrong pair, and it returns a confident but wrong lot. So learning the inputs matters as much as owning the calculator.
Why Sizing Deserves a Tool
Sizing is the step that caps your loss before a trade begins. Get it wrong, and a single bad run can undo months of work. So it is exactly the kind of task worth handing to a tool that never miscounts.
Manual math also slows you down at the worst moment. When a setup appears, you want the lot fast and correct. A calculator delivers both, so you place the trade while the level still holds.
How to Use a Position Size Calculator, Step by Step
The tool asks for a short list of inputs, and each one has a clear source. Gather them in order, and the lot falls out at the end.
- Account balance. The equity you trade with, which anchors the risk in money.
- Risk percent. The share of the balance you accept losing, usually one or two percent.
- Stop distance in pips. How far your stop sits from the entry, read off the chart.
- Currency pair. The market you trade, which sets the pip value.
- Account currency. The currency your balance is held in, for the final conversion.
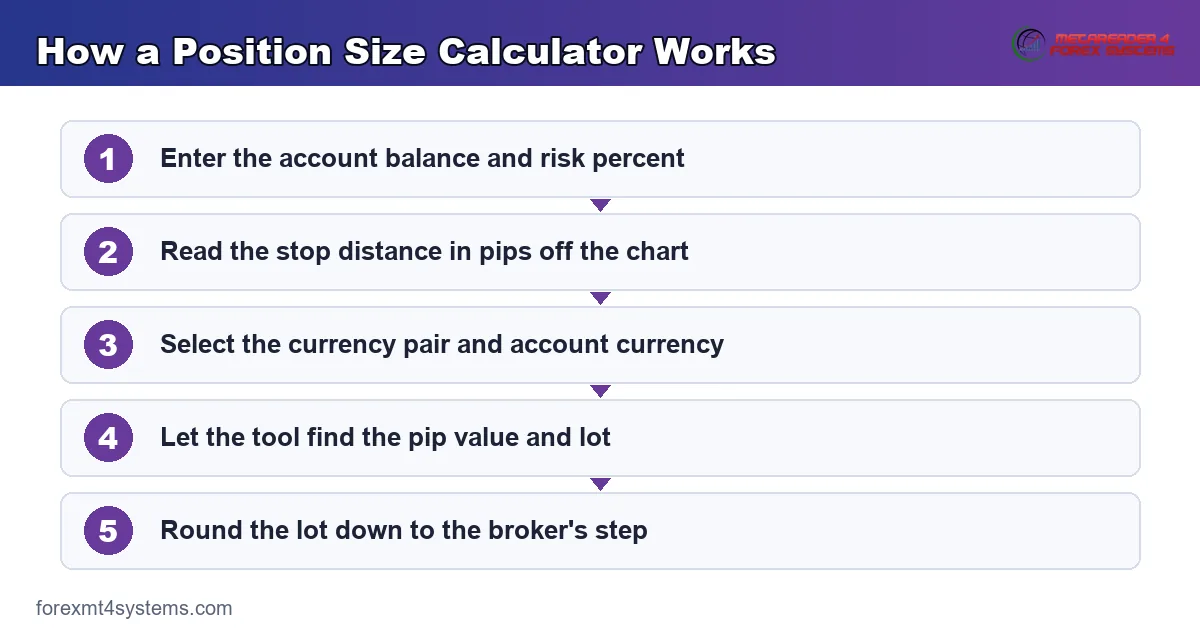
Enter those five, and the calculator returns a lot you can place. The first two set the risk in money, the third spreads it over pips, and the last two convert the result into a size. So every input plays a distinct part in the answer.
Reading the Inputs in Order
Balance and risk percent come straight from your plan. Multiply them, and you have the money on the line for this trade. That figure is the ceiling the whole calculation protects.
The stop and the pair come from the chart and the market. Your stop distance decides how thinly the risk spreads, while the pair fixes what each pip is worth. Together they turn the money ceiling into an exact lot.
Checking the Output Makes Sense
Never trade a lot you have not glanced at for sanity. A one percent risk on a small account should return a micro or mini lot, not several standard ones. So if the size looks huge, suspect a mistyped stop before you click.
A quick reverse check settles any doubt. Multiply the returned lot by its pip value and the stop in pips. When that product matches your planned risk, the number is sound.
Reading Entry and Stop Off a Chart
The calculator needs a stop distance, and that number lives on the chart. So before you open the tool, mark your entry and your stop on the price you plan to trade.
Place the entry where your setup triggers. Then set the stop where the idea is proven wrong, behind a swing or a level. The gap between them, measured in pips, is the input the tool wants.
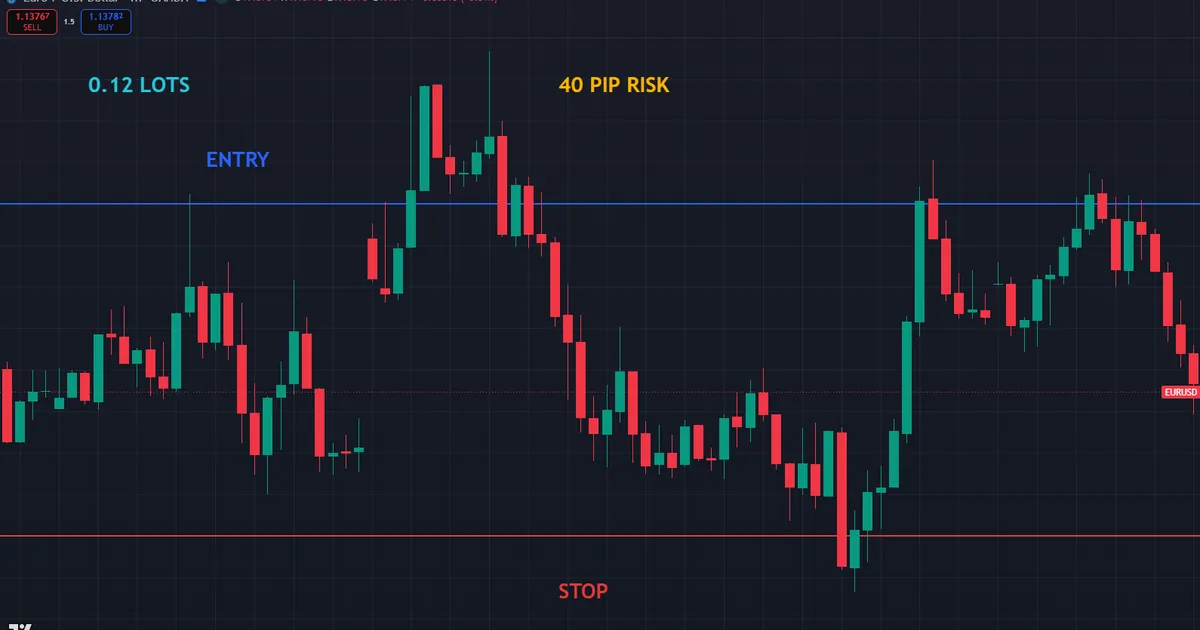
Take a EURUSD trade near 1.14 as an example. Your entry sits at the level, and your stop rests forty pips below it. So you feed forty pips into the calculator as the stop distance, with no guesswork involved.
Turning Price Into Pips
Counting pips is simple once you know the pair. On most pairs a pip is the fourth decimal, so a move from 1.1400 to 1.1360 is forty pips. So an entry and stop at those prices give you the forty you type in.
Yen pairs shift the decimal, since a pip there is the second place. A move from 162.00 to 161.60 is also forty pips. So confirm the pair before you count, and the pip total stays reliable.
Feeding the Chart Into the Tool
With the entry and stop marked, the rest is quick. Read the pip gap, type it into the stop field, and add your balance, risk, and pair. So the chart supplies one input while your plan supplies the others.
Our position size calculator takes those entries and returns the lot at once. You read the stop off the chart, drop it in, and the tool handles the arithmetic. So a live setup becomes a sized trade in a few seconds.
A Full Worked Example
Numbers make the process stick, so run a complete trade. You hold a five thousand dollar account, and you risk one percent on a EURUSD idea near 1.14.
First, the tool multiplies balance by risk. One percent of five thousand is fifty dollars, so a losing trade may cost fifty. That is the risk in money the calculator protects.
Next comes the stop you read off the chart. Your entry and stop sit forty pips apart, so you type forty into the stop field. The tool now knows the money and the distance.
From Inputs to Lot
The calculator divides the fifty dollar risk by the forty pip stop. That points to a pip value of one dollar and twenty-five cents. So the trade needs a size worth that much per pip.
Finally, it converts the pip value into a lot for EURUSD. At ten dollars a pip for a standard lot, one dollar and twenty-five cents is about 0.12 lots. So the tool returns 0.12, and a forty pip loss costs the planned fifty dollars.
Download the complete indicator database
Put these concepts on your charts. One email unlocks the full library of 1,380+ indicators with compiled MT4 and MT5 files, plus my TradingView scripts. No paywall, no spam, unsubscribe any time.
Get free access to my indicator database
One email unlocks 1,380+ free MT4, MT5 and TradingView indicators — the complete library. No single-tool download; you get the whole database.
Using the Calculator on Different Pairs
The same steps hold on every pair, yet the pip value quietly changes. On a yen pair or a cross, one pip is not worth ten dollars, so the calculator adjusts the final conversion for you. That is exactly why the tool asks for the pair.
You do not need to memorize each pip value. Selecting the pair tells the calculator which figure to use. So the only thing you change between pairs is the symbol you pick from the list.
A Yen Pair Example
Try USDJPY near 162.00 on the same five thousand dollar account at one percent. Your risk is fifty dollars, and your stop sits twenty-five pips away. You enter those numbers and select the yen pair.
The calculator uses the yen pip value, near six dollars a pip for a standard lot, instead of ten. So it returns a different lot than a dollar pair would for the same risk. The tool bends the size while you change nothing but the symbol.
A Cross Pair Example
Crosses like EURGBP work the same way, though the pip value shifts again. You still enter balance, risk, stop, and pair, and the calculator finds the right figure. So the routine never changes, only the number under the hood.
This is the real gift of the tool. It hides the messy pip conversions that make manual sizing error-prone on crosses. So you trade any pair with the same five quick inputs.
Setting the Right Risk Percent
The calculator sizes whatever risk you give it, so that one input carries real weight. Set it too high, and every lot the tool returns runs hot. Set it sensibly, and the whole account stays inside a plan you can hold.
Most traders anchor the figure between half a percent and two percent. So a fifty dollar loss on a five thousand dollar account fits the middle of that range. The exact number depends on your comfort and your record.
Why One Percent Is a Common Anchor
One percent has become a default for a simple reason. It keeps any single loss small enough that a normal streak barely dents the account. So a run of five losses costs about five percent, which a steady method recovers with ease.
The number also scales cleanly across accounts. One percent means five dollars on a five hundred dollar balance and five hundred on a fifty thousand dollar one. So the same input works whatever size you trade.
Adjusting the Percent to Your Record
A proven system may earn a slightly higher percent, while a young one deserves less. So let your journal, not your mood, nudge the figure. A deep record of steady results buys a little more room.
Beginners do well to start low and rise slowly. Trading half a percent while you learn keeps mistakes cheap. Because the calculator applies whatever you enter, a modest percent guards you from your own early errors.
Keeping the Percent Steady
The percent should hold firm from trade to trade, not swing with confidence. Raising it after a win and cutting it after a loss undoes the whole plan. So fix the figure, and let the calculator size around it every time.
A steady percent also makes your results readable. When the risk input never moves, your equity curve reflects the method rather than your nerves. So consistency in that one field pays off across a whole record.
Using the Calculator on a Small Account
A small balance meets the broker’s minimum lot sooner than a large one. So the calculator sometimes returns a size below what you can actually trade. Knowing that limit keeps your expectations honest.
On a two hundred dollar account, one percent is only two dollars of risk. A fifty pip stop then needs four cents a pip, which sits below one micro lot. So the smallest tradable size may already risk more than one percent.
Reading a Sub-Minimum Result
When the tool returns a lot below the broker floor, it is telling you something useful. Your chosen risk cannot fit the smallest trade the broker allows. So either the stop is too tight or the balance is too small for that percent.
The honest fix is patience, not force. Chasing sizes below the minimum only invites rounding errors. So many traders grow the balance or widen the stop until a micro lot fits their risk cleanly.
Making the Tool Work at Small Sizes
You can still trade small accounts well with the calculator. Accept a slightly higher percent, or pick trades with wider, sensible stops. So the returned lot lands at or above the broker’s minimum without breaking the plan.
The calculator helps you see this trade-off clearly. Adjust the stop or the percent, and watch the lot move above the floor. So the tool turns a vague worry into a concrete choice you can make on purpose.
Common Calculator Mistakes and Fixes
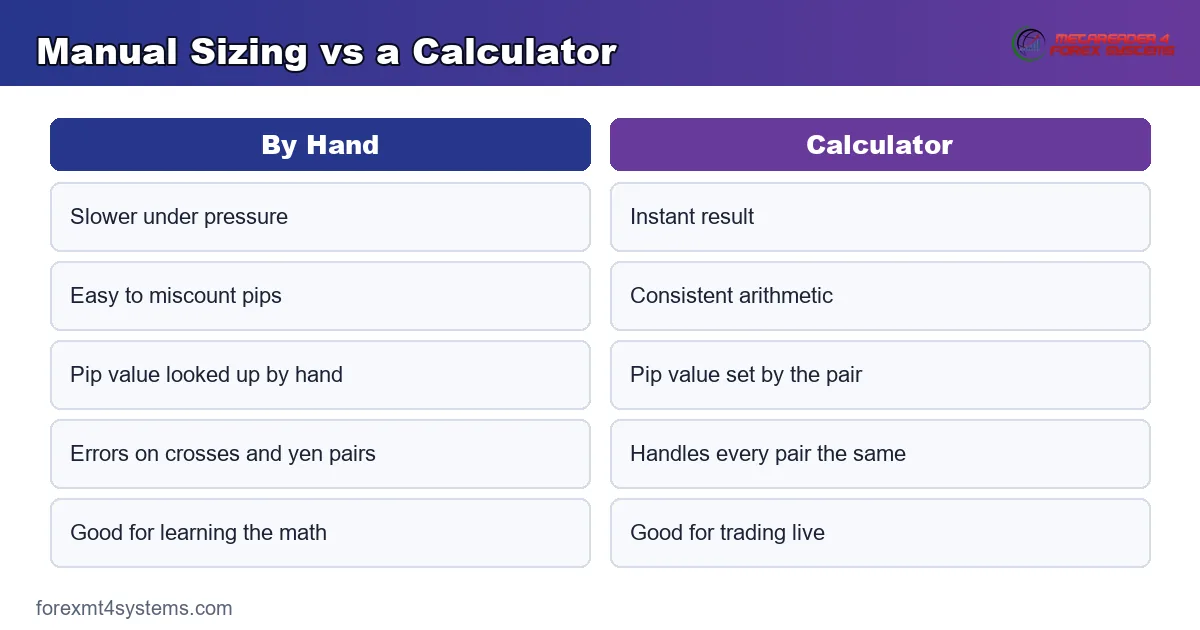
The tool is reliable, yet a wrong input still yields a wrong lot. Most slips trace back to the stop or the pair, and the graphic sums up the fixes.
Typing the Stop in Price, Not Pips
A frequent error is entering a price level where the tool wants a pip count. That mixes up the math badly and inflates the lot. So convert your entry and stop into a pip distance first, then type that number.
Selecting the Wrong Pair
Choosing the wrong symbol hands the tool the wrong pip value. The lot then fits a different market, not yours. So double-check the pair against your chart before you read the result.
Forgetting the Account Currency
A euro or pound account changes the final conversion on many pairs. Leaving the currency at dollars misstates the risk. So set the account currency to match your broker before the tool runs.
Ignoring the Broker Lot Step
The calculator may return 0.12 when your broker trades in 0.01 steps. That figure fits, but 0.123 would not. So round the result down to the nearest allowed step, and keep the risk inside the plan.
Trusting a Stale Balance
An old balance in the tool sizes today’s trade on yesterday’s account. After a run of wins or losses, the figure drifts. So refresh the balance each session, and the risk percent stays true.
When to Recheck the Calculator
Sizing once is not enough if the trade or the account has changed. So a quick recheck before entry catches stale inputs. The tool is fast, which makes a second glance nearly free.
Recheck whenever your balance shifts by a meaningful amount. A string of wins or losses moves the money that one percent represents. So a balance from last week can size today’s trade wrong.
Rechecking After a Stop Change
Traders often nudge a stop while planning the entry. Any change in the stop distance changes the lot the tool returns. So if you widen or tighten the stop, run the calculator again before you trade.
This habit keeps the risk locked to the plan. A moved stop with an old lot lets the real risk drift. So treat every stop adjustment as a signal to resize the position.
The recheck costs only a few seconds against a real cost saved. One resize can be the gap between a planned loss and a painful one. So make the second look a fixed step, and the tool rewards you with a lot that always fits.
Position Size Calculator Quick Reference
Keep this short list beside the tool. Run through it before you accept any lot it returns.
- Enter the current account balance, refreshed each session.
- Set the risk percent, usually one or two percent.
- Read the stop distance in pips off the chart.
- Select the exact pair you plan to trade.
- Set the account currency to match your broker.
- Round the returned lot down to the broker’s step.
Pitfalls and Edge Cases
A few situations bend the clean routine, so keep them in view. The chart below shows how a mistyped stop can balloon the lot the tool returns.
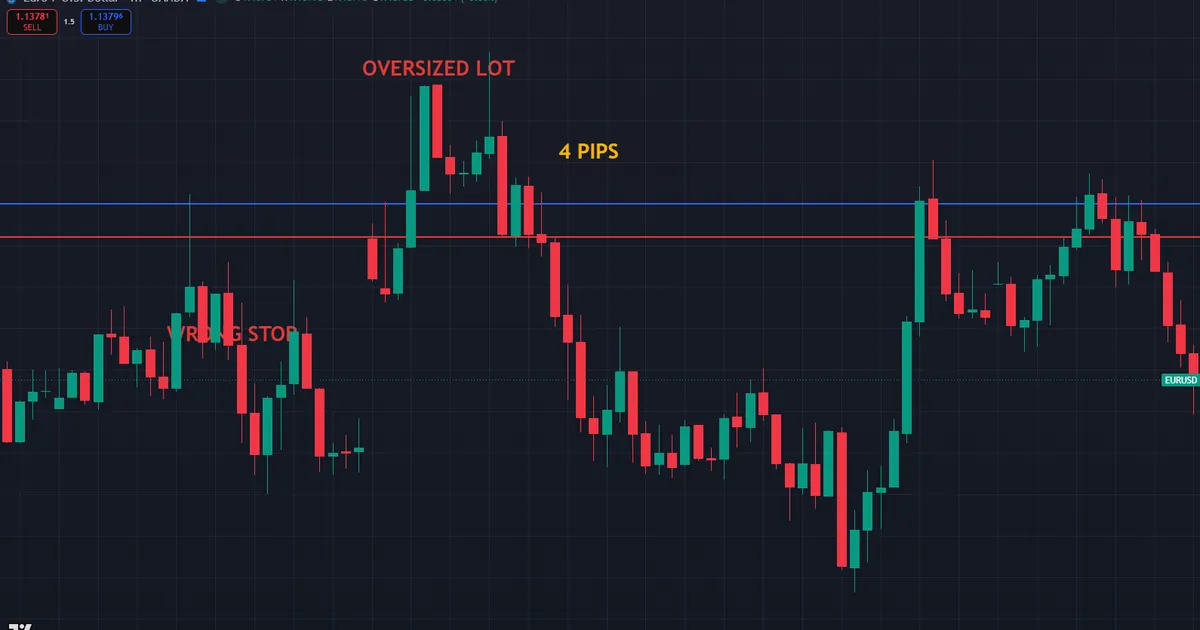
Picture entering four pips when you meant forty. The tool spreads the same risk over a tiny distance, so the lot swells tenfold. That single image is the case for checking the stop before you trust the size.
Very Tight Stops Inflate the Lot
A genuinely tight stop, say ten pips, calls for a large lot to spend the same risk. That size can grow uncomfortable on a bigger account. So respect the broker’s maximum, and remember that a tight stop concentrates risk into a bigger position.
Spread and Slippage Widen the Real Loss
Your stop may fill a little past its level in fast markets. So the real loss can edge above the calculator’s figure. Leave a small buffer in the risk, and treat the tool’s number as a floor rather than a hard ceiling.
Multiple Open Trades Stack the Risk
The tool sizes one trade at a time and cannot see your other positions. Four trades at one percent each put four percent on the line together. So track the combined risk yourself, and size new trades against a total budget.
Related Concepts to Study Next
A position size calculator sits at the center of the risk toolkit, and a few nearby ideas make it whole. The theory behind the tool deepens your trust in it, the percent you risk sets the first input, and the lot units underpin the output.
Start with our guide on position sizing for the math the tool automates. Then read how much to risk per trade to set the risk input, and study how to calculate lot size for the units behind each size. To anchor every stop, see how to use a stop loss, and pair each sized trade with a target using our risk reward calculator.
FAQ
How do I use a position size calculator?
Enter your account balance, risk percent, stop distance in pips, and the pair you trade. The tool multiplies balance by risk, spreads it over the stop, and converts the result into a lot. Round that lot down to your broker’s step, and place the trade.
Where do I get the stop distance to enter?
Read it off the chart by marking your entry and your stop. Count the pips between them, using the fourth decimal on most pairs and the second on yen pairs. Type that pip count into the calculator’s stop field.
Why does the calculator ask for the currency pair?
The pair sets the pip value, which differs across dollar pairs, yen pairs, and crosses. Selecting it lets the tool use the right figure in the final conversion. So the same risk and stop return the correct lot for your market.
What if the returned lot has too many decimals?
Round the lot down to the nearest step your broker allows, often 0.01. Rounding up would push the risk above your planned limit. A slightly smaller lot keeps the loss inside the figure you set out to protect.
Can I trust the tool with my whole trade plan?
The tool sizes one trade well, but it cannot see your other open positions. Track your combined risk yourself, and size new trades against a total budget. Treat the calculator as one careful step, not the whole plan.
Does the calculator account for spread and slippage?
Most tools size from the stop distance alone and ignore spread and slippage. Leave a small buffer in your risk to cover a stop that fills past its level. Size every trade with care, and manage each position closely. Results are not guaranteed; past performance is not indicative of future results.
External references
- For background on this concept, see Notional Amount on Wikipedia.
- For broader market context, see Buying Power at Investopedia.

About the author
Written by Dominic Walsh, a Forex trader and MT4/MT5 indicator, Expert Advisor and script developer. Every tool on forexmt4systems.com is tested on live charts before release and ships with ready-to-use compiled MT4 (.ex4) and MT5 (.ex5) files. Learn more about the trader and developer behind this site.
How we build, test and correct every tool: Editorial & Testing Policy. Trading carries risk; see the disclaimer.