
Two of the most talked-about candles on any chart look completely identical. The hammer vs hanging man question never turns on shape, because both bars print exactly the same geometry.
Both carry a small body near the top of the range, a long lower wick, and almost no upper wick. So the chart around the candle does all the naming work, and this guide shows you how to read that context properly.
Hammer vs Hanging Man: One Shape, Two Locations
Crop either bar out of its chart and hand it to a trader. Nobody could tell you which of the two names it deserves.
The candle itself carries no label. Only the swing that ran into it decides the answer, so the trend does the naming rather than the wick.

A hammer lands after a decline. A hanging man lands after an advance, and traders read those two situations very differently for that reason alone.
The Textbook Split in One Line
Traders call the bar a hammer when price has already dropped into it. The long lower tail then shows buyers taking back a low that sellers had just reached.
Traders call the very same bar a hanging man when price has already climbed into it. Now that tail shows sellers turning up inside a rally, which reads as a warning rather than a rescue.
Neither version predicts the next move. Both simply describe a session where price fell hard and then closed back near its high.
Why the Label Matters at All
Names shape expectations, and expectations shape trade management. So a trader who says hammer looks for support to hold, while a trader who says hanging man watches for a stall.
Mislabel the bar and every decision after it drifts. That single risk justifies the whole comparison.
The Anatomy Both Candles Share
Start with geometry, because the shape rules apply to both names equally. Five checks cover the entire bar.
- Small body near the top. The open and the close sit close together, in roughly the upper third of the session range.
- Long lower wick. The tail below the body runs about two or more times the height of that body.
- Little or no upper wick. Price closes near the high, so almost nothing extends above the body.
- Body colour barely matters. A hollow body reads a touch stronger for a hammer, yet both colours qualify under the classic definition.
- Context above all. Check the direction of the last five to ten bars before you commit to either name.

Run those five checks in order every time. Because step five decides the name, skipping it leaves you with a shape and no meaning.
Measuring the Lower Wick
Divide the wick length by the body length. A ratio of two or more meets the common convention, and three looks cleaner still.
Some traders prefer a percentage instead. They ask that the lower tail cover at least two thirds of the whole range, which produces a similar filter.
Pick one rule and hold it. Consistency matters far more than the exact threshold you settle on.
What Counts as No Upper Wick
Purists want a perfectly flat top. In practice a small nub above the body still qualifies, provided it stays well under the body height.
Once the upper wick grows past the body, the bar drifts into a different family. A long tail on both ends turns it into a long-legged doji or a spinning top instead.
Our deep dive on hammer candlestick meaning walks through the ratio checks bar by bar. Read it alongside this comparison for the full anatomy picture.
Why Location Changes the Reading
A candle records an argument between buyers and sellers. That argument means different things depending on who held the ground before it started.
After a Decline: the Hammer Reading
Price falls for several sessions. Then one bar drops further, finds buyers, and closes back near where it opened.
That tail marks a low sellers could not hold. Because the market had already fallen, the rejection lands exactly where buyers might reasonably step in.
So a hammer earns attention at the base of a pullback, at a prior swing low, or at a level that held before. Floating in open space, it says very little.
After an Advance: the Hanging Man Reading
Now flip the run around. Price rallies for several sessions, then one bar sells off hard during the session before closing near its high.
The close still looks strong, yet the tail shows something new. Sellers turned up inside an uptrend, and they pushed price a long way down before buyers repaired the damage.
Traders treat that as a first crack rather than a turn. Nothing inside the bar settles the argument, so it works as a caution flag and nothing more.
The Same Candle, Two Stories
Sellers reached lower prices in both cases. Buyers rejected those prices in both cases too.
What differs sits entirely outside the candle. One rejection happens where the crowd already leans short, the other where the crowd already leans long.
So the candle supplies evidence, and the trend supplies meaning. Neither half does the job alone.
Where the Two Names Came From
Japanese rice traders built candlestick charting centuries ago. Steve Nison brought the technique to Western screens in the early 1990s, and both names arrived with that translation.
A hammer hammers out a base beneath the market. A hanging man dangles above it like a figure with its legs swinging, which explains the rather grim picture.
Such imagery helps memory and nothing else. Lean on the geometry and the trend instead, then treat the folklore as a label rather than as evidence.
How to Tell Which Context You Are In
Most naming errors trace back to a vague sense of trend. Three quick checks remove nearly all the guesswork.
Read the Swing Structure First
Look at the last three swing highs and lows. Higher highs with higher lows put you in an advance, and the mirror pattern puts you in a decline.
Mark those swings on the chart rather than eyeballing them. Our guide to support and resistance covers the mechanics of finding levels worth marking.
Use a Moving Average as a Tiebreak
Ranges muddy the swing test. A single moving average settles most awkward cases, since price above a rising average leans bullish and price below a falling one leans bearish.
Neither reading turns the candle into a decision. Both simply tell you which of the two names applies today.
Zoom Out One Timeframe
A pullback on the four-hour chart often sits inside a daily advance. So the identical bar can qualify as a hammer on one chart and a hanging man on another.
Decide which timeframe you trade, then name the bar on that chart. Our note on multi-timeframe analysis explains how to stop the two views from fighting each other.
Count the Bars in the Run
Ask how many of the last ten bars closed in the direction of the move. Seven or more gives you a clear run, while four or five gives you noise.
Such a count keeps the trend test objective. Because the number comes from the chart rather than from your mood, it survives a bad morning at the desk.
Traders who prefer a visual test can draw a trend line instead. Either way, settle the method before the candle appears rather than afterwards.
A Worked Example on a Daily Chart
Picture a major pair that rallied for two weeks into an old swing high. On the next session price pushes a fraction higher, sells off through the middle of the day, then closes back near the top of its range.
That bar looks exactly like a textbook hammer. Because the run into it climbed rather than fell, the correct name reads hanging man.

Now the level does the rest of the work. The candle sits under resistance that capped price twice before, so the tail carries more weight than it would in clear air.
Where a Stop Would Sit
Traders who act on the bar usually wait for the following session to close below its low. Only then does a caution flag turn into something tradable.
A protective stop then sits above the high of the hanging man, plus a small buffer for spread and noise. Our free risk-reward calculator converts that distance into a reward figure before you commit.
Notice the order of operations. The level came first, the candle second, the confirmation third, and the stop fourth.
What Confirmation Looks Like
Confirmation simply means a follow-up bar that agrees. For a hanging man that means a close below the candle’s low; for a hammer, a close above its high.
Skip that step and you trade the shape alone. Such a habit turns a context tool into a coin flip, which nobody needs.
A Second Worked Example: the Hammer Side
Flip the first example over and the process stays identical. Only the direction of the run into the bar changes.
Setting the Scene
Picture the same pair falling for nine sessions into a level that halted two earlier declines. Price pokes below that level, buyers pile in, and the bar closes near its high.
Because the prior move fell, this bar earns the hammer name. The level underneath supplies the reason anyone should care about it.
The Entry and the Stop
Confirmation here means a close above the hammer’s high. Traders who insist on that close accept a worse entry price in exchange for evidence.
A stop then sits below the tail, a little under the extreme of the wick. Since the wick often runs long, position size has to shrink to hold the risk steady.
Sizing Around a Long Tail
Long wicks create wide stops, and wide stops force smaller lots. Traders who skip that arithmetic end up risking far more on hammers than on any other setup they take.
So work the size from the stop distance rather than from habit. A fixed cash risk divided by the stop distance hands you the lot size directly.
Download the complete indicator database
Put these concepts on your charts. One email unlocks the full library of 1,380+ indicators with compiled MT4 and MT5 files, plus my TradingView scripts. No paywall, no spam, unsubscribe any time.
Get free access to my indicator database
One email unlocks 1,380+ free MT4, MT5 and TradingView indicators — the complete library. No single-tool download; you get the whole database.
Common Mistakes and Their Fixes
Six errors account for most of the trouble traders meet with these two bars. The comparison panel below sets the two readings side by side.
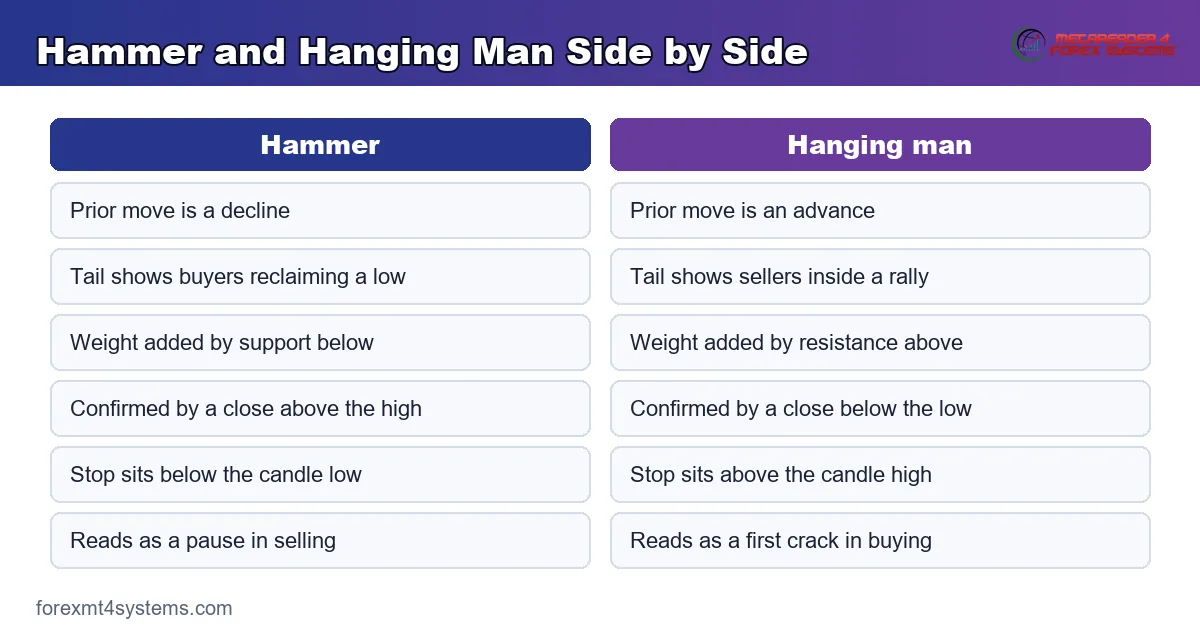
Naming the Bar Before Reading the Trend
Traders spot the long tail, feel bullish, and call hammer. Instead, scroll left first and let the previous ten bars choose the label for you.
Treating a Hanging Man as an Instant Short
One caution bar inside a strong uptrend rarely ends anything. So wait for the close below its low, and treat the bar as a reason to tighten management rather than to flip direction.
Ignoring the Wick-to-Body Ratio
A tail only slightly longer than the body carries almost no information. Measure the ratio, and drop any bar that falls short of your chosen threshold.
Trading Either Bar in Open Space
A rejection matters where someone had a reason to defend. Our guide to candlestick patterns at support and resistance shows how much the same shape gains from a level underneath it.
Confusing It With an Inverted Hammer
The inverted hammer flips the geometry, putting the long wick above the body. Our comparison of inverted hammer vs shooting star covers that mirrored pair, which follows exactly the same trend logic.
Forgetting Which Timeframe You Trade
A four-hour hammer inside a daily downtrend serves a swing trader and a day trader very differently. So fix your working timeframe first, then read the bar on that chart only.
Quick Reference Checklist
Keep this table beside your chart while the habit settles. Every row separates the two names cleanly.
| Check | Hammer | Hanging man |
|---|---|---|
| Prior move | A decline into the bar | An advance into the bar |
| Body position | Upper third of the range | Upper third of the range |
| Lower wick | Two or more times the body | Two or more times the body |
| Upper wick | Tiny or absent | Tiny or absent |
| What the tail shows | Buyers reclaiming a low | Sellers appearing inside a rally |
| Location that adds weight | Support, prior swing low | Resistance, prior swing high |
| Confirmation | Close above the candle high | Close below the candle low |
| Stop reference | Below the candle low | Above the candle high |
Work down the rows in order. The first row settles the name, and the rest settle the trade.
Reading These Candles in a 24-Hour Market
Stock charts open and close at fixed times, so a daily candle has a natural shape. Spot forex runs around the clock, which changes a few practical details.
Your Broker’s Server Time Draws the Bar
Daily candles start whenever your broker rolls the server date. Two brokers on different offsets therefore draw slightly different daily bars from the same market.
So a clean hammer on one platform can look like an ordinary session on another. Check your server offset once, then keep every read on the same feed.
Session Opens Create Long Tails
Liquidity thins between sessions, and thin books produce spikes. Those spikes leave long wicks that resemble rejections without carrying anything like the same weight.
Treat tails printed around the daily rollover with extra caution. A tail built during London or New York hours tells you more, simply because far more traders took part in it.
Tick Volume Adds a Little Colour
Forex platforms show tick volume rather than traded contracts. The figure still tracks activity, so a rejection formed on heavy tick volume shows wider participation than a quiet one.
Use it as a tiebreak and nothing more. Volume never renames the bar, because the trend keeps that job entirely to itself.
Building These Bars Into a Written Plan
A pattern you name differently each week teaches you nothing. Write the rules down once, then let the chart argue with the page rather than with your memory.
Define the Trend Test in Advance
Choose your trend test now: swing structure, a moving average, or both together. Whichever you pick, apply it before you look at the candle rather than after.
Order matters here more than method. Reading the trend second lets the shape colour your judgement, which defeats the entire exercise.
Write the Ratio Threshold Down
Two times the body, three times, or two thirds of the range: pick a figure and record it. A written threshold turns a fuzzy impression into a plain yes or no.
Review the figure every few months. If most of your qualifying bars go nowhere, tighten the threshold rather than abandoning the whole idea.
Log Every Occurrence, Not Only the Good Ones
Screenshot each bar you name, along with the trend read and whatever followed it. After thirty entries your own record teaches you more than any article can.
Keep the log in a spreadsheet or a journal, sorted by name and by location. Patterns in your own results show up quickly once the sample grows.
When the Bar Does Not Follow Through
Failures teach more than textbook examples. The chart below shows a clean shape in the middle of a range, where a single down session is all it produces.
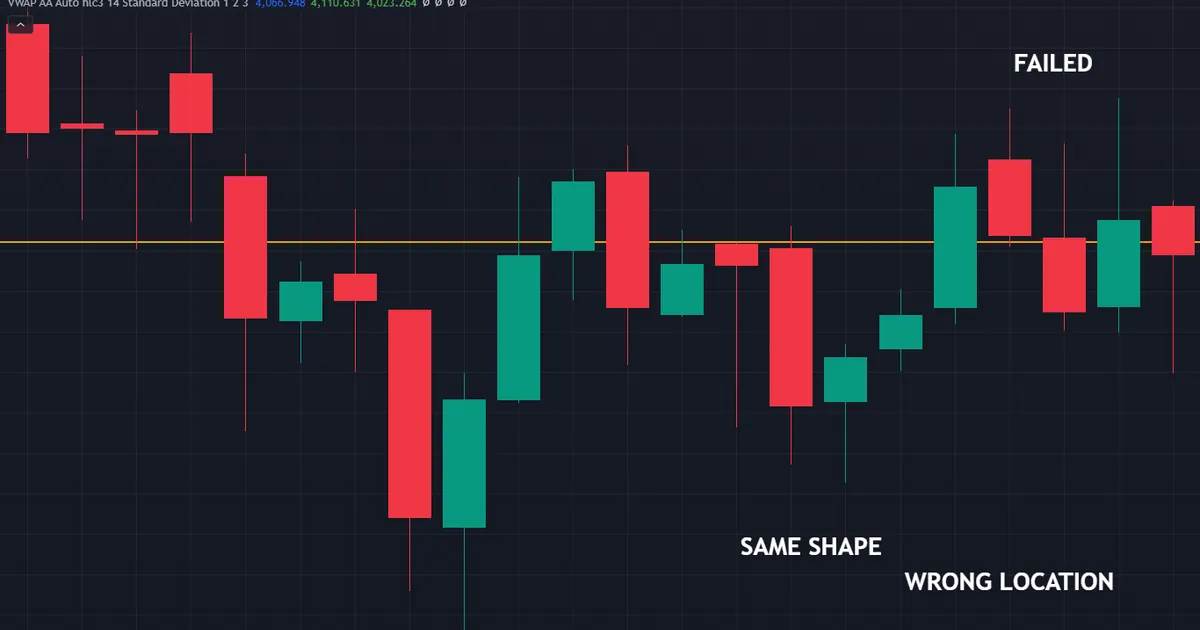
The Trend Absorbs the Warning
A hanging man appears, and price grinds higher for six more sessions. Strong trends absorb single-bar warnings constantly, which explains why confirmation matters so much.
The Low Breaks a Session Later
A hammer forms at support, then the next bar cuts straight through the tail. Because the level failed rather than held, the rejection meant nothing beyond one session of buying.
The Bar Sits Inside a Range
Sideways price produces long tails at both edges all day long. Without a trend running into the bar, neither name really applies, so the pattern loses its whole premise.
The Timeframe Hides the Truth
A daily hammer often contains four-hour bars that tell a messier story. Drop down a level occasionally, and you will see how much detail a single candle hides.
One Bar Rarely Decides Anything
Two or three rejection candles at the same price carry more weight than one. So look for a cluster of tails at a level rather than a single perfect shape.
Traders often call that a double test. The market probed the same area twice and failed twice, which says more than any single session could on its own.
Related Patterns to Study Next
These two bars sit inside a wider family of single-candle rejections. A couple of neighbouring guides finish the picture and stop the names blurring together.
Read our dedicated article on the hanging man candlestick for the bearish side in detail, then our note on pin bar meaning for the price-action name that covers both shapes at once.
Traders who want the pattern flagged automatically can browse our candlestick indicators archive. Treat any such tool as a spotter, though, and keep the trend read in your own hands.
FAQ
What is the difference between a hammer and a hanging man?
Only the prior trend. Both bars show a small body near the top of the range with a long lower wick and little upper wick. A hammer appears after a decline, so the tail reads as buyers defending a low. A hanging man appears after an advance, so the same tail reads as sellers appearing inside a rally.
Does the colour of the body change the name?
No. The classic definitions allow either colour for both bars. Many traders prefer a hollow body on a hammer and a filled body on a hanging man, purely because the close then sits on the side that matches the story. Colour stays a preference rather than a rule.
How long must the lower wick be?
The usual convention asks for a tail roughly two or more times the body height, with little or nothing above the body. Some traders instead require the lower wick to cover two thirds of the total range. Either filter works, provided you apply it the same way every time.
Should I trade a hanging man immediately?
Most traders wait. A single caution bar inside a healthy uptrend often resolves upward, so a close below the candle’s low gives you evidence rather than a hunch. Waiting costs a little entry price and removes a lot of noise.
Can the same candle be both?
On one chart, no. Across timeframes, yes. A pullback low on the four-hour chart can sit inside a daily advance, so the identical session prints a hammer on one view and a hanging man on another. Fix your trading timeframe, then read the bar there.
Do these candles work in forex?
They describe the same buying and selling behaviour in any market, so the geometry transfers cleanly. Spot forex trades around the clock, though, so the daily open depends on your broker’s server time and the shape can shift slightly between brokers. Treat both bars as context rather than as triggers, and confirm every read with what follows. Results are not guaranteed; past performance is not indicative of future results.
External references
- For background on this concept, see Hanging Man Candlestick at Investopedia.
- For broader market context, see Hammer Candlestick at Corporate Finance Institute.

About the author
Written by Dominic Walsh, a Forex trader and MT4/MT5 indicator, Expert Advisor and script developer. Every tool on forexmt4systems.com is tested on live charts before release and ships with ready-to-use compiled MT4 (.ex4) and MT5 (.ex5) files. Learn more about the trader and developer behind this site.
How we build, test and correct every tool: Editorial & Testing Policy. Trading carries risk; see the disclaimer.