
Most candle patterns get their meaning from a wick. A marubozu candlestick works the other way round, because it has no wick worth mentioning at either end.
Learning to read a marubozu candlestick therefore means learning to read absence. Nothing pushed back, nobody rejected the move, and the session ran from one extreme straight to the other.
What a Marubozu Candlestick Actually Shows
The word comes from Japanese and translates roughly as bald head or close-cropped head. Traditional sources use it for a bar with no shadow at all.
In plain terms, the open sits at one extreme and the close sits at the other. Body and range become the same thing.
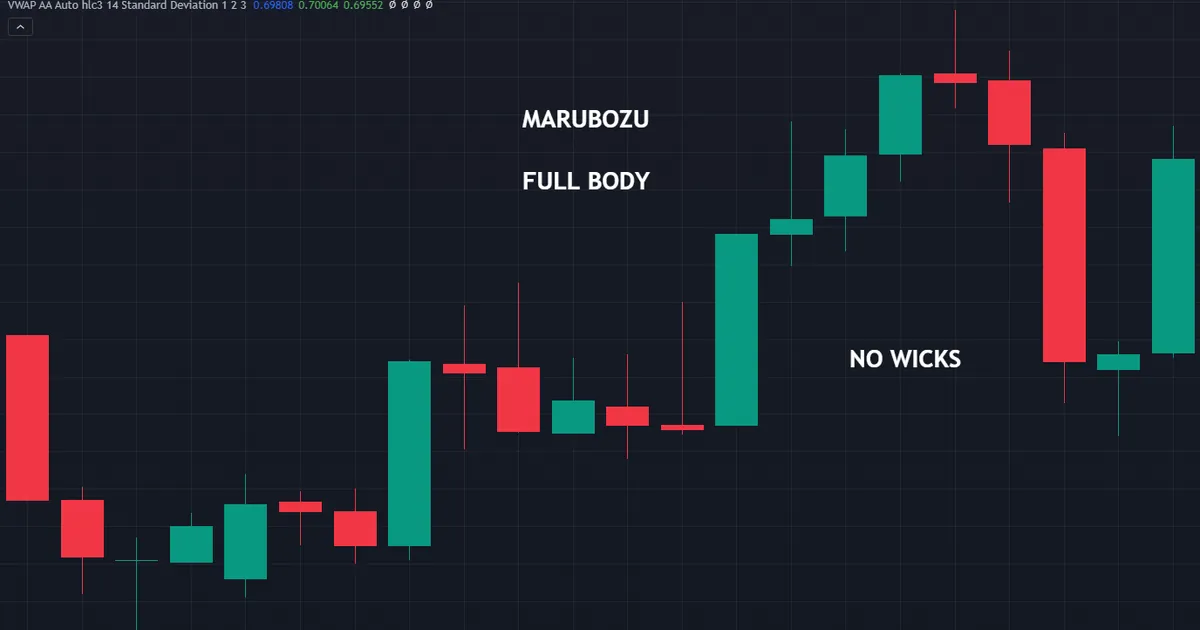
So the session travelled in one direction and held every bit of the ground it took. Traders read that as conviction rather than as a turning point.
Classic texts treat the bar as a continuation shape. That framing matters, because most candle articles focus on reversals and this one does not belong in that group.
Geometry Defined by What Is Missing
Every bar carries four numbers: open, high, low and close. A marubozu collapses those four into two.
Bullish and Bearish Forms
A bullish marubozu opens at its low and closes at its high. Buyers set the first price, sellers never took it back, and the last print of the session marked the top.
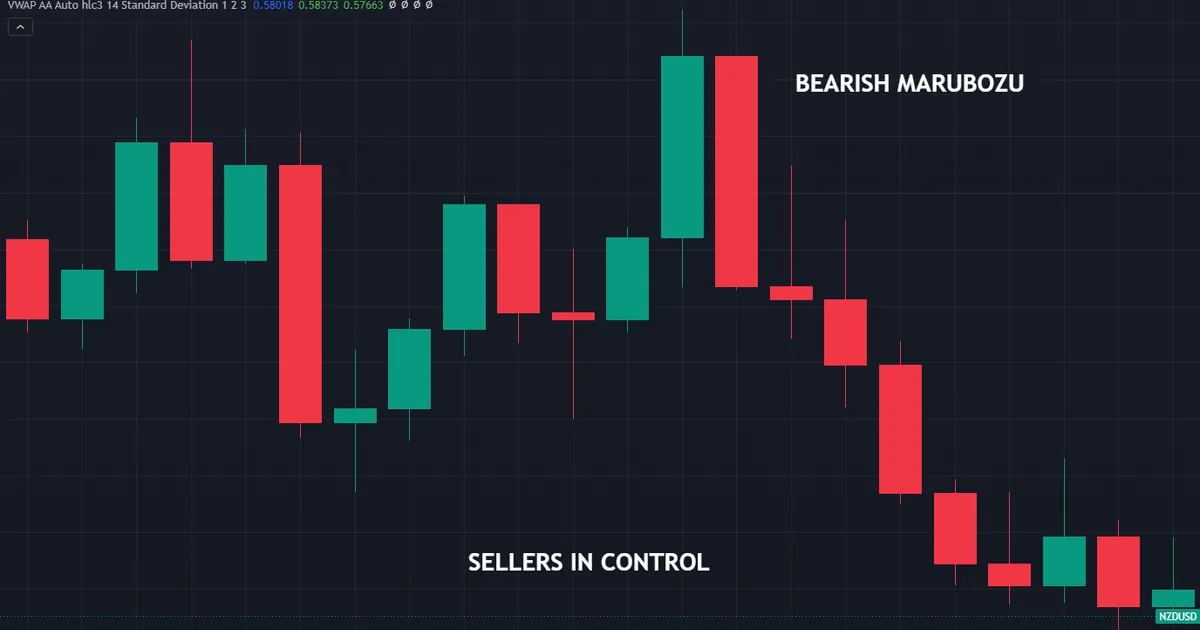
A bearish marubozu mirrors that. It opens at its high, closes at its low, and leaves nothing above or below the body.
Both forms describe the same event with opposite signs. One side started the session in control and finished it in control.
Opening and Closing Variants
Some texts split the shape further. An opening marubozu has no wick on the side where the session started, while a closing marubozu has none on the side where it finished.
Those half-versions carry a softer message. A missing wick at the open says the first price marked the extreme; a missing wick at the close says the session finished on its high or low.
So the closing variant usually draws more attention. Where a session ends tells you more about the balance at that moment than where it began.
The Working Tolerance for a Near-Marubozu
A perfect marubozu barely exists on a modern chart. Spot forex quotes move in fractions of a pip, so an exact match between open and low happens rarely.
Traders therefore apply a tolerance. A common convention treats any wick under roughly five percent of the total range as negligible, which turns the definition into a practical one.
Write your own threshold down. Whether you choose three percent or ten, the number needs to stay fixed so your notes remain comparable from week to week.
What a Near-Marubozu Implies
A bar with a tiny upper wick and no lower wick still tells a clean story. Buyers held every price from the open, then gave back only a sliver at the end.
Compare that with a bar whose upper wick runs a third of the range. Now the session pushed up, met something, and retreated, which changes the reading entirely.
Our guide to candlestick wicks meaning covers those ratios properly. The short version: wick length measures how much ground the winner gave back.
How to Read a Marubozu, Step by Step
The shape takes seconds to spot and rather longer to interpret. Work through the sequence below rather than reacting to the picture.
- Confirm the geometry. Measure both wicks against the total range and check they fall inside your tolerance.
- Check the size. Compare the range against recent bars, because a small wickless bar in a quiet session means very little.
- Read the context. Note whether the bar extends an existing move, breaks a level, or appears from nowhere.
- Find the fuel. Look for a news release, a session open or a breakout that explains the one-way travel.
- Mark the invalidation. The far end of the body gives you a natural line, since a close beyond it undoes the session’s work.
- Size from that line. Convert the distance into a position size before you decide whether the trade suits your plan.
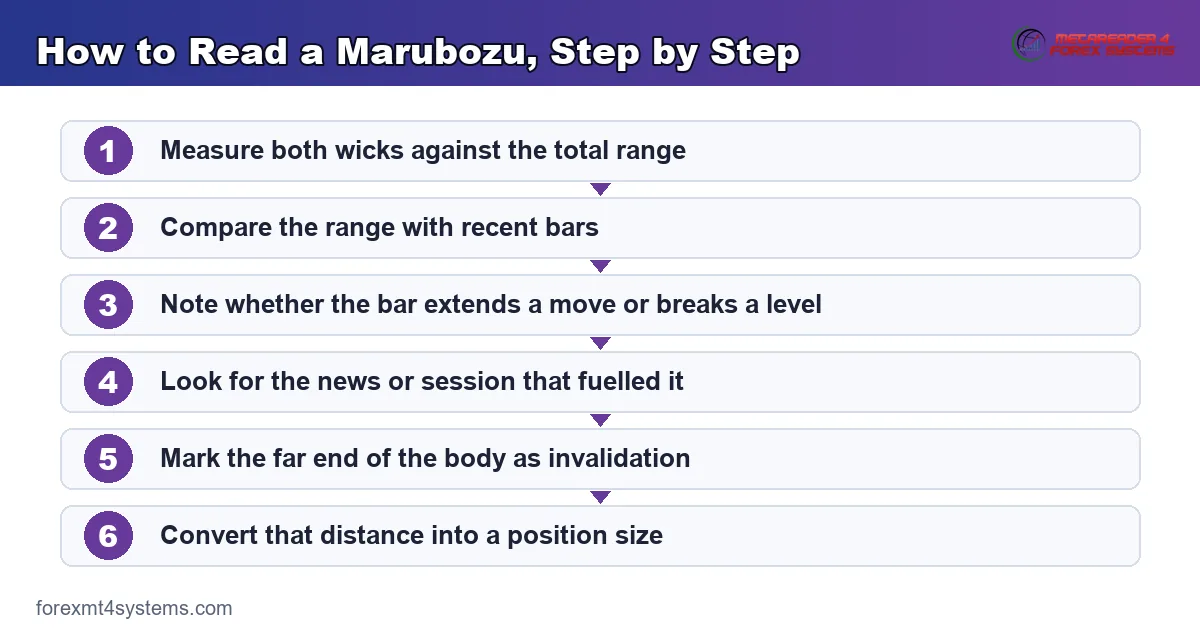
So the geometry only opens the conversation. Everything useful comes from the four steps that follow it.
Because a marubozu tends to run long, the invalidation often sits far away. That single fact eliminates plenty of otherwise tempting entries.
Why This Reads as Conviction, Not a Turn
Reversal patterns share a common feature: price went somewhere and came back. A marubozu contains no such round trip.
Continuation as the Default Reading
When a wickless bar extends an existing move, the reading stays simple. One side kept control for a full session and met no meaningful resistance.
Trend traders treat that as confirmation of what they already believed. The bar adds weight to a direction rather than proposing a new one.
Our note on three white soldiers covers the multi-bar version of the same idea. Three strong closes in a row carry a similar message across a longer window.
The Doji Sits at the Opposite Pole
Put a doji next to a marubozu and the contrast becomes obvious. One bar has body and no wicks; the other has wicks and no body.
A doji reports a session that went nowhere. A marubozu reports a session that went one way and stayed there.
Read our page on doji candle meaning alongside this one. Learning the two extremes first makes everything between them easier to place.
Where It Can Still Mark Exhaustion
One situation complicates the continuation story. A very large wickless bar after an already extended run sometimes marks the final push rather than the start of another leg.
That reading needs evidence beyond the bar. A failure to extend on the following session, or an immediate close back inside the body, provides it.
So treat an outsized marubozu at the end of a long move with respect. Conviction and exhaustion can look identical for one session.
What the Bar Does Not Tell You
A marubozu says nothing about who traded or how much they traded. It records prices, and prices alone.
It also says nothing about the next session. One window of control creates no obligation to produce another.
So keep the claim small. The bar reports that nobody pushed back during a fixed period, and that is the whole of it.
Two in a Row
Back-to-back wickless bars in the same direction sharpen the message. Two full sessions passed without either side giving ground back.
Traders watch the second bar’s range closely. A shorter second bar hints that the move is losing steam even while the shape stays clean.
Three or more in a row starts to look like the soldiers pattern. At that point the run deserves management attention rather than fresh entries.
Continuous Forex Changes the Picture
Spot forex quotes run through the week without a break. Each new bar opens exactly where the previous one closed, apart from the weekend.
Why the Open Sits Flush
On a share chart, the open frequently prints away from the previous close, so an opening marubozu carries extra meaning. Forex bars rarely behave that way.
Instead, the open simply inherits the last price. A bar with no wick on the open side therefore says the market moved away at once, without trading back through the starting point.
That still counts as information. It just means rather less than the equivalent shape on a market that opens once a day.
The Weekend Exception
One genuine gap survives in forex: the Sunday or Monday open. Weekend news can push the first quote well away from Friday’s close.
Bars around that moment behave oddly. Thin books stretch ranges, and a wickless first bar mostly records a repricing rather than a session-long contest.
How Other Markets Differ
Index futures, shares and crypto all treat the concept slightly differently. Anything with a scheduled auction produces cleaner opening extremes, while crypto behaves much like forex.
So port the idea rather than the exact rule. Ask what a lack of give-back means on the instrument in front of you, then set the tolerance to match.
A Worked Example Inside a Trend
Context does the heavy lifting here, exactly as it does for every candle shape. The chart below carries the bearish version, and the sequence underneath follows the bullish one.
Setting the Scene
A pair grinds higher for two weeks, pulling back into an old breakout level each time. On the fourth pullback, the market holds and turns.
The next session opens at its low and closes at its high, clearing the recent swing on the way. No wick appears at either end.
That bar did two jobs at once. It resolved the pullback, and it showed nobody willing to sell into the advance during that window.
Building a Trade Around It
Chasing the close rarely ends well, since the bar has already travelled its whole range. Many traders wait for a shallow pullback into the body instead.
The invalidation sits below the bar’s low, which doubles as the session open. A close beneath that level says the one-way session got fully reversed.
Stop distance then dictates size, never the other way round. Our ATR position size calculator handles the volatility-adjusted version of that sum.
Sizing Against the Normal Range
A marubozu frequently runs well beyond the average range for its pair and timeframe. Treating it like an ordinary bar quietly triples your exposure.
Measure first. Our guide to ATR in trading explains how to establish a normal range before you judge any single session.
Then compare. A bar at twice the usual range demands roughly half the usual position for the same account risk.
What Would Have Cancelled the Idea
Write the invalidation before the entry, always. Here a close below the marubozu low ends the argument, because the whole session then unwinds.
Anything short of that counts as noise. A dip into the body proves nothing, since bodies get retested all the time.
Notice how simple this makes the later review. One line on the chart decides whether you followed your own plan.
Download the complete indicator database
Put these concepts on your charts. One email unlocks the full library of 1,380+ indicators with compiled MT4 and MT5 files, plus my TradingView scripts. No paywall, no spam, unsubscribe any time.
Get free access to my indicator database
One email unlocks 1,380+ free MT4, MT5 and TradingView indicators — the complete library. No single-tool download; you get the whole database.
Where a Marubozu Actually Matters
Location changes the reading, as always. The same wickless bar means three different things in three different places.
On a Breakout
A marubozu that clears a level in one session makes a clean statement. Price left the range and never traded back inside during that window.
Still, a breakout bar leaves you far from the level. Entry after the close means a wide stop, so many traders wait for a retest of the broken level instead.
That patience costs some moves and saves plenty of risk. Pick one approach and record the results rather than switching by mood.
At a Session Open
Forex trades continuously, yet activity still arrives in waves. A bar that opens as London arrives can travel one way for hours with no meaningful pullback.
Check which session produced the bar before you read anything into it. A wickless four-hour bar during the quiet Asian window carries far less information than one built through the London and New York overlap.
So the clock matters as much as the shape. Volatility rises and falls on a schedule, and the candle simply records it.
Inside a Range
Ranges produce these bars in both directions, week after week. A wickless push to the top of a range frequently ends with a wickless push back down.
That pairing describes rotation rather than control. Neither bar carries the weight it would carry inside a trend.
So decide whether the market trends or rotates before you read any single session. The environment sets the meaning.
On Very Fast Charts
One-minute charts produce wickless bars constantly. Many of them span only a pip or two, so the geometry means nothing at all.
Apply a minimum size filter at those speeds. A bar must clear the recent average range before its shape deserves any attention.
Pairing Two Timeframes
A useful habit reads the level on a slower chart and the bar on a faster one. Structure comes from above, timing from below.
That combination keeps the shape honest. A wickless hourly bar pushing away from a daily level tells a better story than the same bar floating in the middle of nowhere.
Just avoid stacking too many charts. Two timeframes answer the question; four usually produce an argument with yourself.
Common Mistakes, and How to Fix Them
This shape attracts a predictable set of errors. Each one has a straightforward correction.
Chasing the Close
The bar has already covered its whole range by the time you see it. The fix: plan an entry on a pullback into the body, or skip the trade entirely.
Demanding a Perfect Bar
Waiting for zero wicks means waiting forever. The fix: set a percentage tolerance, write it in your plan, and apply it consistently.
Ignoring the Bar’s Size
A tiny wickless bar in a dead session says nothing. The fix: require the range to exceed the recent average before you count the shape.
Reading It as a Reversal Signal
Classic sources describe a continuation shape. The fix: ask what the bar extends before you ask what it might turn, and demand extra evidence for an exhaustion reading.
Letting the Stop Set Itself
A long bar creates a long stop. The fix: convert the invalidation level into position size first, then judge whether the trade still fits.
Forgetting the News Calendar
Scheduled releases produce these bars routinely. The fix: check the calendar, and treat a data-driven bar as an event record rather than a shift in control.
Letting the Tolerance Drift
A threshold that moves to suit the chart in front of you produces useless records. The fix: lock the percentage, then let the market decide how many bars qualify.
Quick Reference Checklist
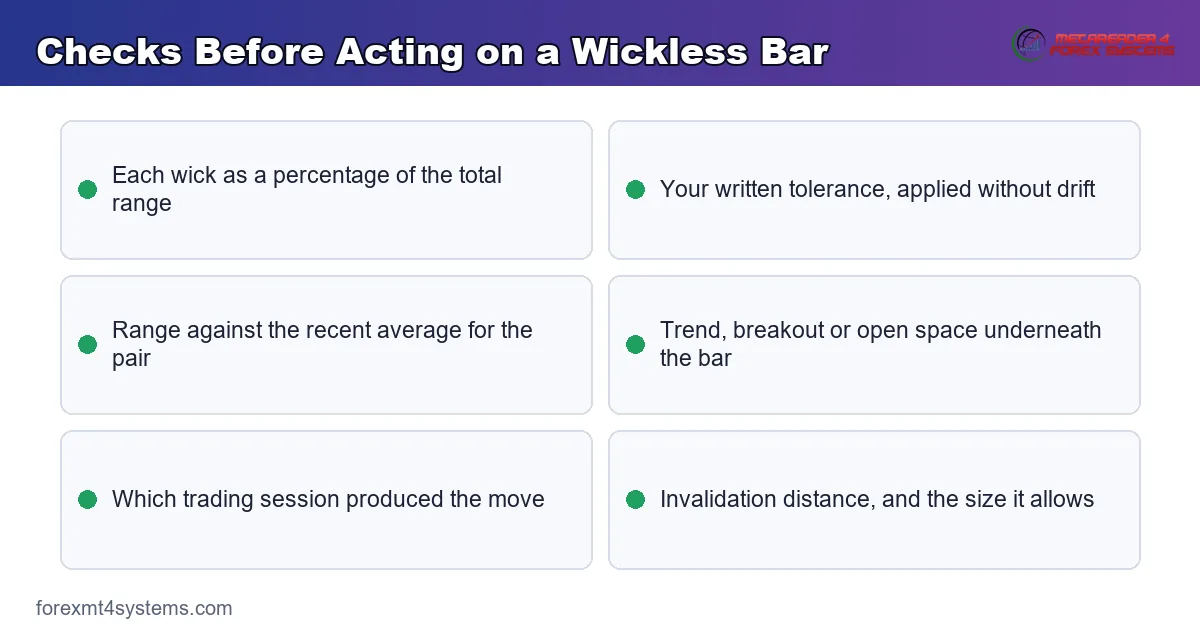
Run these questions before you act on any wickless bar. Seven answers settle it.
- How large is each wick as a percentage of the total range?
- Does that fall inside the tolerance you wrote down?
- How does the range compare with the recent average for this pair?
- Does the bar extend a move, break a level, or appear in open space?
- Which trading session produced it?
- Did a scheduled release drive the travel?
- Where does the invalidation sit, and what position size follows from it?
Marubozu Against Its Nearest Neighbours
| Bar type | Body | Wicks | Core message |
|---|---|---|---|
| Marubozu | Fills the whole range | None worth measuring | One side held control all session |
| Near-marubozu | Almost the whole range | A sliver at one end | Control held, with a small give-back |
| Long body with wicks | Large | Visible at both ends | Control held after a fight |
| Pin bar | Small, at one end | One very long wick | Price went there and came back |
| Doji | Effectively none | Both sides | The session finished level |
When a Marubozu Fails
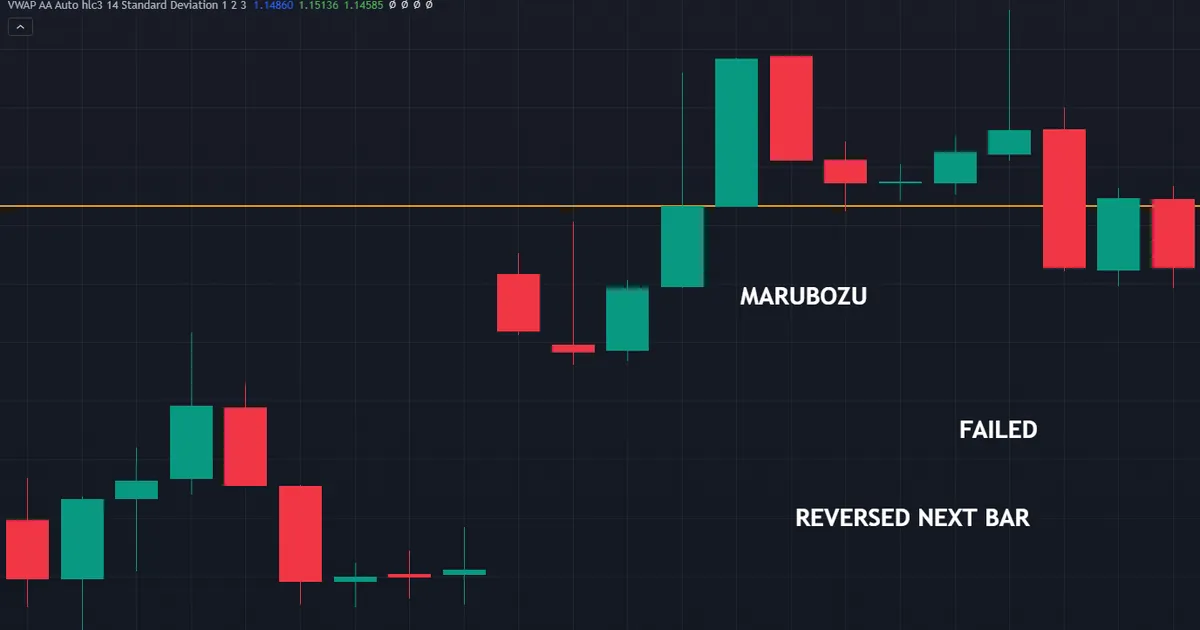
Failures happen constantly, and they teach the shape faster than successes do. The chart below shows a textbook bar that led nowhere.
The Next Session Reverses It
A wickless bar describes one window only. Very often the following session opens and works straight back through it, leaving the conviction reading looking silly.
News Did All the Work
A rate decision can produce a perfect bar in minutes. That shape records a scheduled event rather than a change in who controls the market.
The Move Ran Out of Room
Sometimes the bar closes right beneath a major level. Little space remains for the trade, so a correct reading still produces a poor result.
Weekend and Holiday Distortions
Thin liquidity stretches or compresses bars for reasons unrelated to conviction. Treat shapes formed around holidays and the weekly open with extra care.
Exhaustion Wearing a Continuation Mask
An enormous wickless bar at the end of a long run sometimes marks the last buyer rather than the next wave. Watch the following session closely before adding risk.
A Tolerance Set Too Loosely
Wicks at fifteen percent of the range describe an ordinary long bar. Loose thresholds turn plain sessions into marubozus and blur your whole record.
Related Concepts to Study Next
This bar makes most sense beside the shapes it contrasts with. A short reading list rounds out the picture.
Browse the wider candlestick indicators library for tools that mark these bars automatically, then look through the trend indicators collection for context tools that tell you what the bar is extending.
Volatility matters here more than in most candle work. Our forex volatility calculator helps you judge whether a given range counts as large for the pair you trade.
Then build your own sample. Mark thirty of these bars on the pairs you actually trade, log the session, the range and the tolerance you applied, and note what happened over the next five bars.
That record beats any general statement about the shape. Because the sample comes from your market and your timeframe, the conclusions apply directly to your own trading.
FAQ
What does a marubozu candlestick mean?
It describes a session that opened at one extreme and closed at the other, with no meaningful wick at either end. One side held control from the first print to the last. Classic sources treat the bar as a continuation shape rather than a reversal signal.
Is a marubozu bullish or bearish?
Both versions exist. A bullish marubozu opens at its low and closes at its high; the bearish version opens at its high and closes at its low. The direction of the body tells you which side kept control during the session.
How perfect does the bar have to be?
Exact matches happen rarely, especially on continuously quoted markets. Most traders allow a small tolerance, often treating wicks under about five percent of the total range as negligible. Choose a number, write it into your plan, and keep it steady.
What is the difference between an opening and a closing marubozu?
An opening marubozu has no wick on the side where the session began, so the first price marked an extreme. A closing marubozu has no wick on the side where it ended, so the last price marked the extreme. The closing version usually draws more attention.
Can a marubozu signal a reversal?
It can appear at a turn, but that is not its usual role. A very large wickless bar after an extended move sometimes marks exhaustion instead of continuation. Look for a failure to extend on the next session before you read it that way.
Does a marubozu need heavy volume behind it?
Spot forex reports tick volume rather than true traded volume, so the figure only approximates activity. A wickless bar formed during a busy session generally carries more weight than one from a quiet stretch. Use session timing as your first filter, then treat tick volume as a rough cross-check.
Which timeframe suits this pattern?
Higher timeframes filter out the many tiny wickless bars that fast charts produce. Daily and four-hour bars carry more information, provided the range clears the recent average. Whatever you choose, remember the shape only describes what already happened. Results are not guaranteed; past performance is not indicative of future results.
External references
- For background on this concept, see Marubozu on Wikipedia.
- For broader market context, see Candlestick Charting Explained at Investopedia.

About the author
Written by Dominic Walsh, a Forex trader and MT4/MT5 indicator, Expert Advisor and script developer. Every tool on forexmt4systems.com is tested on live charts before release and ships with ready-to-use compiled MT4 (.ex4) and MT5 (.ex5) files. Learn more about the trader and developer behind this site.
How we build, test and correct every tool: Editorial & Testing Policy. Trading carries risk; see the disclaimer.