
What is heikin ashi, in one sentence? It is a modified candle calculation that averages price values, so a chart of trends looks smoother than the raw bars behind it.
The name translates roughly as “average bar” in Japanese. That translation tells you almost everything, because averaging sits at the heart of every value the chart displays.
So these bars form a chart type rather than a pattern. They deserve a different set of rules from ordinary candles, and this guide spells those rules out.
What Is Heikin Ashi? The Short Answer
An ordinary candle plots four raw numbers straight from the market. A heikin ashi bar plots four derived numbers instead, each one built from an average.
Two of those averages reach backwards. The bar you see today depends on the bar drawn yesterday, which chains the whole series together.
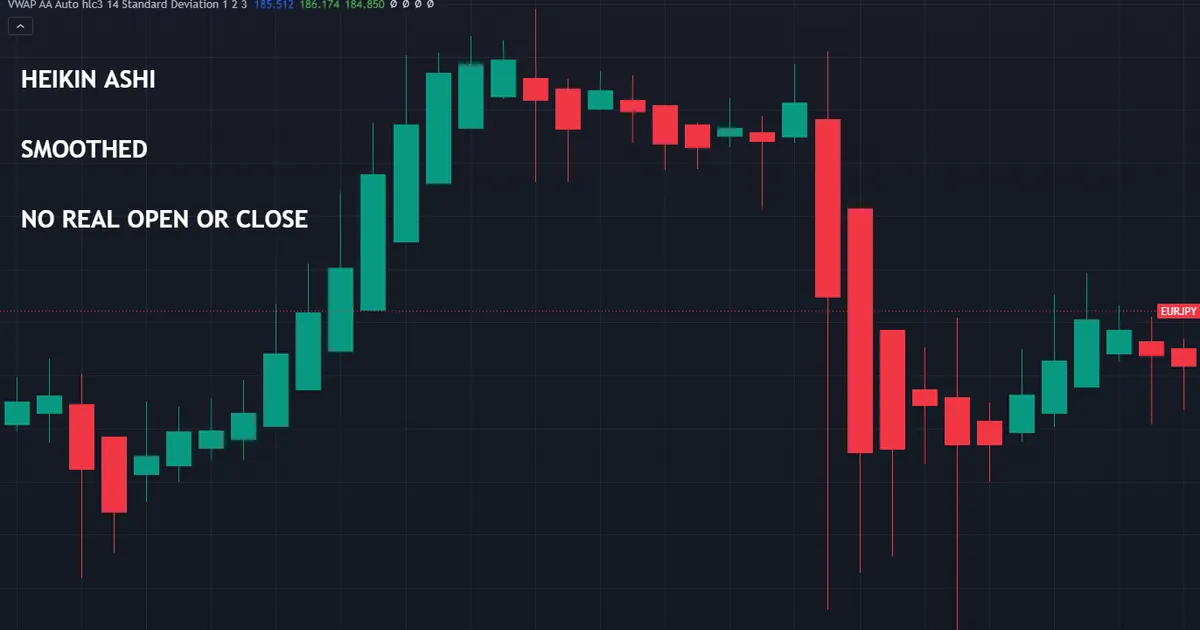
Because of that chaining, the chart smooths naturally. Small counter-moves shrink, and long runs of one colour appear where raw candles would alternate.
An Average Bar, Not a Pattern
Traders sometimes file heikin ashi alongside hammers and dojis. That filing causes trouble immediately.
A hammer describes a real session. A heikin ashi bar describes a calculation applied to several sessions, so the two live in different categories entirely.
Keep the distinction sharp in your notes. Pattern names borrowed from candlestick charting rarely survive the translation to averaged bars.
What the Smoothing Achieves
Noise shrinks, and direction becomes easier to see at a glance. Traders who struggle to hold a position through ordinary chop often find these charts calmer.
That calm costs something, though. The chart hides the sharp reversals that raw candles show honestly.
So the smoothing helps with reading and hurts with timing. Both effects come from the same arithmetic.
Newer traders usually notice the first effect and miss the second. Charts look tidier immediately, while the cost of that tidiness only appears at the entry.
Keep both halves of the trade-off in view. A chart type that answers one question well rarely answers the opposite question at all.
The Heikin Ashi Formula, Line by Line
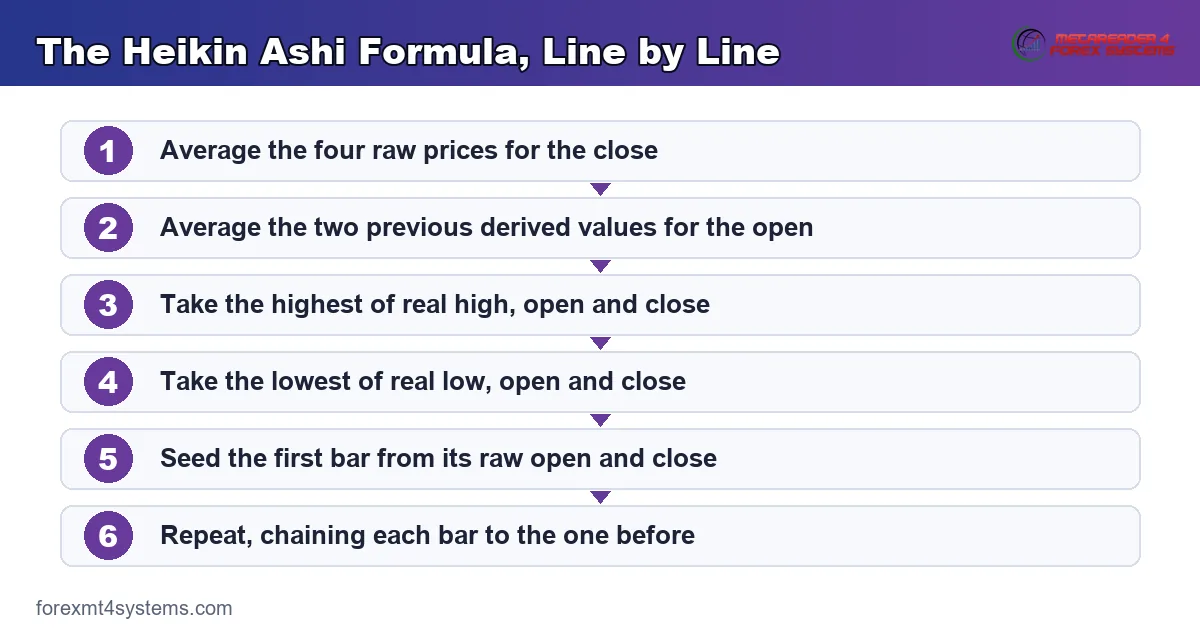
Four short lines produce the whole chart. Work through them in order, because two of them depend on the results of the others.
- Averaged close. Heikin ashi close equals the real open plus high plus low plus close, all divided by four.
- Derived open. Heikin ashi open equals the previous heikin ashi open plus the previous heikin ashi close, divided by two.
- High. Take the highest of three values: the real high, the heikin ashi open, and the heikin ashi close.
- Low. Take the lowest of three values: the real low, the heikin ashi open, and the heikin ashi close.
Notice how many raw inputs vanish into averages. Only the high and the low keep any direct link to the real bar.
The Averaged Close
The first line takes the midpoint of the whole session. All four raw prices contribute equally to the result.
So a session that opened low, spiked high and closed low again produces a middling value. The averaged close sits above the real close, which already introduces a gap between chart and market.
That gap grows during volatile sessions. Wide bars produce the largest differences between the drawn close and the traded close.
The Derived Open
The second line never touches the current bar at all. It averages the two heikin ashi values from the previous bar.
This step creates the chain. Every bar inherits from its predecessor, which is exactly why the series smooths so heavily.
The step also ensures that the drawn open never matches a real price. No trade ever occurred at the midpoint of two derived values from yesterday.
High and Low
The third and fourth lines behave more simply. Each takes an extreme, comparing the real extreme against the two derived values.
So the wick tips usually match the real high or the real low. Those two points remain the chart’s only reliable connection to traded prices.
Seeding the First Bar
The recursion needs a starting value. Most platforms seed the first heikin ashi open with the average of the first bar’s real open and close.
Different seeds produce slightly different early bars. The differences fade quickly as the series runs, though they explain why two platforms occasionally disagree at the left edge of a chart.
A Worked Calculation, One Bar at a Time
Arithmetic settles the idea faster than any description. Take a bar that opens at 1.1000, runs to 1.1040, dips to 1.0980 and closes at 1.1010.
Add those four numbers and divide by four. The averaged close lands at 1.1007, slightly beneath the real close.
Deriving the Open
Suppose the previous bar produced a heikin ashi open of 1.0960 and a heikin ashi close of 1.0990. Average the pair and you get 1.0975.
That figure becomes today’s drawn open. Notice how far it sits from the real open of 1.1000, and notice that nobody traded there today.
The body therefore runs from 1.0975 up to 1.1007. Ordinary candles would have drawn a much smaller body from 1.1000 to 1.1010.
Finishing the High and Low
Compare the real high of 1.1040 against the two derived values. The largest wins, so the drawn high stays at 1.1040.
Repeat the comparison at the bottom. The real low of 1.0980 sits below both derived values, so the drawn low keeps the real number.
One bar therefore blends four real prices with two inherited ones. Repeat that across a hundred bars and the smoothing becomes obvious.
Where the Technique Came From
The method comes from Japan, and its name translates roughly as average bar or average pace. It circulated among Japanese traders long before Western platforms carried it.
Dan Valcu introduced the technique to a Western audience in a 2004 article for Technical Analysis of Stocks and Commodities. Charting software adopted it steadily afterwards.
Why the Origin Matters
The technique arrived as a visual aid for reading trend, not as an entry system. That original framing still describes its best use.
Later marketing pushed it toward signals and strategies. Those claims travelled further than the arithmetic supports.
How to Read a Heikin Ashi Chart
The reading conventions differ from ordinary candles. Learn them properly or the chart will mislead you within a week.
Three features carry nearly all the information: the colour streak, the missing wick, and the small two-sided body.
Colour Streaks
Long runs of one colour mark the smoothed trend. Six green bars in a row on this chart may correspond to eight up sessions and two down sessions on the raw chart.
That compression makes trends obvious. It also makes them look more orderly than they actually traded.
So read a streak as a summary rather than as a record. The real path underneath contained pullbacks the chart chose not to show.
The Missing Wick
A green bar with no lower wick means the derived open matched the derived low. Traders read that as pressure running one way throughout the smoothed window.
The bearish version drops the upper wick instead. Both cases point at persistence rather than at strength in any absolute sense.
Do not confuse a missing wick with a marubozu. The raw session almost certainly had wicks, and the averaging simply removed them.
Streaks of wickless bars draw the most attention from newer traders. They look decisive, yet they describe arithmetic as much as they describe buying pressure.
Body Size as a Momentum Hint
Long bodies inside a streak suggest the smoothed move keeps extending. Shrinking bodies suggest the same move losing pace.
That reading works better here than on raw candles, because averaging strips out much of the single-session randomness. It still lags, so treat it as description rather than as warning.
Compare body size against the previous five bars rather than against memory. A quick visual sweep answers the question in seconds.
Small Bodies With Wicks on Both Sides
A short body with wicks above and below marks a pause in the smoothed series. Ordinary candles would call the shape indecision.
Our guide to doji candle meaning covers that reading on raw candles. The heikin ashi version says something weaker, because averaging created part of the shape.
Many traders treat these bars as a warning rather than an event. The streak may resume, or it may end, and this bar alone cannot separate the two.
Heikin Ashi Versus Standard Candles
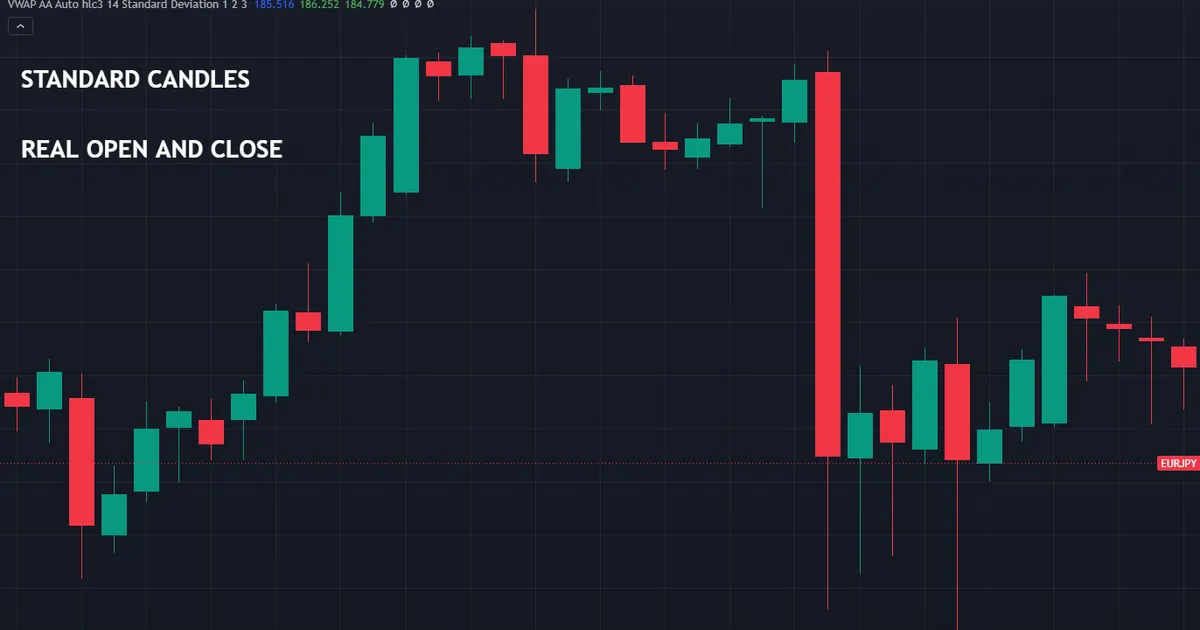
Seeing both chart types over the identical bars settles most arguments quickly. The same market produces two very different pictures.
Raw candles show every reversal honestly. Averaged bars show a cleaner direction and arrive at it later.
What You Gain
Trend legs become easier to hold. Traders who exit good positions early on noise often report calmer decisions on the smoothed chart.
Direction also reads faster across many pairs. A watchlist scan takes less time when small counter-moves disappear.
What You Give Up
Precision disappears first. The drawn open and close no longer correspond to prices anybody traded.
Speed disappears next. Averaging introduces lag, so turns show up a bar or two after the raw chart already showed them.
Our comparison guide on heikin ashi versus candlestick charts works through the trade-off in more detail. Read it before committing to either chart type.
The Limitation You Must Respect
Here sits the part most articles skip. Heikin ashi bars do not show the real open and the real close, and the forming bar can change shape as it develops.
Both facts have practical consequences. Ignore them and your entries, your stops and your backtests all drift away from reality.
The Forming Bar Repaints
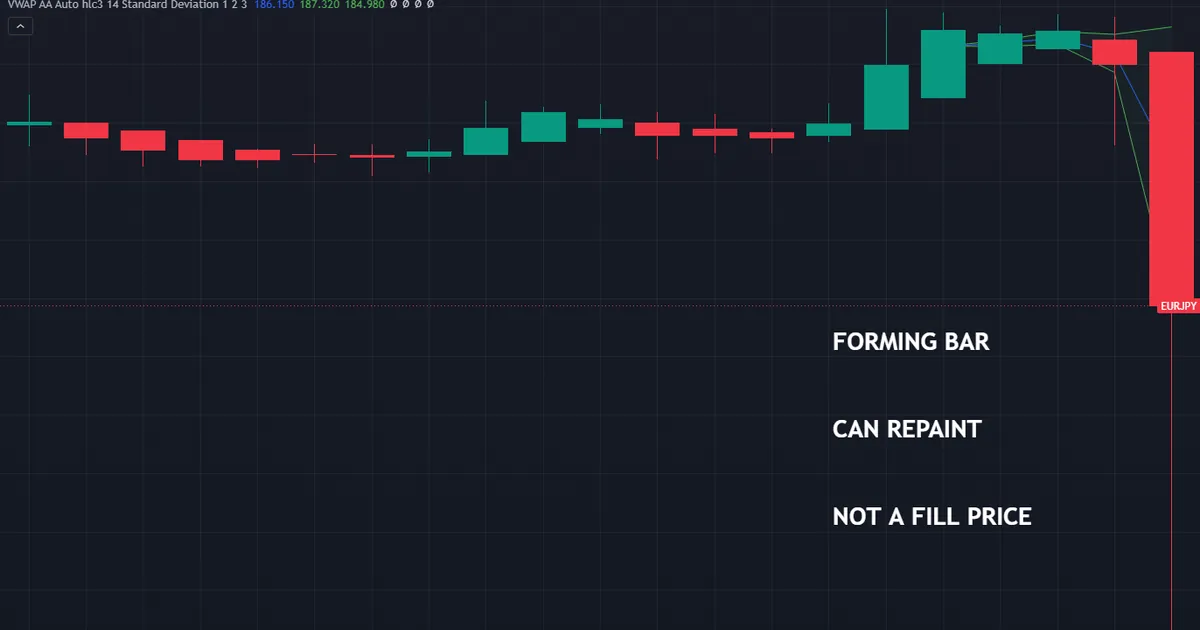
While the current period runs, its averaged close updates with every tick. The bar’s body therefore grows, shrinks and sometimes flips colour before the period ends.
A green bar at the halfway mark can close red. Traders who act mid-bar on a colour they can see effectively act on a value that may not survive.
So treat colour as final only after the close. That single discipline removes most heikin ashi frustration.
Prices You Cannot Trade At
Your broker fills orders at real market prices. The averaged open and close exist only inside the chart’s arithmetic.
Placing a stop at “the low of the heikin ashi bar” therefore risks placing it somewhere the market never went. Always convert the level back to raw prices first.
Many platforms let you overlay a raw price line for exactly this reason. Turn it on and read your stop levels from it.
Backtests Filled at Averaged Prices
This mistake ruins more results than any other. A test that enters at the heikin ashi open records a fill nobody could achieve.
The error flatters performance, sometimes dramatically. Averaged entries land at friendlier prices than the market offered at the time.
So build every test on raw values. Use the smoothed series for the decision, and the raw series for the fill, the stop and the result.
Download the complete indicator database
Put these concepts on your charts. One email unlocks the full library of 1,380+ indicators with compiled MT4 and MT5 files, plus my TradingView scripts. No paywall, no spam, unsubscribe any time.
Get free access to my indicator database
One email unlocks 1,380+ free MT4, MT5 and TradingView indicators — the complete library. No single-tool download; you get the whole database.
Common Heikin Ashi Mistakes and Fixes
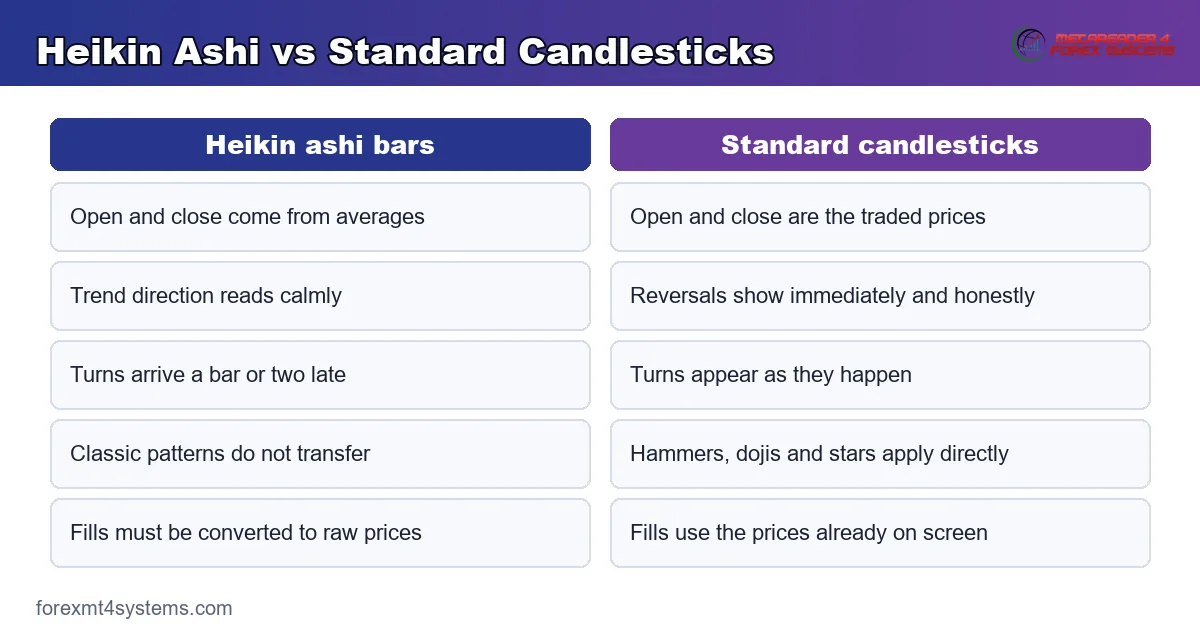
Nearly every error traces back to the same root: forgetting that the two chart types report different things. The comparison panel below sets them beside each other.
Reading Candlestick Patterns on Averaged Bars
Engulfing bars, hammers and stars all assume raw sessions. Apply your pattern rules on the standard chart, then switch across for the trend read.
Acting Mid-Bar on Colour
The colour you can see during the period may not survive to the close. Wait for the period to finish before you treat any bar as information.
Setting Stops From Drawn Values
The averaged open and close never traded. Convert every level to a raw price before it reaches your order ticket.
Backtesting on Heikin Ashi Fills
Averaged entry prices flatter results and cannot be repeated live. Route the decision through the smoothed series and the execution through the raw one.
Expecting Precision From a Smoother
Lag comes built in, so the chart will always turn late. Accept the delay as the price of the clarity rather than fighting it with faster settings.
Switching Charts Mid-Trade
Managing a position on a different chart type from the one that produced the entry invites confusion. Choose your reference before the trade opens and stay with it.
Heikin Ashi Quick Reference
Seven questions cover most of what the chart can and cannot do. Keep them beside your platform.
- Which four raw prices feed the averaged close on this bar?
- Has the current period actually closed yet?
- What is the raw price at the level you plan to use for a stop?
- Does your backtest fill at raw prices or at averaged ones?
- How long is the current colour streak, in bars?
- Does the bar show a wick on one side only, or on both?
- Which chart type will you manage the position on?
Answer them before the order rather than afterwards. Two minutes of checking removes most of the surprises this chart type produces.
When Heikin Ashi Misleads
The chart fails in recognisable ways, and knowing them protects you. The capture below freezes the bar still forming at the right edge, before its averaged values have settled.
Late Turns at the Extremes
Averaging delays every reversal by design. A trader waiting for the colour to flip surrenders part of the move on both ends.
Position sizing absorbs some of that cost. Our guide to ATR explains how to widen a stop sensibly when the entry arrives late.
Quiet Ranges Produce False Streaks
A sideways market still generates runs of one colour on the smoothed chart. Those runs look like trends and lead nowhere.
Check the raw chart before trusting any streak. A range on the standard candles remains a range whatever the averaged version suggests.
Gaps Vanish Into the Average
Weekend gaps in forex mostly disappear into the derived open. The chart then shows a smooth transition where the market actually jumped.
That smoothing matters if a gap sits inside your stop distance. Read the raw chart around every weekend boundary.
Indicators Fed From Averaged Values
Some platforms calculate oscillators from whatever series the chart displays. An RSI reading built on averaged closes differs from the standard one.
Check the input source in every indicator you attach. A smoothed input on top of a smoothing chart doubles the lag without telling you.
Keep the setting explicit rather than assumed. Two traders comparing readings often discover this difference only after a disagreement.
Two Platforms Show Different Bars
Seeding differences and history length can shift early values. Charts starting from different dates occasionally disagree on the left edge.
The disagreement fades further right. Still, never compare two platforms bar by bar without checking how much history each one loaded.
Where the Chart Fits in a Process
Used carefully, the smoothed chart earns a narrow and useful role. Used carelessly, it quietly corrupts every number in your plan.
So assign it one job and keep the rest on raw candles. Most traders who succeed with it follow exactly that split.
A Trend Filter on the Higher Timeframe
Many traders read direction from a smoothed daily chart, then execute from raw four-hour candles. The averaged chart answers a slow question, and the raw chart answers a fast one.
Our guide to moving averages covers a similar division of labour. Both tools smooth, and both belong on the context side of a process.
A Discipline Aid, Not an Entry Tool
Traders who exit winners early sometimes benefit from watching a calmer chart. Fewer visible shocks means fewer impulsive exits.
That benefit stays psychological rather than statistical. Our trade risk visualizer shows the same position in raw terms, which keeps the real exposure in view.
Rules Worth Writing Down
Three lines cover almost every practical decision. Write them into your plan and the chart stops causing accidents.
The first line names the chart type you read direction from. Your second line names the chart type every order price comes from.
Line three states that no bar counts until its period closes. Traders who hold those three rules rarely meet the problems described above.
Reviewing the Split Each Month
Pull your trades and mark which chart produced each decision. Patterns emerge quickly once context and execution sit in separate columns.
Then adjust one line at a time. Changing the whole arrangement at once teaches you nothing about which part helped.
Related Concepts to Study Next
Chart types make more sense once you understand what raw candles report. Two short reads fill the gap quickly.
Start with our overview of candlestick patterns explained, which covers the raw vocabulary this chart type sets aside. The contrast makes both clearer.
For tooling, browse the trend indicators archive and the candlestick indicators archive. Several tools plot smoothed bars alongside the raw series in one window.
FAQ
What is heikin ashi in simple terms?
It is a chart type that averages price values instead of plotting them raw. The averaged close uses all four prices from the current bar, and the drawn open averages the two previous heikin ashi values. The result smooths trends and removes some noise.
What is the heikin ashi formula?
The close equals open plus high plus low plus close, divided by four. Its open averages the previous heikin ashi open with the previous heikin ashi close. High and low then take the extremes among the real extreme and those two derived values.
Does heikin ashi repaint?
The forming bar updates with every tick, so its body can grow, shrink or change colour before the period ends. Closed bars stay fixed. Treat colour as meaningful only after the period actually closes.
Can I place stops using heikin ashi prices?
No. The drawn open and close never traded, so an order at those levels sits somewhere the market did not go. Convert every level back to raw prices before it reaches the order ticket.
Is heikin ashi better than candlesticks?
Neither answers the same question. Averaged bars read direction more calmly and arrive later, while raw candles show reversals honestly and precisely. Many traders run the smoothed chart for context and the raw chart for execution.
Can I backtest a heikin ashi strategy?
Yes, provided every fill, stop and target uses raw prices. Tests that enter at averaged values report outcomes nobody could achieve live. Results are not guaranteed; past performance is not indicative of future results.
External references
- For background on this concept, see Heikin-Ashi Chart on Wikipedia.
- For broader market context, see Heikin Ashi at BabyPips Forexpedia.

About the author
Written by Dominic Walsh, a Forex trader and MT4/MT5 indicator, Expert Advisor and script developer. Every tool on forexmt4systems.com is tested on live charts before release and ships with ready-to-use compiled MT4 (.ex4) and MT5 (.ex5) files. Learn more about the trader and developer behind this site.
How we build, test and correct every tool: Editorial & Testing Policy. Trading carries risk; see the disclaimer.