
Quarterly theory in trading splits time into repeating quarters, and each quarter drives a predictable phase of price delivery. The framework grew from ICT time concepts and was later formalized by the trader known as Traderdaddy. So it hands you a clock-based map instead of a guess.
This guide shows how the quarters nest, from the yearly cycle down to ninety-minute blocks, and how every one cycles through accumulation, manipulation, distribution, and reversal. By the end, you will be able to read where price sits in its current cycle and time entries around the manipulation phase rather than chasing the obvious move.
What Is Quarterly Theory in Trading?
Quarterly theory in trading is a time-based model that divides every cycle into four equal quarters. Michael Huddleston, the Inner Circle Trader (ICT), seeded the idea with his work on time and price. Then the trader Daye, known online as Traderdaddy, packaged it into the labelled system most people study today. Credit for the concept belongs to that lineage.
The core claim stays simple. Price rarely moves at random through a session; instead it follows a rhythm set by the algorithm that delivers it. So each quarter takes a turn. One builds a range, the next fakes a direction, the third runs the real move, and the fourth resolves it. The chart below marks these four phases across one trading week on the EURUSD daily chart.
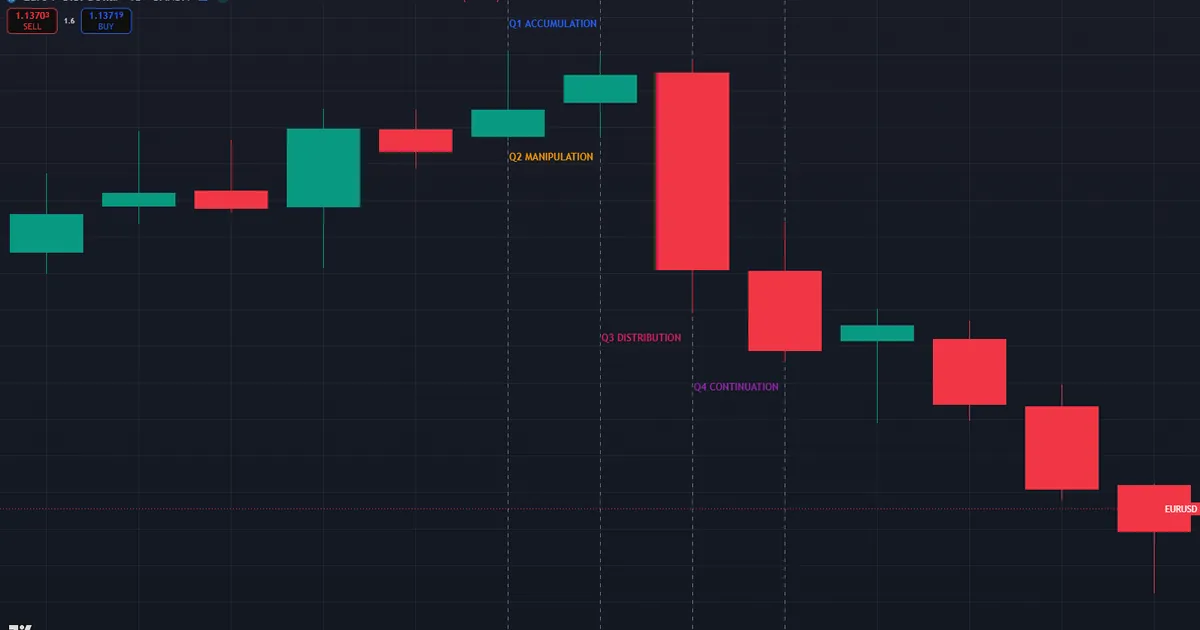
Read the frame from left to right, and the week tells a clean story. EURUSD spent Monday’s quarter coiling in a tight box between 1.15726 and 1.16221. Then Tuesday’s quarter drove a sharp push up to 1.16198, sweeping resting stops above the range before rolling over. Next Wednesday delivered the real distribution down from 1.16168 to 1.15020, and Thursday continued lower to 1.14513. Each labelled block on the daily chart matches one of the four weekly quarters, so the rhythm becomes visible at a glance. Once you have seen the pattern a few times, you start to anticipate each phase before it completes.
The Accumulation, Manipulation, Distribution Cycle
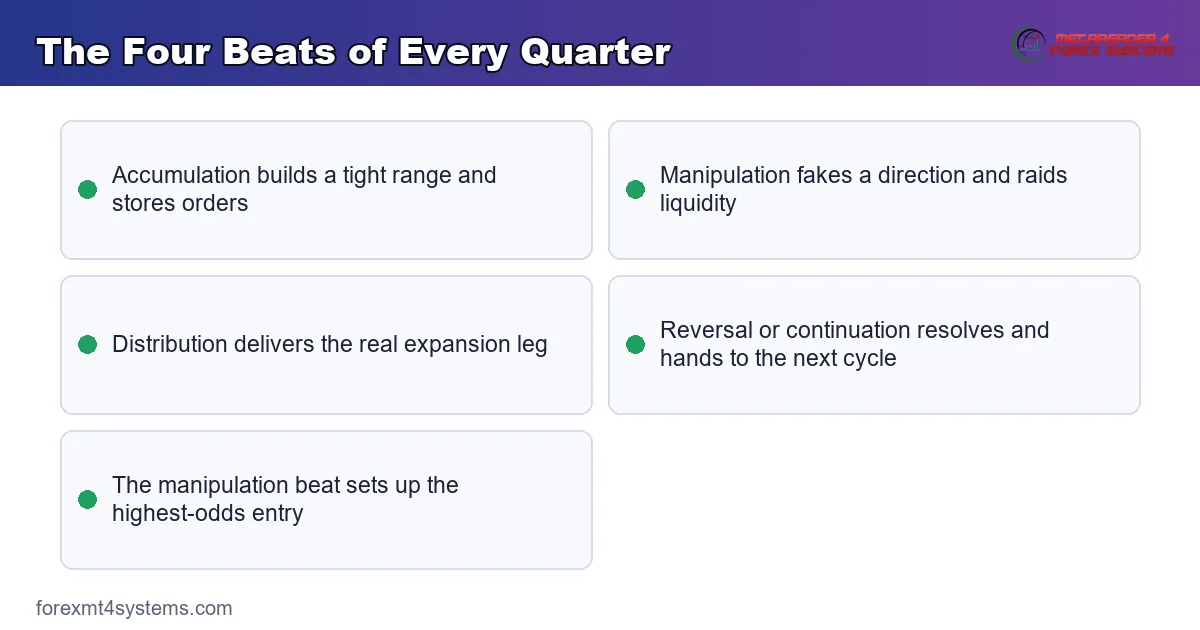
Every quarter follows the same four-beat story, often shortened to AMD with a fourth resolution beat. First comes accumulation, where price consolidates and the algorithm builds orders inside a narrow band. Second comes manipulation, a deliberate fake move that raids liquidity against the true direction. Third comes distribution, the expansion leg that most traders finally recognize. Fourth comes continuation or reversal, where the move either extends or hands over to the next cycle.
Plainly put, the manipulation beat is the one that pays. It traps breakout traders on the wrong side and creates the discount or premium the smart entry needs. So the whole point of the model is to expect the fake before the real leg, not after it.
How the Quarters Nest Inside Each Other
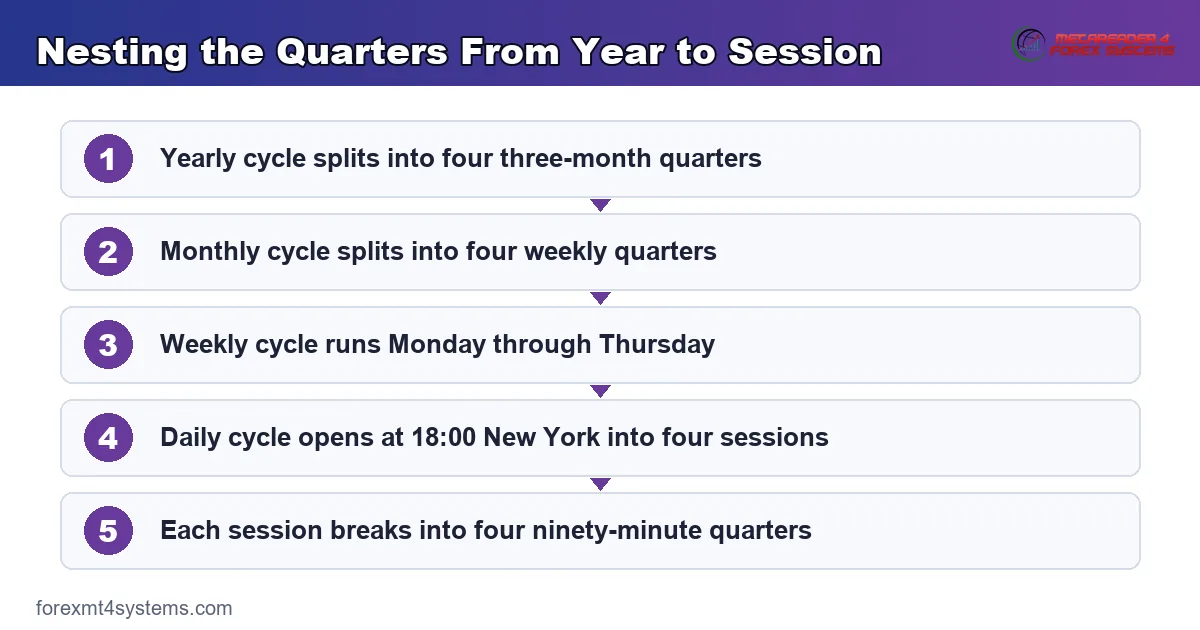
Quarterly theory is fractal. Each large quarter contains four smaller quarters, and the same AMD rhythm repeats at every scale. Walk down the ladder step by step and the structure clicks into place.
- Yearly cycle. The calendar year splits into four three-month quarters — January to March, April to June, and so on.
- Monthly cycle. Each month divides into four roughly weekly quarters, so the first week accumulates and the later weeks resolve.
- Weekly cycle. The trading week runs Monday to Thursday as Q1 through Q4, with Monday accumulating and midweek delivering the manipulation and expansion.
- Daily cycle. The true day starts at 18:00 New York time, so the four six-hour quarters are Asia, London, New York morning, and New York afternoon.
- Ninety-minute cycle. Each six-hour session breaks into four ninety-minute quarters, the smallest block most intraday traders use.
Notice how each layer sets context for the one beneath it. Truly, a bullish weekly cycle raises the odds that a daily manipulation low becomes a buying chance. The branded map below stacks the five layers so you can see how a ninety-minute quarter sits inside the whole year.
Why the True Day Opens at 18:00
Newcomers often stumble on the daily open. In quarterly theory the day starts at 18:00 New York time, when the Asian session begins, not at midnight. So the Asian range becomes Q1 accumulation, and London becomes the Q2 manipulation that raids it. This alignment matters because it places the fake move and the real move in the sessions where liquidity actually concentrates.
The Dual-Cycle Idea
Daye added one refinement worth knowing. He paired the quarters into two overlapping cycles rather than treating each one in isolation. In practice, the manipulation quarter of one cycle often becomes the accumulation quarter of the next, so the phases flow into each other instead of resetting cleanly. Plainly put, you should read two quarters at a time and watch how the fake move seeds the following expansion. This dual view stops you from expecting a fresh AMD sequence to snap into place at every session boundary.
Where Quarterly Theory Sits in the SMC Workflow
Quarterly theory tells you when; the rest of your smart money toolkit tells you where. So the two must work together. Start with higher-timeframe bias, then let the clock refine your timing, and finally confirm with structure on a lower chart.
First, set direction from the daily and four-hour charts. A rising daily draw on liquidity biases you toward buying the manipulation lows. Second, mark the current daily quarter and note which session you are in. If London just swept the Asian low, you are likely watching Q2 manipulation set up Q3 distribution. Then drop to the five-minute or fifteen-minute chart for the trigger.
The trigger is where structure earns its keep. A market structure shift after the manipulation sweep confirms that the reversal is real. For the daily narrative that feeds this timing, our guide to ICT daily bias walks through building direction before the session opens. Meanwhile the discount and premium map below the equilibrium line decides whether the level is worth trading at all, which our note on premium and discount covers in depth.
Think of the two tools as answering separate questions. The quarter answers when a move is likely to fire, and the equilibrium level answers whether the price is fair enough to join. So a manipulation low in the discount half of the range is a far better long than the same low sitting in premium. Combine both filters and many marginal setups drop away before they cost you anything. Truly, most losing trades in this model come from taking the right timing at the wrong price, or the right price at the wrong time.
Pairing Sessions With the Ninety-Minute Quarters
Session timing sharpens entries. The London manipulation usually prints between 02:00 and 05:00 New York time, and the New York expansion tends to run from 08:30 to 11:00. So the ninety-minute quarters inside those windows carry the most weight. These short algorithmic bursts overlap closely with the concept covered in our guide to ICT macros, which zooms into the exact minutes where delivery accelerates.
Reading the Manipulation Phase
The manipulation quarter is the heart of the model, so learn to read it closely. Its job is to fool the crowd. It runs price against the true direction just far enough to trigger stops and tempt breakout traders, and then it reverses. This fake leg is often called the Judas swing, since it betrays the traders who chase it.
Three clues help you spot a genuine manipulation move. First, it raids an obvious pool of liquidity, such as the accumulation range extreme or the prior session high or low. Second, it rejects quickly, usually leaving a long wick rather than a stack of full-bodied closes. Third, it prints inside a known timing window, most often the early London hours. When all three line up, the odds that the next quarter delivers the real move climb sharply.
Judging the True Direction
Direction comes from context, not from the manipulation candle itself. Look up first. If the weekly and daily quarters both point higher, then a downward London sweep is probably the fake, and the real move should travel up. So the manipulation low becomes a buying chance rather than a sell signal. Reverse every step for a bearish context. This top-down check keeps you from trading the trap in the wrong direction.
Waiting for Confirmation
Never enter on the sweep alone. The sweep only tells you that liquidity was taken; it does not prove the reversal. So wait for a lower-timeframe structure shift, a fair value gap, or a clean rejection back inside the range. That confirmation costs you a few pips of entry price, yet it filters out the sweeps that simply keep going. Discipline on this single point separates traders who use the model from traders who merely admire it.
Worked Example: A Long Setup on EURUSD
Now run a bullish case first, so the sequence feels concrete. EURUSD trades above a rising daily draw on liquidity, so the bias points up. The plan is to buy a London manipulation low that raids the Asian range while the higher quarter still favors longs.
During the Asian quarter, EURUSD accumulates between 1.0812 and 1.0834. Then London opens and drives price down to 1.0801, sweeping the sell stops below the Asian low. That flush is Q2 manipulation, and it prints inside the 02:00 to 05:00 window. Next, a fifteen-minute structure shift breaks the last minor lower high at 1.0826, closing with a full body and leaving a fair value gap between 1.0808 and 1.0815.
The entry builds itself from there. Price retraces into the 1.0808 to 1.0815 gap, which also sits in the discount half of the London range. So a long inside that gap carries a stop below the 1.0801 sweep low, roughly 12 pips of risk. Then the New York morning delivers Q3 distribution upward, tagging the liquidity resting above 1.0860. Notice the order never changes: accumulate, manipulate, distribute, resolve.
Worked Example 2: A Short Setup on GBPUSD
Now flip the direction and walk a bearish case, step by step. GBPUSD trades below its declining daily draw on liquidity, so the bias points down. The plan is to sell a London manipulation high that raids the Asian range. The chart below shows this exact sequence with the sweep, the shift, and the entry gap marked.
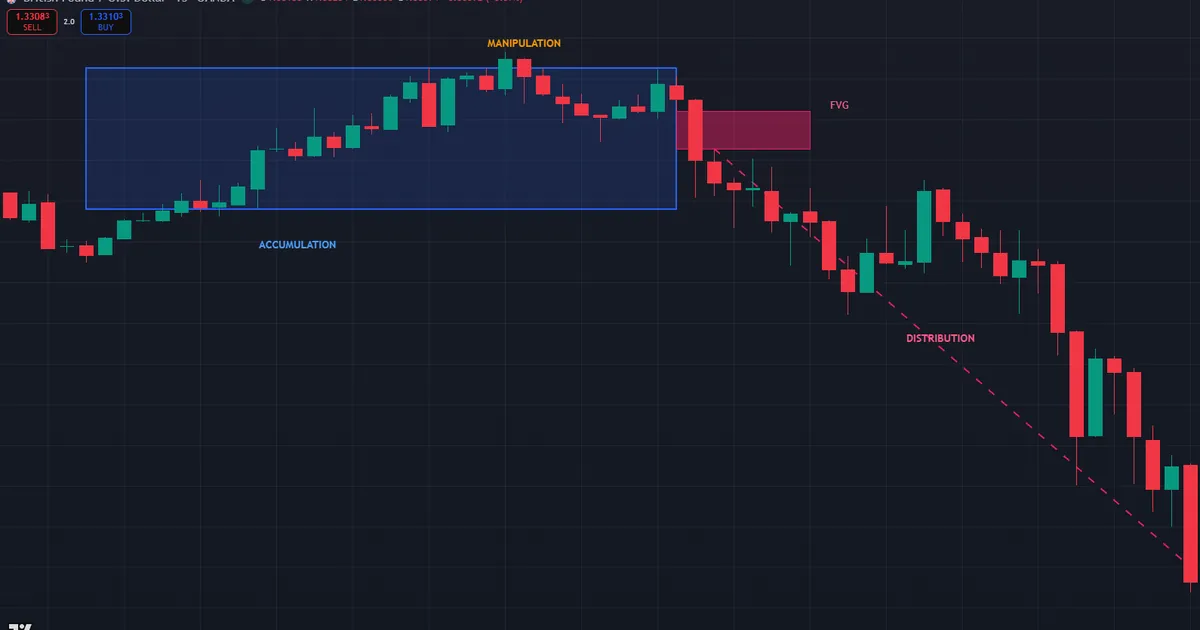
During the Asian quarter, GBPUSD accumulates between 1.33740 and 1.33913. Then the London quarter opens and drives price up to 1.33934, sweeping the buy stops above the Asian high. That spike is Q2 manipulation, and it prints inside the 02:00 to 05:00 window. Next, a fifteen-minute structure shift breaks the last minor higher low at 1.33840, closing with a full body and leaving a fair value gap between 1.33860 and 1.33814.
The entry builds itself from there. Price retraces into the 1.33814 to 1.33860 gap, which also sits in the premium half of the London range. So a short inside that gap carries a stop above the 1.33934 sweep high, roughly 15 pips of risk. Then the New York morning delivers Q3 distribution downward, tagging the liquidity resting under 1.33269. Our Fibonacci calculator speeds up marking the retracement and the target projection for this leg.
Download the complete indicator database
Put these concepts on your charts. One email unlocks the full library of 1,380+ indicators with compiled MT4 and MT5 files, plus my TradingView scripts. No paywall, no spam, unsubscribe any time.
Get free access to my indicator database
One email unlocks 1,380+ free MT4, MT5 and TradingView indicators — the complete library. No single-tool download; you get the whole database.
Common Mistakes and How to Fix Them
The theory reads cleanly, yet the same execution errors repeat. The graphic below collects the four traps we see most, and the fixes follow beneath it.
Forcing the cycle onto every candle
Not every session delivers a textbook AMD sequence. Ranging days and holiday sessions often skip the clean manipulation leg entirely. So treat the model as a bias, not a promise, and stand aside when the accumulation range never forms.
Ignoring the higher-quarter context
A daily manipulation low means little if the weekly cycle points down. Instead, always check the quarter above the one you trade. When the larger cycle disagrees, the smaller move usually fails or delivers only a shallow bounce.
Chasing the distribution leg
Traders who enter during Q3 expansion arrive late, with a wide stop and a poor price. Rather than chase, mark the manipulation extreme and wait for the retracement into the gap it left behind. Patience here is the whole edge.
Misreading the daily open
Using midnight as the daily start scrambles the quarter labels. Anchor the day to 18:00 New York time so the Asian range lands in Q1, and the rest of the sequence falls into place naturally.
Quick-Reference Checklist
Run this list before you act on any quarter. A few seconds here prevents most impulsive entries. Keep it beside your charts and treat any unchecked box as a reason to pass. Discipline compounds faster than any single winning trade.
- Higher-timeframe bias marked on the daily and four-hour charts.
- Current daily quarter identified, anchored to the 18:00 New York open.
- Accumulation range mapped during the prior quarter.
- Manipulation sweep confirmed against the true direction.
- Lower-timeframe structure shift printed after the sweep.
- Entry planned inside the resulting gap or discount zone.
- Stop set beyond the manipulation extreme, target at the opposing liquidity.
Honest Limitations: When the Cycle Breaks Down
Study the failure case as hard as the success case. Here is a common one. EURUSD sets a tidy Asian accumulation range, and London delivers what looks like a clean manipulation sweep below it. Every early box ticks. Then the New York session refuses to expand upward. Instead price keeps grinding lower, straight through the accumulation range, and the expected reversal never arrives. The chart below shows that unraveling, with the failed reversal level marked.
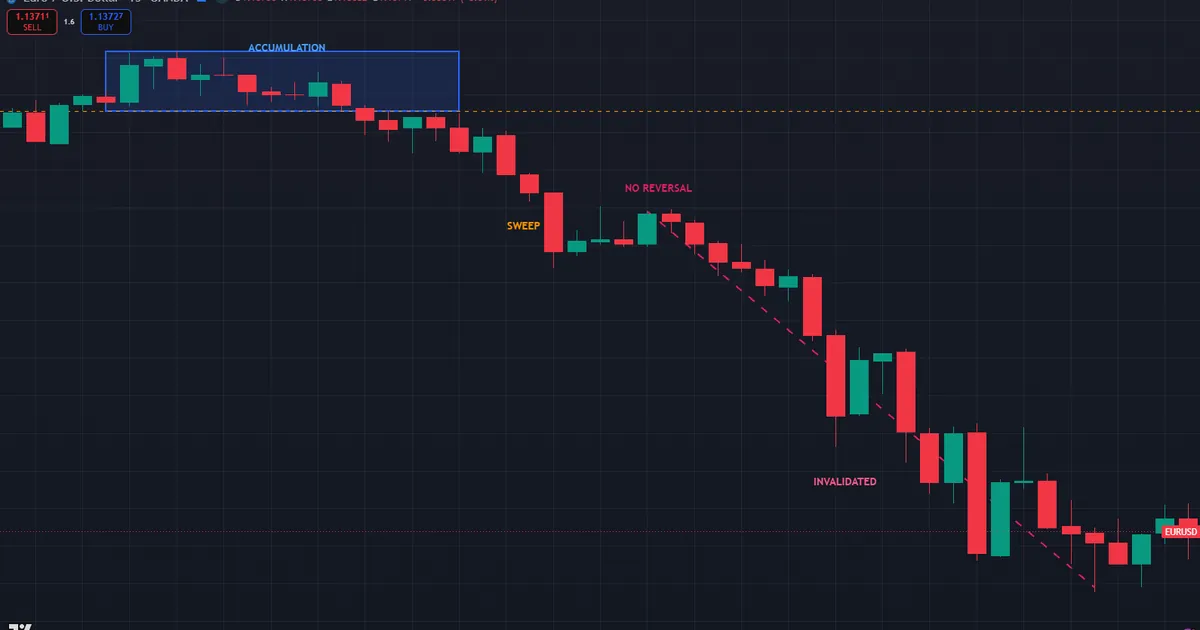
What went wrong? Usually the higher quarter. In this case the weekly cycle was itself in a manipulation-down phase, so the daily sweep was part of a larger raid rather than a reversal signal. Hence the invalidation rule that limits the damage. Once price closes a candle back below the accumulation range after the sweep, the long idea is dead. Exit at once, without widening the stop.
Journaling Every Failed Cycle
Then journal the trade while the details stay sharp. Note the pair, the session, the state of the quarter above, and how far the fake move traveled. Also record whether the manipulation actually swept a clear pool or merely drifted. Review a few dozen of these entries and a pattern appears. Failed cycles cluster on high-impact news days, inside ranging weeks, and when the higher quarter disagrees. That written record turns each loss into tuition rather than pure cost.
News and Thin Sessions Distort the Cycle
News is the second common trap. A rate decision or inflation print can drive price through any accumulation range, and the resulting spike mimics a textbook manipulation move. Yet scheduled releases often reverse within the hour, so a sweep caused by news deserves extra suspicion. Instead of trading it live, let the dust settle and judge the range once normal delivery resumes. Thin holiday sessions carry the same warning, since low participation distorts the usual rhythm and produces sweeps that lead nowhere.
No Fixed Success Rate Exists
Be blunt about this point. No reliable success percentage exists for quarterly theory, and anyone quoting one is guessing. Outcomes depend on your bias selection, session filters, and discipline. Qualitatively, setups that align the daily quarter with the weekly quarter hold up far better than counter-cycle trades. That direction of effect is the only honest claim worth making.
Related Concepts to Study Next
A sensible study order helps here. First, practice marking the four daily quarters on replayed charts until the session boundaries feel automatic. Then layer in the manipulation read, followed by structure confirmation, and only then trade the model live with minimal size. Rushing straight to live entries skips the pattern recognition that makes the theory useful. So build the habit slowly, one quarter at a time.
Quarterly theory sits inside a web of sibling ideas, and a few deserve your next reading hour. The accumulation, manipulation, and distribution rhythm mirrors the three-phase logic explained in the full guide to the ICT power of three, so read that pillar to reinforce the phases. For automation, the wider library of ICT indicators for MT4 and MT5 marks sessions and structure in real time, and the dedicated quarterly theory access indicator plots the daily and session quarters directly on your chart. Master the clock, the phases, and the structure trigger together, and most sessions start reading like a sequence instead of noise.
FAQ
What is quarterly theory in simple terms?
It is a time-based trading model that splits every cycle into four quarters. Each quarter plays a role — accumulation, manipulation, distribution, or reversal. So the model helps you expect the fake move before the real expansion arrives.
Who created quarterly theory?
The idea grew from ICT time-and-price concepts taught by Michael Huddleston. The trader Daye, known as Traderdaddy, then organized it into the labelled quarterly system most traders study today. Credit belongs to that combined lineage.
When does the trading day start in quarterly theory?
The true day opens at 18:00 New York time, when the Asian session begins. So the Asian range becomes the first quarter, and London becomes the second. This anchor keeps the four daily quarters aligned with real liquidity windows.
What are the four daily quarters?
They are Asia from 18:00 to 00:00, London from 00:00 to 06:00, New York morning from 06:00 to 12:00, and New York afternoon from 12:00 to 18:00, all in New York time. Each spans six hours and carries its own phase of the cycle.
How is quarterly theory different from ICT kill zones?
Kill zones highlight specific high-probability hours within a session. Quarterly theory zooms out and frames the entire cycle around four equal blocks. The two fit together, since kill zones often line up with the manipulation and distribution quarters.
Is quarterly theory reliable enough to trade alone?
No single timing model should stand on its own. Pair the quarters with higher-timeframe bias, structure confirmation, and strict risk control before acting. Always manage risk on every trade. Results are not guaranteed; past performance is not indicative of future results.
External references
- For background on this concept, see Trading Session at Investopedia.
- For broader market context, see Business cycle on Wikipedia.

About the author
Written by Dominic Walsh, a Forex trader and MT4/MT5 indicator, Expert Advisor and script developer. Every tool on forexmt4systems.com is tested on live charts before release and ships with ready-to-use compiled MT4 (.ex4) and MT5 (.ex5) files. Learn more about the trader and developer behind this site.
How we build, test and correct every tool: Editorial & Testing Policy. Trading carries risk; see the disclaimer.