
The ICT power of three is the story every candle tells in three acts: accumulation, manipulation, and distribution, or AMD for short. Also, look at any daily candle on a trending day. Price opens and chops sideways while positions build. Indeed, it then pushes the wrong way, runs stops beyond an obvious level, and leaves a wick. Finally it expands hard in the true direction and closes near the extreme. Still, that open, wick, and body did not happen at random. Under the AMD lens, the wick is engineered and the body is the payoff. Thus, this guide breaks down each phase, shows how the model repeats from the daily candle down to a single session, and covers the tools from this library that help you map it live.
The three phases of the ICT power of three explained
Accumulation is the range around the open. Hence, price oscillates in a tight band while larger participants build positions without moving the market against themselves. On a chart it looks boring: small candles, overlapping wicks, no follow-through in either direction. Next, the open price sits near the middle of this band, and both sides of it collect resting stops. Nothing about this phase tells you the direction yet. Then, its job is to define the levels that will matter next. Patience here is a position.
Manipulation is the false move, the Judas-style push that breaks one side of the accumulation range. On a day that will close bullish, price first drops below the range low. It takes out the sell stops resting there, fills buy orders at a discount, and traps breakout sellers into a move that is about to reverse. Yet, the break usually fails fast: a sweep of the level, a sharp rejection, and a close back inside the range. That failure is the most useful bar of the day, because it reveals which side just got fueled.
Distribution is the true expansion. Truly, price displaces away from the manipulation extreme, breaks structure in the real direction, and runs through the opposite side of the range toward the day’s target liquidity. This leg builds the candle body. Plainly, the stronger the manipulation trap, the cleaner this leg tends to run, because trapped traders exiting add fuel to the move. By the close, the sequence reads cleanly: quiet open, engineered wick, directional body. Also, the phases only earn their names once all three have printed, which matters more than most explanations admit.
PO3 on the daily candle vs intraday sessions
The model is fractal. Indeed, the cleanest illustration is a single daily candle: accumulation around the daily open, manipulation forming the wick, distribution forming the body into the close. That is the reason ICT teaches students to read candles as stories rather than shapes. Still, a long wick against the close is not noise. It is the receipt of a stop run.
The same sequence appears one level down, inside the trading day. Thus, the 24-hour session splits into blocks, and each block can play a phase: one session ranges, the next sweeps, the next expands. It also appears one level up. Hence, a weekly candle often accumulates on Monday, manipulates into Tuesday or Wednesday, and distributes into the weekly close. Even a single H1 candle can show a micro version on the M5 chart. Next, the clock resets at each open: a new day, a new week, a new session, and each one starts its own AMD cycle.
The practical takeaway: pick one timeframe pair and stay there. Then, read the phase on the higher timeframe, and execute on the lower one. Traders who hunt AMD on five timeframes at once find a “manipulation” everywhere and a bias nowhere. Yet, one clean read beats five noisy ones.
Download the complete indicator database
Every tool in this guide ships in one download. One email unlocks the full library of 1,380+ tools with compiled MT4 and MT5 files, plus my TradingView scripts. No paywall, no spam, unsubscribe any time.
Get free access to my indicator database
One email unlocks 1,380+ free MT4, MT5 and TradingView indicators — the complete library. No single-tool download; you get the whole database.
Mapping PO3 in practice: Asian range, London sweep, New York run
The classic intraday template maps the three phases onto the three major sessions. Plainly, the Asian session plays accumulation: volume is thin, ranges are narrow, and price builds a box that defines the day’s first liquidity pools. The London open plays manipulation: the first hours of European volume frequently sweep one side of the Asian range before the day’s real direction asserts itself. Also, new York then plays distribution: the expansion leg runs through the opposite side and continues toward a daily or weekly level.
Treat this as the typical script, not a fixed rule. Plenty of days invert it. London sometimes starts the true move immediately and never looks back. Indeed, new York sometimes delivers the sweep instead, reversing London’s entire push around the equities open. News days compress all three phases into an hour.
The session map is a starting hypothesis you hold loosely: mark the Asian high and low, watch how London treats them, and let the reaction confirm or kill the script. On EURUSD and GBPUSD the template fires most often, because their liquidity peaks in London and New York. Pairs centered on Asian hours follow a shifted clock. Still, time anchors sharpen the read further. Mark the midnight open and the New York morning open, and note where price sits relative to each when a sweep prints. Thus, a manipulation leg that completes before New York opens leaves the entire American session free to distribute.
Combining PO3 with entries
PO3 is a narrative model, not an entry signal, so the entry work happens at the seam between manipulation and distribution. Hence, the worst place to trade is inside accumulation. The range is narrow, the direction is undecided, and every breakout attempt is suspect by definition. Next, sitting on your hands through the chop is part of the method. If you miss the sweep, let the day go. Then, chasing distribution late means buying the level where early entries take profit.
The entry window opens during or just after manipulation, and only with structure confirmation. Yet, the manipulation leg is the same event ICT calls the Judas swing: the early false move that baits traders into the wrong side. Once price sweeps a level, you want proof the sweep failed. Truly, that proof is displacement back through the range and a shift in lower-timeframe structure, ideally leaving a fair value gap or an order block to lean on. Entering on the sweep alone, without the shift, is guessing which wick is the manipulation.
The full sweep-then-shift sequence, with every related concept from liquidity pools to fair value gaps, is covered in my ICT indicators guide. Plainly, stops go beyond the manipulation extreme. Targets sit at the liquidity on the far side of the range, where distribution is headed. Also, a partial exit at the range midpoint keeps the trade honest on days when the expansion stalls early.
Tools that help map each phase
Three tools from this library divide the AMD mapping work between them. Indeed, one tracks the sweep-to-shift sequence that marks the turn, one labels the structure that confirms it, and one draws the session boxes that frame the whole day. All three run together on one chart without conflict, and each ships compiled for both MT4 and MT5.
| Tool | Phase it helps map | Best timeframes | Alerts |
|---|---|---|---|
| ICT 2022 Mentorship Trading Model | Manipulation into distribution: liquidity sweep, then displacement shift | M5–M15 execution off H1 bias | Popup + push |
| ICT Concepts | Distribution confirmation: structure breaks, order blocks, imbalances | M15–H4 | Popup + push |
| Session Box | Accumulation: Asian, London, and New York ranges boxed automatically | M5–H1 | Popup + push |
ICT 2022 Mentorship Trading Model
This tool automates the exact seam the entry section describes. Still, it waits for price to sweep a marked liquidity pool, then demands a displacement leg that shifts lower-timeframe structure before it prints a signal. That is the manipulation-to-distribution handoff in code. Thus, verdict: the most direct PO3 execution aid in the library, because it refuses to signal during accumulation chop. Limitation: on days when distribution starts without a clean sweep, it stays silent and you miss the move.

ICT Concepts
This is the structure layer. Hence, it marks breaks of structure, order blocks, and fair value gaps on closed bars, which is exactly the confirmation evidence a PO3 trader needs after a suspected manipulation leg. Verdict: the best companion tool for the model above, since it shows why a shift qualified. Next, limitation: it labels everything it finds, so an unfiltered chart gets busy fast. Trim the displayed concepts down to structure and imbalances for AMD work.
Session Box
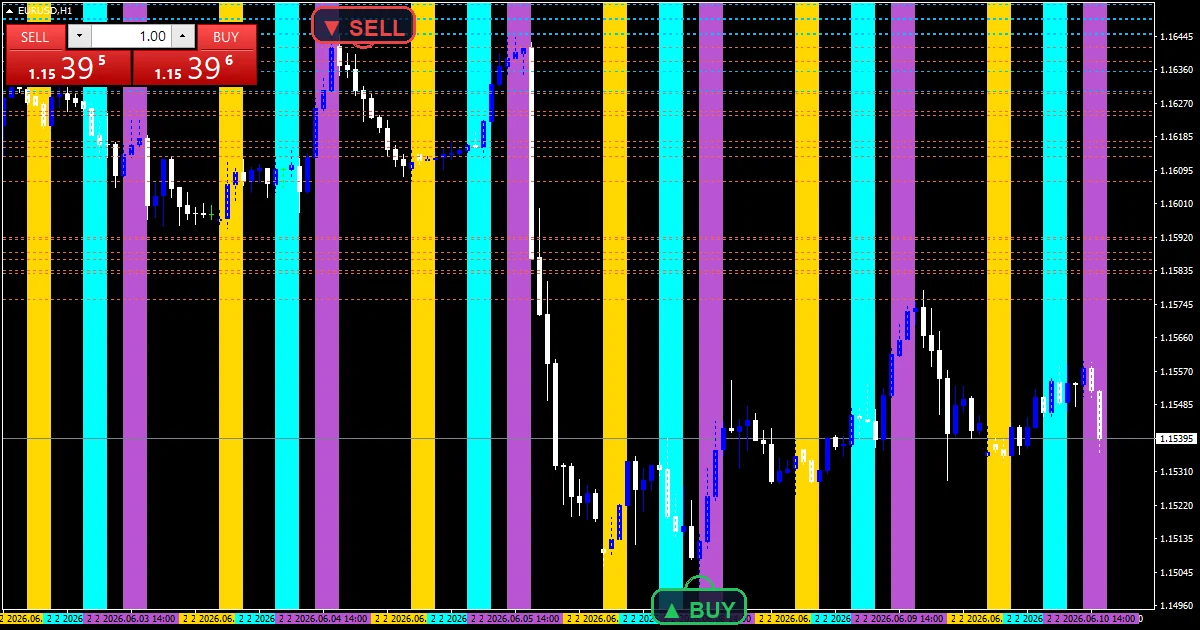
The simplest tool of the three, and the one you load first. Then, it boxes the Asian, London, and New York sessions with their highs and lows, which gives you the accumulation range and its liquidity levels without manual drawing. Verdict: the cleanest way to frame the daily AMD script before the London open. Yet, limitation: it maps time, not behavior. The box shows where accumulation should be, and price is free to ignore the schedule. Truly, pair it with an alert on the box boundaries and you get a heads-up the moment London tests the Asian range.
Honest limitations of the model
The phases are clear in hindsight and ambiguous live. On a finished candle, the wick and body announce which move was manipulation. At 9 a.m., a break below the Asian low looks identical whether it is a sweep about to reverse or the first leg of a real sell-off. Plainly, you often only know late, after displacement, which cuts into the reward of the move. Trending days are the other trap: strong days frequently skip the manipulation phase entirely, opening near one extreme and distributing all day. Also, a trader who waits for a sweep that never comes misses the entire trend. Treat AMD as one read on the day, demand structure confirmation, and accept that some days refuse to follow the script.
Every tool above passed the same release gate: both builds compile clean in MetaEditor, then run on a live EURUSD chart through fresh bars, with signals and alerts checked on closed candles. Indeed, nothing here repaints: what a closed bar shows is what the tool drew when that bar closed. The full checklist is in my Editorial and Testing Policy, and the step-by-step MT4/MT5 installation guide gets any of them on a chart in about five minutes.
Want the full ICT toolkit? Get the complete database.
FAQ
What does AMD stand for in ICT trading?
Accumulation, manipulation, and distribution. Still, price ranges around the open, runs a false move to collect liquidity, then expands in the true direction to form the candle body.
Does the power of three work on every timeframe?
The model is fractal: it shows on weekly, daily, and session candles alike. Thus, it reads best where liquidity is deepest: the daily candle and the London-New York window. On very low timeframes, spread and noise blur the phases.
How do I know which phase the market is in right now?
Honestly, you often only know late. Hence, a range is only accumulation if a sweep follows, and a sweep is only manipulation if displacement reverses it. Structure shifts are the earliest reliable evidence, which is why entries wait for them.
Is the power of three the same as the Judas swing?
Not the same, but related. Next, the Judas swing is the false early move that baits traders into the wrong direction. PO3 is the full three-phase model, and the Judas swing is its manipulation phase.
What results should I expect from trading the PO3 model?
Treat it as a framework for reading the day, not a signal system. Then, your session choice, confirmation rules, and risk per trade shape outcomes more than the model does. Results are not guaranteed; past performance is not indicative of future results.
External references
- For background on this concept, see Derivatives market on Wikipedia.
- For broader market context, see Double Exponential Moving Average DEMA at StockCharts ChartSchool.
Background reading: leading versus lagging indicators explained.

About the author
Written by Dominic Walsh, a Forex trader and MT4/MT5 indicator, Expert Advisor and script developer. Every tool on forexmt4systems.com is tested on live charts before release and ships with ready-to-use compiled MT4 (.ex4) and MT5 (.ex5) files. Learn more about the trader and developer behind this site.
How we build, test and correct every tool: Editorial & Testing Policy. Trading carries risk; see the disclaimer.