
ICT indicators translate the Inner Circle Trader method into lines, boxes, and labels on your MT4 or MT5 chart. Also, the method itself, taught by Michael Huddleston, reads institutional order flow straight from price structure. No volume feed, no order-book data. Indeed, just candles, and a framework for what large participants likely did to create them. I have spent years marking these concepts by hand, and hand-marking has two problems: it takes hours, and it bends to whatever you want to see. Still, the tools on this page fix both. They apply one fixed rule set to every chart, every time. Thus, one honest note before we start. ICT indicators mark conditions. They do not predict outcomes. An order block is a hypothesis about resting interest, not a promise. Hence, keep that frame and these tools become genuinely useful.
Market structure and CISD
Market structure is the skeleton of every ICT read. Price moves in swings. Higher highs and higher lows define an uptrend; lower highs and lower lows define a downtrend. Then, a break of structure extends the trend. A change of character breaks the pattern and warns that the trend may be done. Yet, so far, this is classic swing analysis. ICT adds a sharper trigger on top: the change in the state of delivery, or CISD.
Here is the idea in plain English. Truly, every leg down is “delivered” by a series of bearish candles. When price later closes back through the opening prices of that bearish series, the delivery has flipped. Plainly, sellers built the leg; buyers just erased its foundation. That close is the CISD level. Also, it often fires earlier than a full structure break, which is why the 2022-era ICT material leans on it so heavily.
The CISD CSD + FVG IFVG ICT indicator automates this read. Indeed, it tracks each delivery leg, plots the CISD trigger line, and marks the moment a close confirms the flip. It draws the related gap levels on the same overlay, so the structural story stays synchronized.

| Concept in one line | A close through the origin of the last delivery leg flips control. |
| What the tool draws | CISD trigger lines, flip confirmations, and linked gap levels. |
| Where it helps | Catching reversals one step earlier than a plain structure break. |
Download the complete indicator database
All the ICT tools in this guide ship together in one download. One email unlocks the full library of 1,380+ tools with compiled MT4 and MT5 files, plus my TradingView scripts. No paywall, no spam, unsubscribe any time.
Get free access to my indicator database
One email unlocks 1,380+ free MT4, MT5 and TradingView indicators — the complete library. No single-tool download; you get the whole database.
Order blocks
An order block is the last opposing candle before a strong displacement move. Thus, the final down candle before an aggressive rally is a bullish order block. The final up candle before a sharp drop is a bearish one. Hence, the theory: institutions accumulated positions inside that candle, and some of their orders never filled. When price returns to the zone, those resting orders may react. Next, that return visit is called mitigation.
Two details separate a useful order block from chart clutter. First, displacement. The move away from the candle must be fast and decisive, ideally leaving an imbalance behind. Then, a slow drift away means nobody urgent was there. Second, freshness. Yet, a zone touched three times has likely spent its orders. The first return is the one worth watching.
The Order Block indicator applies these rules mechanically. Truly, it qualifies candles by displacement, draws the zone, extends it forward, and retires it once price has mitigated it. You get the same zones on every pair and every timeframe, instead of rectangles that shift with your mood. Plainly, I treat its zones as locations, not signals. A zone plus a liquidity sweep plus a kill-zone window is a setup. Also, a zone alone is just a place on the chart.
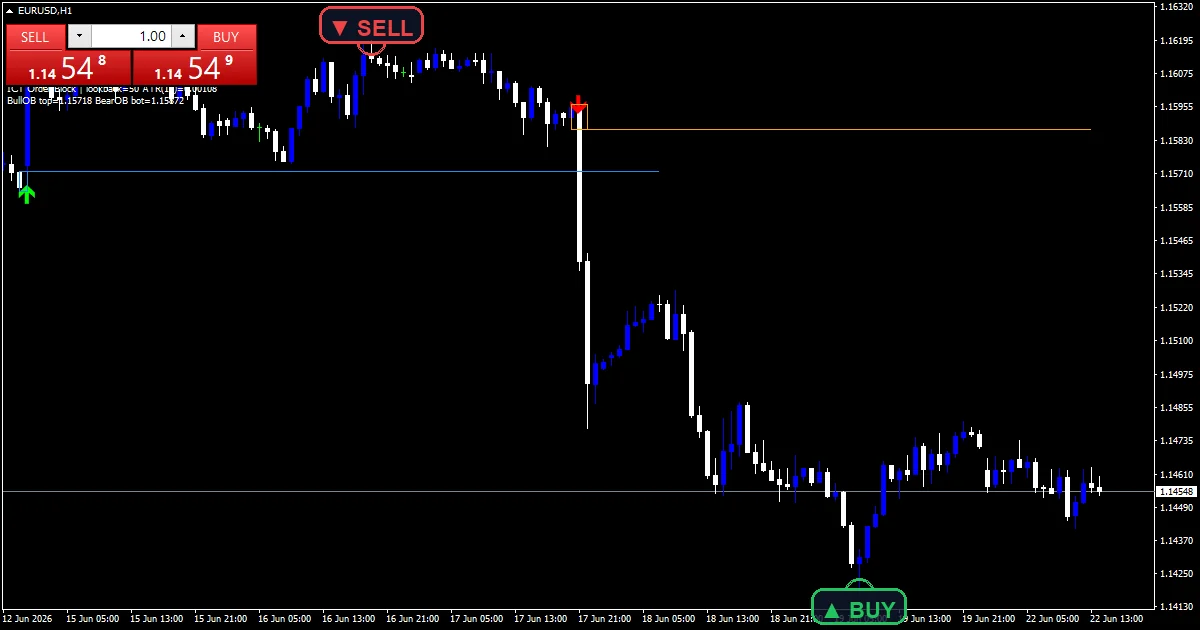
| Concept in one line | The last opposing candle before displacement holds unfilled institutional orders. |
| What the tool draws | Qualified supply and demand boxes, extended until mitigated. |
| Where it helps | Framing pullback entries in the direction of the displacement. |
Fair value gaps and inversions
A fair value gap, or FVG, is a three-candle imbalance. Indeed, when the middle candle moves so fast that candle one’s wick and candle three’s wick fail to overlap, a hole is left in the delivery. Price traded through that window in one direction only. Still, ICT teaching expects the market to revisit many of these gaps, because efficient delivery means offering both sides of a price range.
The inversion fair value gap, or IFVG, is the next layer. Thus, when price fills a gap completely and closes beyond it, the gap flips roles. A bullish gap that fails becomes resistance. Hence, a bearish gap that fails becomes support. Failed levels flipping polarity is an old idea; the IFVG applies it to imbalances, and it is one of the most practical pieces of the whole framework.
Two tools on this site cover gaps. Next, the CISD CSD + FVG IFVG tool handles both standard and inversion gaps alongside its delivery logic. The ICT Concepts indicator draws gaps within a broader package of structure labels and blocks. Then, use the first when gaps and CISD are your focus. Use the second when you want the whole map at once.
| Concept in one line | A three-candle imbalance that price often revisits; a failed gap flips polarity. |
| What the tool draws | Live FVG boxes, fill tracking, and inversion re-labeling. |
| Where it helps | Precise entry zones inside a displacement leg, plus flip levels after a fill. |
Liquidity: buy side, sell side, sweeps
Liquidity, in the ICT sense, means resting orders. Yet, stops cluster in predictable places: above equal highs, below equal lows, and beyond any swing point that retail traders lean on. Buy-side liquidity sits above highs, where short-seller stops and breakout buy orders wait. Truly, sell-side liquidity sits below lows. Large participants need these pools, because a big position can only fill against resting orders without moving the market against itself.
This produces the signature ICT event: the sweep. Plainly, price spikes through an obvious high, fills the cluster, and reverses. To a breakout trader, that spike looked like confirmation. Also, to a liquidity reader, it was the completion of a raid. Learning to see sweeps as endings rather than beginnings changes how you read almost every violent wick on your chart.
The Buy Side Liquidity indicator tracks the highs where buy stops accumulate, ranks equal-high clusters, and flags the moment price runs them. Indeed, pair it with the deeper collection in the liquidity indicators hub, which includes sell-side and sweep-focused variants.

| Concept in one line | Stops cluster at obvious levels, and price is drawn toward them. |
| What the tool draws | Buy-side pool lines above highs, with alerts when a pool is swept. |
| Where it helps | Anticipating targets, and filtering false breakouts at range extremes. |
Kill zones and session timing
Every concept above works better inside the right hours. Still, kill zones are the windows when institutional volume actually flows: the London open, the New York open, and the overlap between them. ICT teaching grades setups inside these windows as meaningful and setups outside them as suspect. Thus, the reason is mechanical, not mystical. Sweeps and displacement need volume behind them. Hence, a perfect order block touched at 3 a.m. terminal time rarely behaves like the same touch during London.
Timing is a filter, not a signal. Next, nothing about 8:30 New York makes a trade good on its own. The filter simply removes the dead hours when marked zones get nudged rather than respected. Then, one practical warning from my own testing: MT4 and MT5 charts run on your broker’s server clock, not your local time. Work out the offset once, then set your session inputs in terminal time.
The ICT Concepts indicator includes session inputs for exactly this reason, shading the windows so every zone is graded in context. Yet, the dedicated Kill Zones indicator draws the boxes on their own, and the sessions hub collects the full set of session tools.
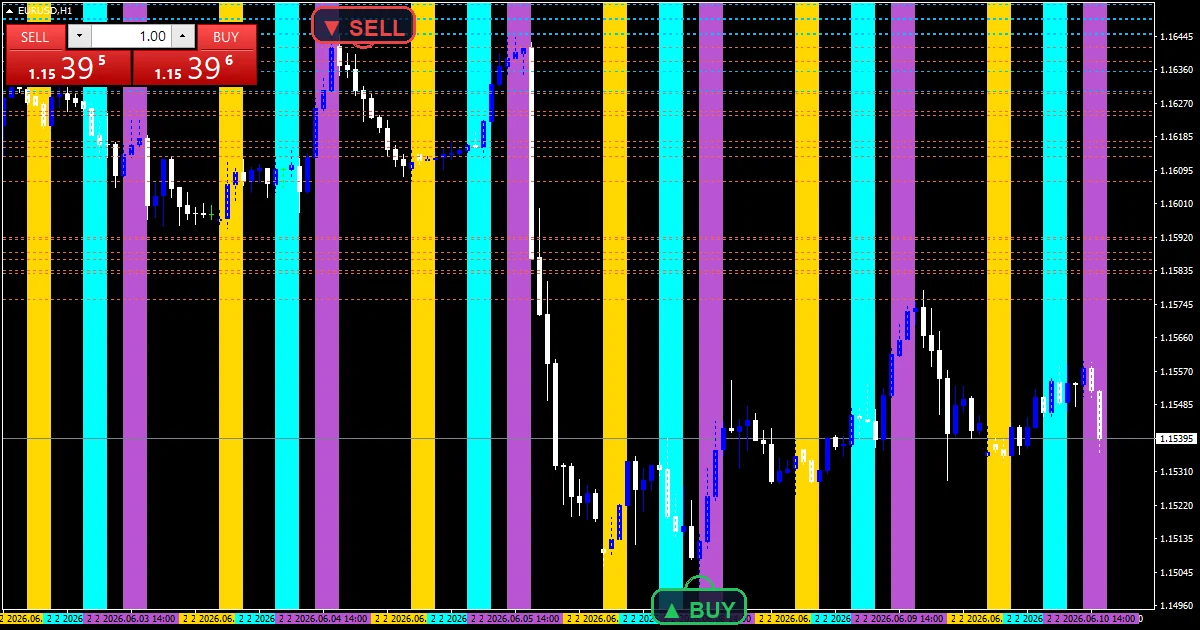
| Concept in one line | Institutional flow concentrates in London and New York windows. |
| What the tool draws | Shaded kill-zone boxes in broker time, alongside structure marks. |
| Where it helps | Skipping low-volume hours when zones drift instead of react. |
The 2022 mentorship model
The 2022 mentorship model is ICT’s most famous complete sequence, and it chains the earlier concepts into one ordered checklist. Truly, step one: price sweeps a liquidity pool, running the stops beyond an obvious high or low. Step two: price displaces hard in the opposite direction and confirms a shift, the CISD or a structure break, proving the sweep was a raid rather than a genuine breakout. Plainly, step three: the displacement leaves a fair value gap, and the entry is the retrace into that gap, with the stop beyond the swept extreme and the target at opposing liquidity.
The strength of the model is its order. Also, a gap entry without a preceding sweep is a different, weaker trade. A sweep without displacement proves nothing yet. Indeed, each step qualifies the next, which is what makes the sequence teachable and testable.
Tracking three conditions in sequence, live, across pairs is exactly the work a human does badly and a program does well. Still, the ICT 2022 Mentorship Trading Model indicator encodes the full state machine. It watches for the sweep, waits for confirmation, then marks the entry gap only when the chain completes. Thus, incomplete chains simply expire, which is most of them. That silence is the point.

| Concept in one line | Sweep, then confirmed shift, then entry at the displacement gap. |
| What the tool draws | Each stage of the chain, with entries marked only on completion. |
| Where it helps | Enforcing the sequence, so you stop taking gap entries with no story behind them. |
Turtle soup and false breaks
Turtle soup is the oldest idea on this page. Hence, it comes from Linda Raschke’s fade of the Turtle traders’ breakout system: when price pokes beyond a well-watched prior extreme and fails, you trade the snap back into the range. ICT adopted the setup and reframed it in liquidity terms. Next, the poke beyond the high is the sweep. The failure is proof the raid has finished. Then, the trade is the return trip.
The setup shines in two environments. Yet, ranging markets, where extremes are clear and stop clusters rebuild at each boundary. And session extremes, where the previous day’s high or low, or the London high before New York, gives everyone the same reference point. In a strong trend it suffers, because pokes through highs keep going. Context first, pattern second.
The ICT Turtle Soup indicator watches recent range extremes and marks a qualifying failed break as it completes, requiring the poke and the rejection before printing anything. Truly, it pairs naturally with the buy-side liquidity tool above: one shows where the raid should happen, the other confirms it did.

| Concept in one line | A failed break of a watched extreme signals the sweep is complete. |
| What the tool draws | Range extremes and arrows on qualifying failed breaks. |
| Where it helps | Range conditions and session extremes with predictable stop clusters. |
Building an ICT workflow on MT4/MT5
You do not need all eight tools at once. Plainly, loading everything produces a chart nobody can read. My suggested stack is three indicators with three separate jobs. First, a map: the ICT Concepts indicator or the ICT SMC indicator on your higher timeframe, H4 or H1, for structure, blocks, and bias. Second, a target layer: the buy-side liquidity tool to mark the pools price is likely drawn toward. Third, an entry tool on M15 or M5: the 2022 model indicator, or the ICT Setup 04 indicator if you prefer one narrow, specific pattern that stays silent otherwise.
The order of analysis matters more than the tools. Also, read higher-timeframe structure first and take a directional bias. Map the liquidity pools next, because they are the targets and the trap zones. Indeed, only then drop to the lower timeframe and wait for an entry sequence inside a kill zone, in the direction of the bias. Skip any day where the three layers disagree. Still, the smart money hub and the ICT indicators hub hold every tool mentioned here if you want to compare variants.
Honest limitations
Now the part most ICT pages skip. Thus, smart money concepts are partly subjective. Two experienced traders will mark different order blocks on the same chart, and an indicator only removes that ambiguity by picking one rule set, not by picking the true one. Hence, the institutional-intent story behind each zone is also an inference. Nobody on this page can see actual bank orders, and neither can any indicator.
Price ignores marked zones every single week. Gaps sometimes never fill. Sweeps sometimes keep going and become real breakouts. Next, this is why confirmation and risk rules are not optional extras. Require the sequence, not the zone alone. Then, size positions so a normal string of losers does not matter. Demo-test any tool from this page first, and judge it over dozens of trades, not three. Yet, the tools mark conditions honestly; the outcomes remain probabilistic.
How these ICT indicators are built and tested
Every indicator here is built in-house for both platforms and shipped as compiled .ex4 and .ex5 files in one download, free after an email opt-in. Truly, before release, each build goes through the checks in my editorial testing policy: compile with zero errors, load on live-data charts, and verify that every drawn object matches the concept’s definition. Nothing repaints its printed history. Plainly, if you are new to MetaTrader, the installation guide walks through setup on both platforms in a few minutes.
Want the full ICT toolkit? Download the complete database above.
Learn each ICT concept in depth
Every concept in this guide now has its own full tutorial. Each one teaches the idea in plain English, then shows the exact tool that marks it on your chart.
- Fair Value Gap Trading
- Order Block Trading Guide
- Liquidity Sweep Trading
- ICT Kill Zones
- ICT Silver Bullet Strategy
- Judas Swing Trading
- SMT Divergence Explained
- ICT Power of Three
FAQ
Do ICT indicators repaint?
The tools on this page confirm on closed bars, and printed marks stay printed. Also, one nuance is inherent to the concepts: a live order block or gap extends forward until price mitigates it, so open boxes update their length. That is the concept working, not repainting. Past signals never move.
Which ICT indicator should a beginner start with?
Start with the ICT Concepts indicator. Indeed, it draws structure, order blocks, and gaps together, so you learn to recognize each element on real charts. Once you know which patterns you actually trade, narrow down to a focused tool such as the 2022 model or turtle soup indicator.
Do these ICT indicators work on MT5 as well as MT4?
Yes. Still, every download includes both compiled versions in one zip, built from the same logic. Install the file that matches your terminal and the drawings will match across platforms.
Is ICT the same as smart money concepts?
They overlap heavily but are not identical. Thus, smart money concepts is the broad umbrella: structure, order blocks, liquidity, and imbalances. ICT is Michael Huddleston’s specific teaching within that umbrella, adding named models such as CISD, kill-zone timing, and the 2022 sequence. Hence, every ICT tool is an SMC tool; not every SMC tool follows ICT’s exact definitions.
Can these indicators predict where price will go?
No. Next, they locate zones and sequences defined by past price action; the market decides what happens next. Use them for context, demand confirmation, and manage risk on every position. Results are not guaranteed; past performance is not indicative of future results.
External references
- Learn more about the underlying method in Constant function market maker on Wikipedia.
- For wider market background, see Traffic Light at StockCharts ChartSchool.
Background reading: how much to risk per trade.

About the author
Written by Dominic Walsh, a Forex trader and MT4/MT5 indicator, Expert Advisor and script developer. Every tool on forexmt4systems.com is tested on live charts before release and ships with ready-to-use compiled MT4 (.ex4) and MT5 (.ex5) files. Learn more about the trader and developer behind this site.
How we build, test and correct every tool: Editorial & Testing Policy. Trading carries risk; see the disclaimer.