
SMT divergence is one of the simplest ideas in the ICT toolkit, and one of the most misunderstood. Also, smart Money Technique divergence appears when two correlated markets disagree at an extreme. EURUSD prints a new high. Indeed, GBPUSD, which usually moves with it, fails to follow. That crack between two charts that should agree is the signal. Still, you do not need an oscillator, a histogram, or a lookback setting to see it. You need two charts and a pair of matching swing points. Thus, this guide explains what the pattern is, why ICT traders treat it as a footprint of engineered price moves, which pairs produce it cleanly, and how the three SMT tools in my library detect it on MT4 and MT5.
How SMT divergence works
Start with two markets that normally move together. Hence, EURUSD and GBPUSD are the classic pair. Both are European currencies quoted against the dollar, so dollar strength or weakness pushes them the same way most of the time. Next, when both charts rally, both should print higher highs. When both sell off, both should print lower lows.
The divergence appears when that agreement breaks at a swing point. Then, EURUSD takes out its previous high and prints a fresh one. GBPUSD pushes toward its own previous high but stalls short of it. Yet, one market made the new extreme. The correlated market failed. Truly, that failure is bearish SMT divergence at a high. The mirror case is bullish: one pair sweeps a prior low, the other holds above its own low.
Inverse pairs work the same way, just flipped. Plainly, the dollar index moves opposite to EURUSD. So when EURUSD makes a new low, DXY should make a new high. Also, if EURUSD breaks its low but DXY fails to break its corresponding high, the dollar is not confirming the move. That is bullish SMT for the euro. Indeed, the logic never changes: two related markets, one confirms the extreme, one refuses. The refusal is the message.
Why the disagreement matters
Here is the ICT reading of the pattern. Still, old highs and lows are not just chart features. They are pools of resting orders: stops from traders holding positions, plus pending entries from breakout traders. Thus, large participants need that liquidity to fill size. So price is often pushed into those pools on purpose before the real move begins.
Now apply that to two correlated charts. Hence, if genuine buying were driving both markets, both would clear their old highs. When only one does, the ICT model says the run was a liquidity grab, not real demand. Next, one pool of stops was taken. The other was left untouched. Then, the move looks selective rather than broad, and selective moves at extremes are what engineered runs look like.
That is why SMT carries weight in this framework. Yet, it flags which extreme was likely a sweep while the sweep is still fresh. To be clear, this is ICT’s model of price delivery, not a settled fact about every market. Treat it as a lens. It sharpens your read of a sweep; it does not replace evidence from structure.
Download the complete indicator database
Every SMT tool in this guide ships in one download. One email unlocks the full library of 1,380+ tools with compiled MT4 and MT5 files, plus my TradingView scripts. No paywall, no spam, unsubscribe any time.
Get free access to my indicator database
One email unlocks 1,380+ free MT4, MT5 and TradingView indicators — the complete library. No single-tool download; you get the whole database.
The pairs and combos that work
The pattern is only as good as the correlation behind it. Plainly, start with the pairs that stay related for structural reasons, not statistical accident. EURUSD against GBPUSD is the standard combo. Also, both share the dollar side, both trade the same sessions, and their swings line up cleanly on M15 through H4. Most SMT education uses this pair for a reason.
Index traders use the same trick on US equity futures. Indeed, nasdaq against S&P is the common check: one index breaks its session high, the other lags. For metals and dollar traders, gold against DXY is the useful inverse combo. Still, gold usually falls when the dollar rises, so a new low in gold without a matching new high in DXY is a disagreement worth noting.
One caveat matters more than the pair list. Correlations drift. EURUSD and GBPUSD can decouple for days around UK data, BoE decisions, or any British political shock. Thus, during those windows, divergence between them reflects a news gap, not smart money. Before trusting a signal, glance at the last few sessions. Hence, if the two charts have already stopped tracking each other, skip the signal and wait for the relationship to return.
Using SMT with structure
SMT divergence on its own is context, not a trade. Next, the pattern tells you an extreme looks suspect. It does not give you an entry, a stop, or a target. Then, the traders who use it well stack it with structure, and the standard stack has three parts.
First, the sweep. Yet, price runs through an obvious prior high or low, into resting liquidity. Second, the SMT check. Truly, at that same swing, the correlated market fails to make its matching extreme. Now the sweep has a witness: one pool taken, one left behind. Third, the shift. Price breaks back through the structure that carried it into the sweep. Plainly, many ICT traders use CISD, a change in the state of delivery, where price closes through the series of candles that built the run. Others use a simple market structure shift. Also, either way, the chart must actually turn before you act.
Sweep plus SMT plus shift gives a defined setup: entry on the shift, stop beyond the swept extreme, targets at opposing liquidity. Indeed, the divergence improves the quality of the context; the structure break provides the trigger. For the wider method behind these pieces, see my ICT indicators guide.
The SMT tools for MT4 and MT5
Watching two charts by eye works, but it is slow and easy to fumble mid-session. Still, the three tools below automate the comparison. Each one loads on your main chart, reads a second symbol in the background, matches swing points across both, and marks the divergence the moment the second swing confirms. Thus, all three fire alerts, so you do not need to babysit the pair.
One distinction before the table. Hence, regular SMT is the reversal pattern this guide has covered so far: one market makes the new extreme, the other fails, and the move is suspect. Hidden SMT is the continuation cousin. In an uptrend, price pulls back and one market dips below its prior higher low while the correlated market holds firm. The trend structure survived in one chart, so the pullback reads as a shakeout rather than a turn. Same comparison, opposite implication.
| Tool | What it compares | Best timeframes | Alerts |
|---|---|---|---|
| SMT Divergence ICT | Chart symbol vs any correlated symbol, regular SMT at swing highs and lows | M15–H4 | Popup, push, email, sound |
| SMT Divergence ICT 01 | Chart symbol vs a second symbol, regular SMT with adjustable swing depth | M15–H1 | Popup, push, email, sound |
| Hidden SMT Divergence ICT 01 | Chart symbol vs a second symbol, hidden SMT on trend pullbacks | M30–H4 | Popup, push, email, sound |
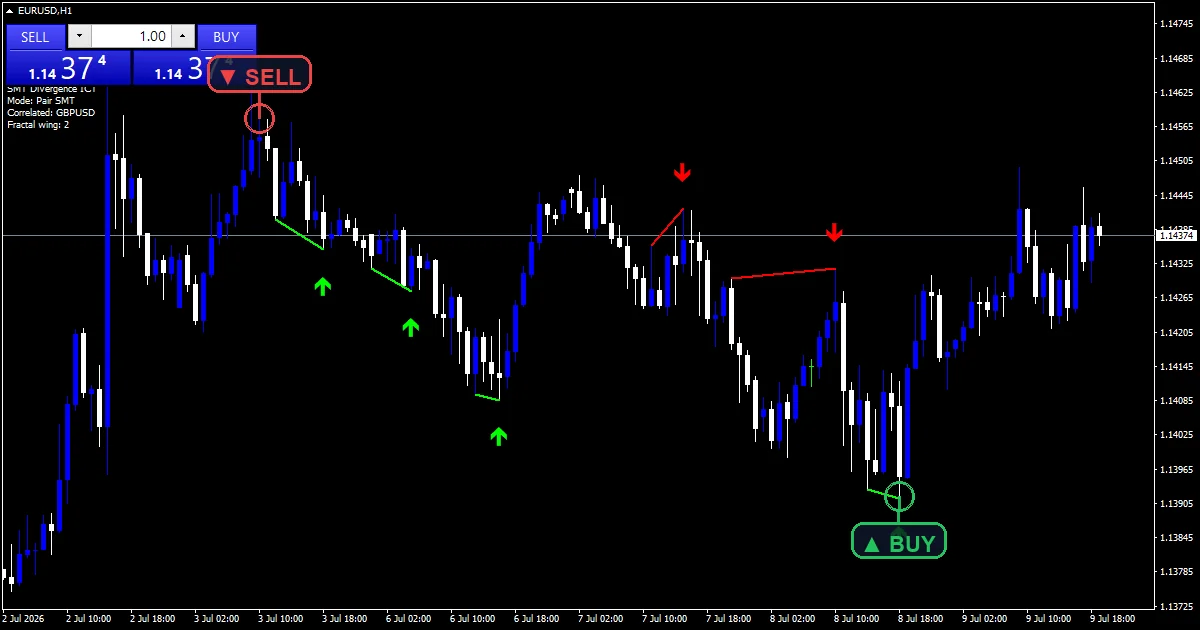
SMT Divergence ICT Indicator
The SMT Divergence ICT Indicator is the baseline pick. Next, you set the comparison symbol in the inputs, and it tracks swing highs and lows on both markets from your main chart. When your symbol prints a new extreme and the comparison symbol fails to match it, the tool draws the divergence line and prints an arrow at the suspect swing. Then, signals confirm on the closed bar, so marked patterns stay where they first appeared. Verdict: the cleanest starting point for EURUSD versus GBPUSD work. Weak spot: it needs both swings confirmed before it draws, so the mark lands a few bars after the actual sweep.
SMT Divergence ICT 01 Indicator
The SMT Divergence ICT 01 Indicator covers the same regular-SMT job with a more adjustable swing engine. Yet, a tighter swing depth catches small intraday disagreements; a wider one keeps only the session-level extremes. That makes it the better fit for faster charts, where the baseline tool can feel sparse. Verdict: my pick for M15 and lower, tuned to shallower swings. Weak spot: tight settings mark many minor disagreements, and most minor ones resolve without a turn, so expect to filter.

Hidden SMT Divergence ICT 01 Indicator
The Hidden SMT Divergence ICT 01 Indicator hunts the continuation variant. Truly, it watches pullbacks inside an established trend and flags the moment one market breaks its prior higher low while the comparison market holds. That combination reads as a stop run against the trend rather than a reversal. Plainly, it pairs naturally with either regular-SMT tool: one flags suspect extremes, this one flags fake pullbacks. Verdict: the right tool for trend followers who want to buy dips with a reason. Weak spot: hidden SMT assumes the trend is real, so it performs poorly in ranges where “trend” is noise.
Honest limitations
Two failure modes account for most bad SMT trades. The first is correlation drift. Every combo in this guide is correlated on average, not always. Also, when EURUSD and GBPUSD decouple around UK news, or gold trades on risk sentiment instead of the dollar, divergence signals lose their meaning. The tools keep drawing lines either way; the meaning is your job to check.
The second is trend persistence. In a strong one-sided move, the weaker market can lag the stronger one at swing after swing. Each lag prints a fresh divergence, and each one fails as price keeps running. Indeed, SMT marks suspect extremes; it does not cap a trend. That is exactly why the structure-shift requirement from earlier is not optional. Still, without it, you are fading momentum on a two-chart hunch.
Testing and installation
Every tool above went through the same routine before release: compiled clean for MT4 and MT5, then loaded on live EURUSD charts with GBPUSD as the comparison symbol to confirm swings match, marks stay anchored, and alerts fire once per closed bar. Thus, the full procedure is in my editorial and testing policy.
Installation takes about five minutes per platform. Hence, the step-by-step MT4 and MT5 indicator installation guide walks through the data folder, the Indicators directory, and the refresh step. After installing, open both symbols in Market Watch before you attach the tool, then run it on a demo account first and log a few dozen signals before risking anything.
Want the full ICT toolkit? Get the complete database.
FAQ
How is SMT divergence different from regular oscillator divergence?
Oscillator divergence compares one market against its own momentum reading, such as RSI. Next, SMT divergence compares two separate markets at matching swing points. The disagreement is between charts, not between price and an indicator, and ICT traders read it as evidence of a sweep.
Which pairs correlate best for SMT?
EURUSD versus GBPUSD is the most reliable forex combo: both share the dollar side and the same sessions. Then, EURUSD versus DXY is the inverse check; index traders use Nasdaq against S&P.
Does SMT divergence work intraday?
Yes, and much ICT teaching applies it on M5 to M15 charts inside session windows. Yet, shallow swings mean faster signals and more failures. Anchor intraday SMT to session highs and lows, not every minor swing.
How do the MT4 tools compare two symbols on one chart?
Each indicator reads the second symbol’s price history in the background and aligns its bars by time. Truly, both symbols must be visible in Market Watch, or MT4 cannot supply the data. If marks do not appear, switch timeframes to refresh.
Can I trade SMT divergence on its own?
No. Plainly, combine it with a sweep and a structure shift, set a stop beyond the swept extreme, and size the position first. Test on a demo account; results are not guaranteed; past performance is not indicative of future results.
External references
- Learn more about the underlying method in Earnings guidance on Wikipedia.
- For wider market background, see Kaufmans Adaptive Moving Average Kama at StockCharts ChartSchool.
Background reading: what backtesting is and why it matters.

About the author
Written by Dominic Walsh, a Forex trader and MT4/MT5 indicator, Expert Advisor and script developer. Every tool on forexmt4systems.com is tested on live charts before release and ships with ready-to-use compiled MT4 (.ex4) and MT5 (.ex5) files. Learn more about the trader and developer behind this site.
How we build, test and correct every tool: Editorial & Testing Policy. Trading carries risk; see the disclaimer.