
A number prints, and a quiet chart turns violent inside a second. That burst is a forex news spike, and almost every trader meets one before anyone explains how it works.
This guide takes the sequence apart. The impulse, the spread blowout, the stop run, the fade, and the execution risk that decides what you actually paid.
What a Forex News Spike Actually Is
A spike is a short burst of one-way trade after new information arrives. Orders queue on one side, the other side steps away, and price travels a long distance in very little time.
The word describes the shape rather than the cause. Scheduled releases produce most of them, though a headline or a large order can do the same job.
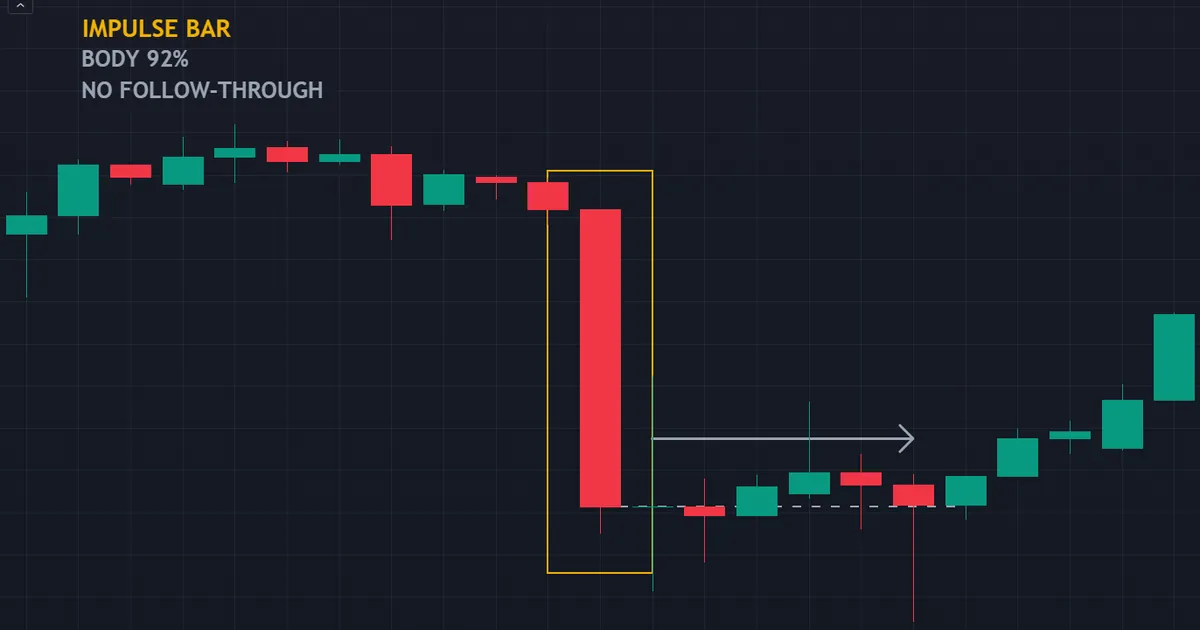
Above sits a reaction bar on USDJPY four-hour candles at 05:00 on 2 July 2026. Naming the trigger adds nothing here, because the shape carries the whole lesson.
The Impulse in Numbers
Its range covered nearly seven times the recent average. The body filled 92 percent of that range, and the close sat at the extreme.
Those three facts describe a market with one active side. Nobody offered meaningful resistance while the bar formed.
A body that fills most of the range is the signature. Small bodies inside wide ranges mean something else entirely, and we come back to that later.
Follow-Through Is a Separate Question
Here is the part that surprises people. That bar closed at its low, and the next five drifted back the other way by about half an average range.
So the impulse was real and the continuation never arrived. A convincing candle says what already happened, and it promises nothing about the next hour.
Keep those two ideas apart. The size of a spike and the durability of a spike are different measurements.
Anatomy of the Spike, Stage by Stage
The sequence repeats with remarkable consistency. Five stages cover almost every one.
- The print lands. Machine-readable feeds deliver the number, and automated systems react in milliseconds. Human traders are still reading the headline at this point.
- Liquidity disappears. Market makers pull their quotes rather than trade against information they cannot yet price. The book thins, and the spread blows out.
- Stops run. Price sweeps through resting stop orders beyond the recent range, and each one triggers a market order in the same direction. That fuel makes the move look stronger than the news alone would.
- Profit-taking begins. Fast money that entered on the print starts closing. Supply arrives from the side that just made money, and the move stalls.
- The detail gets read. Analysts publish the breakdown, revisions and components surface, and price often gives back a large slice of the impulse.
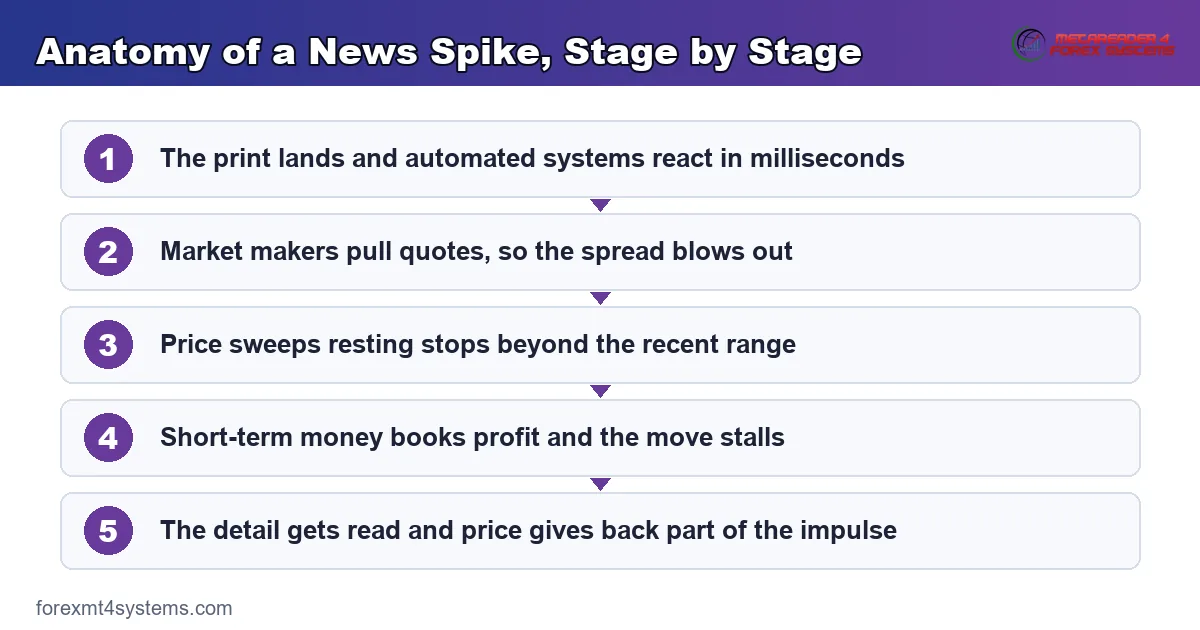
Notice how little of that involves opinion about the economy. Most of the movement comes from mechanics: thin books, resting orders and short holding periods.
Stage One and Two Happen Together
You cannot separate them in practice. The feed and the quote withdrawal land in the same instant, which is why the first tick after a release looks so strange.
Charts hide this completely. A candle draws the trade prices, and it never shows the gaps in the book between them.
Stage Three Explains the Overshoot
Stops cluster in obvious places. Just beyond the session high, under the round number, past yesterday’s low.
When price reaches those clusters, the orders convert to market orders automatically. So a modest surprise can produce a move far larger than the surprise deserved.
That overshoot is also why the extreme rarely holds. The buying or selling behind it came from forced exits, not from conviction.
Stages Four and Five Set the Tone
The stall arrives sooner than most people expect. Systems that entered on the print hold for seconds, so their exits land while the candle is still young.
Then the interpretation phase begins. Components, revisions and central bank commentary all reach the wires within minutes, and each one can flip the reading.
By the end of stage five the market has an opinion. That opinion frequently differs from the one the first tick expressed.
Which Moments Produce the Sharpest Spikes
Not every release makes a mess. The sharp ones share a few features.
The Usual Sources
- Rate decisions and statements. A change in guidance rewrites the whole policy path, and the press conference afterwards adds a second wave.
- Inflation prints. These set the constraint a central bank works inside, so a miss forces an immediate rethink.
- Employment reports. Headline, wages and revisions arrive together, which produces conflicting signals inside one release.
- Unscheduled remarks. A policymaker answering a question moves price with no forecast column to anchor the reaction.
- Thin hours. A modest headline during the late Asian session moves further than a big one during London, simply because fewer participants stand ready.
Liquidity matters as much as the news itself. One surprise produces very different spikes at different hours of the day.
Minor currencies exaggerate everything. Thinner books mean wider gaps between prices, so the same percentage surprise travels further.
Why the Spread Blows Out
Every quote you see comes from somebody willing to take the other side. During a release, that willingness collapses.
Where Your Price Comes From
Your broker aggregates quotes from liquidity providers. Each provider posts a bid and an ask, and the best pair becomes your spread.
Those providers face a simple problem at a release. Anyone hitting their quote in that second probably knows the number, and they do not.
So they widen, or they step aside entirely. Our explainer on the spread in forex covers the normal-conditions version of this.
What Widening Actually Costs
Cost scales with the gap between bid and ask. A pair quoting under a pip on a quiet afternoon can quote many times that during a release second.
Your entry pays half of that gap, and your exit pays the other half. A round trip through a widened market therefore costs several times its normal amount.
Small targets suffer worst. A move worth fifteen pips loses a real share of itself to a spread that briefly quadrupled.
Instant Execution Versus Market Execution
These two account models fail differently, and the difference matters at exactly this moment.
Instant execution asks the broker to fill at the price you clicked. When that price has gone, you get a requote and a choice.
Market execution fills you at whatever price exists. No requote appears, and slippage takes its place.
Neither model is better in the abstract. Know which one your account uses, because it decides what a release day feels like.
Slippage Is Not Automatically Malpractice
Traders reach for that accusation quickly, and it usually misses. Slippage happens when price moves between the request and the execution.
During a spike, price moves constantly. Your order takes microseconds to reach the server, and the market can travel several pips in that window.
Slippage also runs both ways. Positive slippage exists, and most platforms report it, though nobody complains about that half.
Persistent one-sided slippage is a different matter. Track your fills over dozens of trades before drawing any conclusion about your broker.
Execution Risk: When a Gap Jumps Your Stop
Slippage is the everyday version of execution risk. A gap is the extreme version, and it deserves its own example.

Above sits silver on hourly candles at the Sunday reopen, 22:00 on 26 July 2026. Price opened about 1.14 above the prior close, roughly 2.4 average ranges, and jumped clean past a short position’s stop level at 58.6415.
What That Meant for the Order
The stop never traded at 58.6415. No price existed there, because the market reopened above it.
So the order converted to a market order and filled at the first available price. The trader took the loss they planned, plus the entire gap on top.
Nothing malfunctioned. The mechanism worked exactly as designed, and the design cannot invent liquidity that was never there.
Why a Stop Cannot Hold a Level
A stop order is an instruction, not a reservation. It says sell when price touches this level, and it accepts whatever the market offers next.
In calm conditions the two prices sit close together. In a spike or a weekend gap they separate, sometimes dramatically.
Our guide to the weekend gap in forex covers the Sunday reopen in more detail.
What Reduces the Damage
Position size does most of the work. A gap that costs twice the planned loss hurts far less on a small position than a large one.
Timing helps too. Flattening or trimming before the weekend break removes the exposure completely.
Our note on using a stop loss covers placement, and placement matters more than the stop type ever will.
Download the complete indicator database
Put these concepts on your charts. One email unlocks the full library of 1,380+ indicators with compiled MT4 and MT5 files, plus my TradingView scripts. No paywall, no spam, unsubscribe any time.
Get free access to my indicator database
One email unlocks 1,380+ free MT4, MT5 and TradingView indicators — the complete library. No single-tool download; you get the whole database.
Common Mistakes and the Fixes
Six habits turn an ordinary spike into a painful one. The panel below pairs each with its correction.

Chasing the Candle While It Prints
The move you can see has already happened. Entering mid-impulse means paying the widest spread of the day for the last part of a run.
Assuming the Stop Fills at Your Price
Touch and fill are two separate events. Plan for a worse exit than the level you chose, and size the position so that difference stays survivable.
Judging the Spread From a Quiet Hour
Your broker’s advertised spread describes a calm market. Watch the live quote thirty minutes before a release to learn what it does under pressure.
Keeping Normal Size Through the Event
Range expansion multiplies the risk in an unchanged lot size. Cut the size, or stand aside until the range settles back down.
Reading the Extreme as the Verdict
Wicks record failed attempts, not agreements. Read the close, and treat the far end of the bar as evidence that somebody pushed back.
Trading the Number Instead of the Surprise
Price already holds the expected outcome. Our guide to high impact news in forex explains how to read the consensus before the print.
Quick Reference: The Spike Timeline
Keep this beside the calendar. It maps what happens against what you can sensibly do.
| Moment | What is happening | What makes sense |
|---|---|---|
| Minutes before | Spreads begin widening, volume thins out | Decide exposure now, while thinking stays calm |
| The first second | Machines trade, quotes vanish, price jumps | Nothing. No retail order competes here |
| Seconds one to thirty | Stops run, the move overshoots | Watch. Note the extreme for later reference |
| The first minute | Profit-taking arrives, the move stalls | Still watching, spread still wide |
| Five to fifteen minutes | Spread normalises, a range starts forming | Mark the high and low of the impulse |
| The first bar close | Detail published, direction clearer | Trade the level if your plan allows it |
When the Spike Fades
Impulses hand themselves back more often than beginners expect. Below, a bar closed well off its low, and the next five recovered about 1.8 average ranges upward.

That describes an hourly bar on USDJPY at 07:00 on 22 July 2026. Its range covered more than five times the average, and yet the body filled only 32 percent of it.
The Body Told the Story
Compare the numbers with the first chart. That bar carried a 92 percent body and closed at its extreme, which reads as one-way trade.
This one carried a 32 percent body. Two thirds of the range ended up as wick, so most of the distance price travelled got handed straight back inside the hour.
A long tail marks a failed attempt. Somebody pushed, somebody else pushed harder, and the close records who won.
Why the First Move So Often Reverses
Three ordinary forces explain it. None of them involves anyone hunting you personally.
Forced buying and selling ends. Stop orders convert once, then that fuel is gone, and price has nothing left pushing it.
Short holding periods do the rest. The systems that entered on the print measure their trades in seconds, so their exits arrive almost immediately.
Then the reading changes. A headline beat with soft internals looks worse an hour later, and positions taken on the headline unwind.
Reading a Fade While It Runs
You cannot know in the moment, though you can watch the tells. Three of them show up regularly.
Watch the tail growing against the impulse. A wick extending while the bar is live means active resistance rather than absence of interest.
Watch the related pairs. When a dollar move fails to appear across the other dollar pairs, the story looks thinner than it first seemed.
Watch the pace as well. Impulses that slow down and start overlapping have usually finished.
Trading Around Spikes Without Trading Them
Most consistent traders leave the first minute alone. They still use the release, and they use it differently.
The Levels a Spike Leaves Behind
A spike prints a high and a low that everybody can see. Those two prices become reference points for hours afterwards.
So mark them once the bar closes. A later break of the impulse extreme means something, and a failure at it means something else.
The Range That Follows
Markets frequently spend the next few hours digesting the move. That calmer phase offers ordinary spreads and readable structure.
Our guide to using news to trade forex covers that patient approach in full.
Measuring What Normal Looks Like
Judging an abnormal bar requires a baseline. Our forex volatility calculator gives you the average daily range for a pair in seconds.
On the chart itself, our volatility indicators archive collects tools that plot range expansion as it happens.
What a Spike Costs Before It Pays
Every release trade starts behind. Three costs land before any move helps you.
The Entry Cost
You cross the spread to get in. When that spread has quadrupled, the crossing costs four times its usual amount.
Slippage adds to it. The price you clicked and the price you got can differ by several pips in a fast market.
The Exit Cost
Leaving costs the same again. A stop triggered inside the impulse pays the widened spread plus whatever gap sits beyond your level.
So a round trip through the worst seconds can cost many times a quiet-hour round trip. Nothing about the setup changes that arithmetic.
The Cost You Cannot See
Attention has a price too. A trader glued to a calendar row misses the ordinary structure forming elsewhere on the same chart.
Weigh that honestly. Release trading looks exciting, and excitement rarely correlates with the quality of a decision.
Adding It Up
Compare the total cost against your usual target before committing. A plan needing twenty pips to work looks very different once the round trip eats six of them.
Then run the same comparison on a calm hour. Most traders find the quiet version of their own setup holds up far better.
Related Guides and Tools
Spikes belong to a wider fundamentals routine. Two more companions round it out.
Start with the schedule. Our free economic calendar lists release times, forecasts and previous prints for every major economy.
Then learn the survey tier, since those releases produce spikes as sharp as any. Our guide to what PMI means in forex explains why a questionnaire moves a currency.
FAQ
How long does a forex news spike last?
The violent part usually runs for seconds, and spreads normalise within a few minutes. A wider range often persists for an hour or more afterwards. Treat those as three separate phases, because each one asks for different behaviour: nothing during the first, patience during the second, and ordinary analysis during the third.
Can I place a pending order to catch the spike?
You can place one, and the fill is a different matter. A buy stop above the market becomes a market order the instant price touches it, so in a thin book it fills wherever liquidity happens to sit. Traders sometimes end up long at the extreme of a move that immediately reverses. Nothing about a pending order removes that risk.
Why did my stop fill so far from my level?
Because a stop is an instruction to trade at market once your price trades, and during a spike the next available price can sit some distance away. The silver example in this article shows the extreme case, where a weekend reopen jumped straight past a short’s stop level. Smaller versions of the same thing happen on release days constantly.
Do brokers widen spreads deliberately around news?
Widening comes from the liquidity providers behind the quote, and brokers pass it on. Some brokers add their own buffer as well. None of that is hidden malpractice by default, though the effect on your costs is real. Watch your own platform through a few releases and you will learn its habits quickly.
Is fading the spike a strategy?
Some traders do exactly that, and it carries the same execution problems as trading the impulse. Entering against a live move means paying a wide spread and guessing where the overshoot ends. A calmer version waits for the first bar to close and works from the level it leaves behind.
Can an indicator warn me before a spike?
Nothing predicts an unknown number. Range and volatility tools do something useful either side of it, though: they show when a market has gone quiet, which often precedes an expansion, and they show when the range has normalised afterwards. Use them to judge conditions rather than to forecast the print.
Why do spikes look bigger on some pairs than others?
Liquidity explains most of it. Major pairs carry deep books, so a surprise gets absorbed across many participants. Minor and exotic pairs carry thinner books, and the same order flow travels much further through them. Session timing adds to the effect, since a release landing in a quiet hour meets fewer willing counterparties.
Should beginners trade news spikes at all?
Very few benefit from it. The costs land first, the fills land worse than the screen suggests, and the direction after a release is frequently counter-intuitive. Learning to protect an existing position through a release teaches more, and it costs less. Build the habit of reading the calendar, sizing conservatively and judging the reaction on a closed bar. Results are not guaranteed; past performance is not indicative of future results.
External references
- For background on this concept, see Volatility at BabyPips Forexpedia.
- For broader market context, see Fade at Investopedia.

About the author
Written by Dominic Walsh, a Forex trader and MT4/MT5 indicator, Expert Advisor and script developer. Every tool on forexmt4systems.com is tested on live charts before release and ships with ready-to-use compiled MT4 (.ex4) and MT5 (.ex5) files. Learn more about the trader and developer behind this site.
How we build, test and correct every tool: Editorial & Testing Policy. Trading carries risk; see the disclaimer.