
ICT PD arrays are the ordered family of price zones — order blocks, breakers, mitigation blocks, fair value gaps and their relatives — that Michael Huddleston, the Inner Circle Trader (ICT), treats as the only places worth trading from. PD stands for premium and discount. So after this guide you will know every array in the matrix, the order ICT ranks them in, and how to grade one zone against another before price arrives.
Plainly, this is a framework post. Each individual array has its own deep-dive article, and this page shows how they all fit into one ranked map.
What Are ICT PD Arrays?
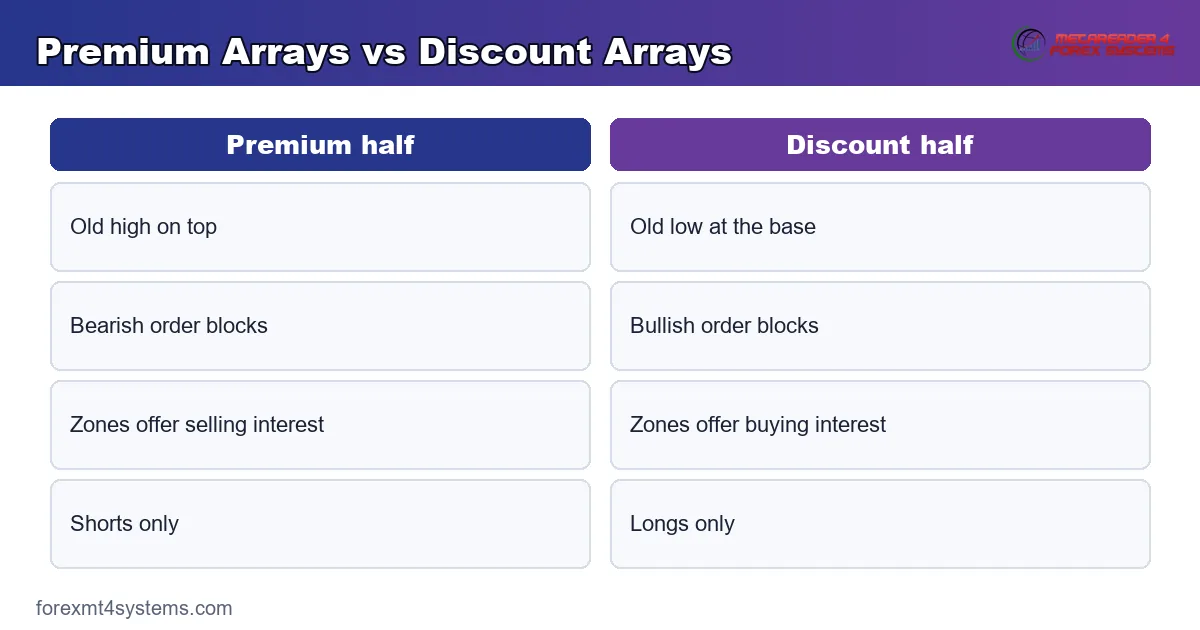
A PD array is a repeatable price pattern that marks where institutions previously acted, and where price may react again. The “PD” prefix ties each array to the two halves of a dealing range: premium above the 50 percent midpoint and discount below it. Thus bearish arrays live in premium and offer selling interest, while bullish arrays live in discount and offer buying interest. Together they form what ICT calls the PD array matrix — a top-to-bottom map of every point of interest (POI) in a range. Array simply means an arranged series; the zones repeat in a predictable stack, like rungs on a ladder.
The chart below shows the idea in one image: a single XAUUSD (gold) rally on July 21, 2026 that stacked three arrays on top of one another.
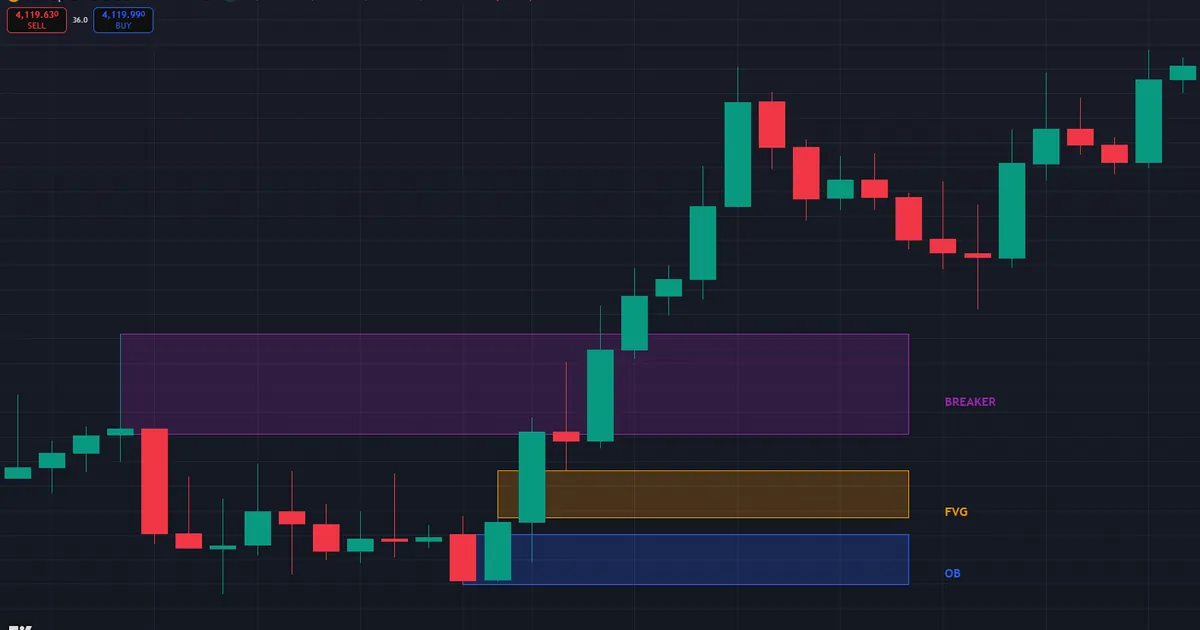
Reading the July 2026 gold stack
Gold broke upward from the 4,000 handle during the London-into-New-York run on July 21, 2026, and the leg printed three zones in strict sequence. At the base sits a bullish order block between 3,999.9 and 4,008.1 — the final down-closing cluster before the surge. Above it floats a fair value gap between 4,010.85 and 4,018.46, left where price jumped without overlap. Higher still, a breaker spans 4,024.4 to 4,040.8, born where a failed bearish zone flipped roles during the climb.
Stacked arrays like these are the matrix in miniature. A retrace from above meets the breaker first, the gap second, and the order block last. Hence the working question is never whether a zone exists. Instead, ask which rung of the stack deserves the entry — and that is exactly what the ranking below answers.
Why zones produce reactions
Each array marks a spot where somebody’s size went in or somebody’s position went wrong. An order block holds the fills of the players who drove the move, and a return visit lets them defend or add. A mitigation block holds trapped traders hoping for breakeven, and their exits fuel the reaction. Breakers hold both groups at once, which partly explains their high rank after a sweep. Thus the matrix maps stored decisions — and stored decisions, not lines on a chart, move price.
Why does the order matter? Price moving through a range meets these zones in sequence. Hence a trader who knows the matrix can anticipate the next likely reaction level before price gets there, instead of reacting after the fact.
The PD Array Matrix in Order
ICT teaches a mirrored list. First, premium arrays stack from the top of the range downward. Second, discount arrays mirror them from the bottom upward. The lists below give the canonical order.
Premium arrays, top down
- Old high — the previous swing high, a resting pool of buy-side liquidity.
- Rejection block — the wicks above a swing high that show failed buying.
- Bearish order block — the last up-closing candle before a sharp drop.
- Fair value gap — a three-candle imbalance left behind by fast selling.
- Liquidity void — a long one-sided run with little two-way trading, often holding several gaps.
- Bearish breaker — a failed bullish order block that price closed through, now acting as resistance.
- Finally, the bearish mitigation block — a failed swing where trapped buyers exit on the retest.
Discount arrays, bottom up
The discount side mirrors the list exactly: old low, rejection block, bullish order block, fair value gap, liquidity void, bullish breaker, and bullish mitigation block. Same logic, opposite polarity. Also, reading from the extreme low upward keeps the mirror image clear, though falling price naturally reaches the shallower arrays first.
The first graphic below draws the full ladder, with both halves mirrored around equilibrium, so the order stays visible at a glance.
The Block Family: Order, Breaker, Mitigation
Three of the arrays share a family name and confuse almost everyone at first. So here is the clean separation.
Order block vs breaker block
An order block keeps its polarity: a bullish one supports price on the return visit. Instead, a breaker block is an order block that failed — price closed through it, and its role flipped from support to resistance or the reverse. Entries come on the retest of the broken zone. Meanwhile, our comparison of breaker blocks vs order blocks walks through both rule sets side by side.
Mitigation block
A mitigation block forms where a swing failed to take out the prior extreme before reversing. Trapped traders exit — mitigate their losses — when price returns, and that exit flow fuels the reaction. Hence it ranks below the breaker, because no liquidity sweep preceded it.
Gaps, voids, and rejection blocks
A fair value gap (FVG) is the three-candle imbalance, while a liquidity void is a broader one-sided run that often contains several gaps. Price tends to revisit both, and the full guide to fair value gap trading covers the entry mechanics. Next, the rejection block: it uses only the wicks beyond a swing extreme, which record orders that failed to hold price. Old highs and old lows sit at the very edge of the matrix because they are liquidity pools first and reaction zones second.
How ICT Ranks PD Arrays as Points of Interest
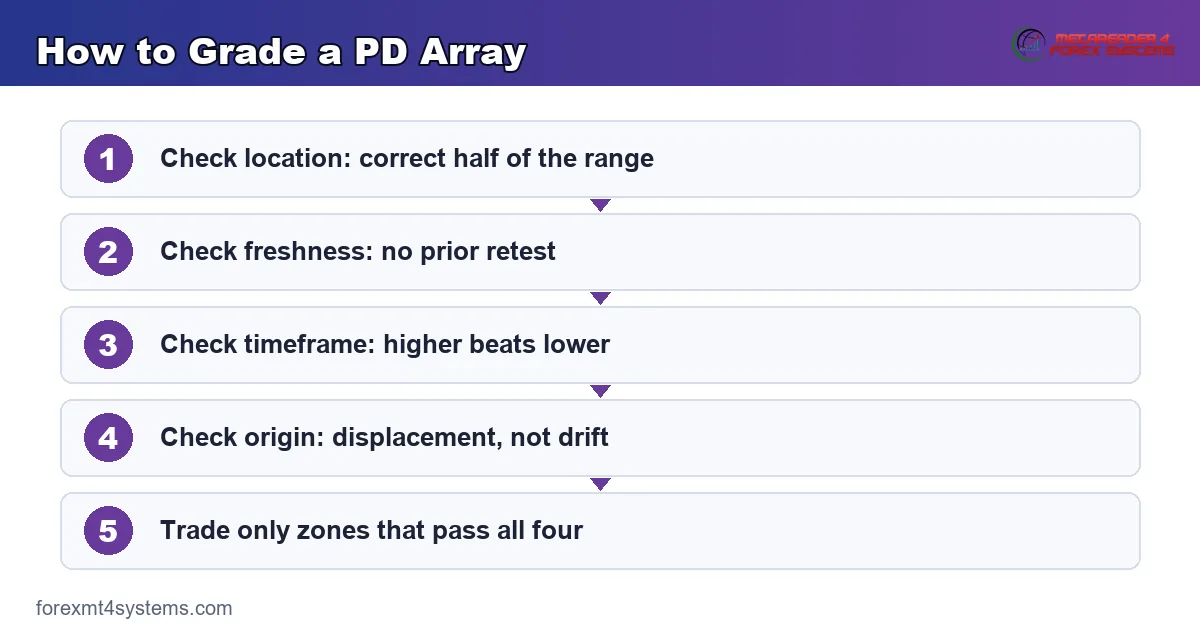
Not every array deserves a trade. Indeed, ICT grades each POI on four filters before it earns an entry.
- First, location. A bullish array only counts inside discount, below the range midpoint. Check the split with our premium and discount guide, or compute the exact levels with the free Fibonacci calculator.
- Second, freshness. An untouched array outranks one already retested, because resting institutional interest may remain.
- Third, timeframe. A daily order block outweighs a 5-minute gap; higher-timeframe arrays set the destination, and lower-timeframe arrays time the entry.
- Fourth, origin. Arrays created by displacement — a fast, full-bodied move that breaks structure — outrank zones left behind by slow drift.
Score a zone on all four filters and most candidates drop out. Truly, that pruning is the point: the matrix exists to shrink your watchlist to two or three levels per session.
Grading the gold stack with the four filters
Apply the filters to the July 21 gold chart and the ranking sorts itself. The order block at 3,999.9 to 4,008.1 scores well on origin and location — displacement built it, and it sits deepest in discount. The gap at 4,010.85 to 4,018.46 matches it on origin and adds the cleanest structure: a defined pocket price never traded through. Meanwhile, the breaker at 4,024.4 to 4,040.8 sits highest, so a shallow retrace reaches it first, yet its position closest to premium weakens a long taken there.
So the practical read runs: take the breaker only for quick, small-target trades; prefer the gap for the main entry; hold the order block as the final line where the whole bullish case rests. Notice that no filter needed an indicator — each answer came from location, freshness, timeframe, and origin alone.
Worked Example: GBPUSD Sell Setup
Suppose GBPUSD carves a dealing range between 1.34400 and 1.35600, putting equilibrium at 1.35000. Price rallies into premium during the New York session and sweeps the old high at 1.35600 by four pips. Then it displaces down through 1.35150, leaving a fair value gap between 1.35260 and 1.35340 and a bearish order block from 1.35400 to 1.35480.
Now the matrix reads cleanly. First choice: the fair value gap, fresh and sitting in premium. Second choice: the order block just above it, deeper in premium and still untouched. A short from the gap targets sell-side liquidity below 1.34400, with a stop above the swept high at 1.35650. One structured decision, and no indicator required.
Also, note what the matrix ignored. The 50-period moving average, round numbers, and pivot levels played no role; the read came entirely from the range, the sweep, and two fresh arrays inside premium.
Worked Example 2: Buying the Discount Stack on EURUSD
Now run the mirror image on the long side. The chart below walks a EURUSD 1-hour sequence from raid to entry, one numbered step at a time.

- First, mark the dealing range: low at 1.13200, high at 1.14400, equilibrium at 1.13800.
- Next, watch the raid: price dips to 1.13150, five pips under the range low, and snaps straight back — a sweep of sell-side liquidity.
- Then demand displacement: a full-bodied hourly candle drives up through 1.13520 and breaks short-term structure.
- Map the fresh arrays: the leg leaves a bullish fair value gap at 1.13300 to 1.13380 and an order block at 1.13180 to 1.13260, both in discount.
- Grade the candidates: the gap is fresh, displacement-born, in discount, and on the entry timeframe, so it outranks the deeper block.
- Last, execute: buy the retrace into the gap, stop at 1.13120 under the sweep, first target equilibrium, final target the range high.
Two details deserve attention. The stop lives under the sweep low rather than under the gap, because the sweep is the event that dies if price trades back through it. Also, the first target sits at equilibrium rather than the far extreme; a discount entry that reaches fair value has already done its main job, and any runner can hunt the range high from there.
Size the trade from the map, too. The distance from a mid-gap entry near 1.13340 to the 1.13120 stop spans about 22 pips, while equilibrium waits roughly 46 pips overhead. Hence even the conservative first target covers the risk twice over — when the read holds. Write those numbers down before entry, because a plan made mid-trade is a mood, not a plan.
Download the complete indicator database
Put these concepts on your charts. One email unlocks the full library of 1,380+ indicators with compiled MT4 and MT5 files, plus my TradingView scripts. No paywall, no spam, unsubscribe any time.
Get free access to my indicator database
One email unlocks 1,380+ free MT4, MT5 and TradingView indicators — the complete library. No single-tool download; you get the whole database.
PD Arrays in the Wider ICT Workflow
Arrays are the destination layer of the ICT model, not the trigger. First the daily bias picks a direction, then a kill zone provides the window, and a liquidity sweep plus a structure shift confirms the turn. Only after that chain does the trader drop to the matrix and select the highest-ranked fresh array for the entry.
For entry mechanics at the most common array, read the full order block trading guide. Also, chart tools can carry the mapping load: our catalog of ICT indicators for MT4 and MT5 includes tools that draw blocks, gaps, and range splits automatically.
Direction decides which half of the matrix even opens for business. A bullish bias switches the discount list on and the premium list off: every bearish array overhead becomes a target rather than an entry. Flip the bias and the roles flip with it. Hence two traders can stare at identical zones and trade opposite sides of them — the matrix only gains meaning once a bias sits on top of it.
Timeframe pairing and session timing
Pair the timeframes deliberately. A common split marks the dealing range and arrays on H4 or H1, then refines the entry inside the chosen zone on M15 or M5. The higher timeframe owns the destination, and the lower one owns the trigger. Also, respect the clock: retests during the London window (2:00 to 5:00 AM New York time) or the New York window (7:00 to 10:00 AM) carry institutional flow, while Asian-session retests often drift through zones without conviction.
How to practice mapping the arrays
Skill here is mostly repetitions. Start with a blank GBPUSD 1-hour chart, mark the dealing range, and label every array you can find in each half. Then scroll forward one candle at a time and record which zones price respected. Twenty sessions of that drill teach more than any video, because your own mislabeled zones become the lesson.
Also, keep the chart clean. Two or three active arrays per half is plenty, and a hard limit forces the ranking discipline the matrix was built for.
Structure the drill log like a scientist. For every zone, record five fields: the array type, its half of the range, its grade on the four filters, whether price respected it, and what the reaction looked like. After a hundred logged zones, your own data tells you which array types you read well and which you consistently misjudge — feedback no course can sell you.
Common PD Array Mistakes and Their Fixes
Five errors dominate beginner charts, and each has a plain correction.
- Boxing every candle. A chart covered in zones ranks nothing. Fix: only displacement-born zones that broke structure qualify.
- Taking counter-bias entries. A bullish array in premium tempts constantly. Fix: run the location filter before anything else.
- Reusing spent zones. Second and third retests degrade fast. Fix: trade fresh arrays and retire touched ones.
- Anchoring ranges to minor swings. A wrong range flips every label. Fix: anchor only to swings that swept liquidity.
- Holding zones through red news. Releases override every array. Fix: stand down around the Consumer Price Index (CPI), Federal Open Market Committee (FOMC), and Nonfarm Payrolls releases.
The second graphic pairs each mistake with its correction, sized for a quick pre-session review.
A Pre-Entry Checklist for PD Arrays
Run this list before any array entry. One failed line means the trade waits.
- Dealing range anchored to two liquidity-sweeping swings.
- Bias direction set on the daily or 4-hour chart.
- Array sits in the correct half: discount for longs, premium for shorts.
- Zone is fresh, with no prior retest.
- Displacement created the zone and broke structure.
- Kill-zone timing supports the retest.
- Stop beyond the sweep keeps risk at or under 1 percent.
Also, keep the audit alive after the fact. A month of checked entries shows which line you skip most, and that line is where the losses hide.
Related Concepts to Study Next
Three companion reads extend the matrix naturally, and each one deepens a single rung of the ladder you have just learned. Our comparison of the fair value gap vs order block settles the most common zone confusion at entry time. Then the guide to the inversion fair value gap covers what happens when a gap fails and flips roles — the same polarity logic a breaker follows. Also, revisit the premium and discount guide linked above whenever range anchoring feels shaky, because every filter in the matrix leans on that split.
Limitations of the PD Array Matrix
The matrix has failure modes, and hindsight is the biggest. After a reversal, a chart offers so many candidate zones that something always “worked,” which flatters the method unfairly. Meanwhile, live conditions break arrays routinely: strong trends slice through premium zones without pausing, and stale levels give way once their resting orders are gone.
Also, the ranking stays discretionary. Two traders can draw different dealing ranges and therefore different premium and discount splits. News releases override every array on the chart. So treat the matrix as a map of possibilities, demand a sweep and displacement before entry, and size positions so a single failed array cannot damage the account.
A failure walkthrough: the array that never holds
Here is the failure that teaches the most. USDJPY trends down hard through a New York afternoon. A fresh bullish order block waits in discount, and price returns to it — then trades straight through without a pause. The chart below captures the moment the zone dies.

The invalidation rule is a close, not a touch. Wicks can pierce a zone and still respect it, yet a full candle closing beyond the far edge ends the zone’s life. Exit there, without negotiation, and let the range re-anchor before mapping again.
Afterwards, log three fields: the trend context you faced, the zone’s grade on the four filters, and whether displacement truly created it. Most invalidated zones fail that audit on origin — slow drift built them, and hope boxed them. Qualitatively, arrays against a strong trend give way far more often than arrays aligned with one, and no ranking filter fully removes that risk.
FAQ
What does PD array stand for?
PD stands for premium and discount. An array is a repeatable zone — an order block, breaker, mitigation block, gap, void, or rejection block — that sits in one half of the dealing range and may produce a reaction. Hence the name: every zone is judged by the half it occupies.
Which PD array is the strongest?
Context decides. A fresh higher-timeframe order block or fair value gap created by displacement usually ranks highest. Still, the same zone loses standing once price retests it or trades cleanly through it.
Is a PD array the same as a point of interest?
Nearly. A point of interest (POI) is any level a trader watches, while a PD array is a POI defined by ICT’s specific list and its premium or discount location. Thus every array is a POI, yet not every POI is an array.
Are PD arrays the same as supply and demand zones?
They overlap heavily, and a bullish order block looks much like a demand base. Yet the ICT matrix adds three extras: a ranked order, a premium-discount location filter, and a required displacement origin. Those filters shrink the candidate list far more aggressively than classic zone drawing.
How many PD arrays should I mark per session?
Two or three at most. Mark the highest-timeframe fresh arrays that align with your bias and ignore the rest. Indeed, a chart covered in boxes produces hesitation, not clarity.
Do PD arrays work outside forex?
The patterns appear on indices, metals, and crypto because they describe generic order-flow footprints. Still, liquidity behavior differs by market, so test each array type on your instrument first. Results are not guaranteed; past performance is not indicative of future results.
External references
- For background on this concept, see Order Block at BabyPips.
- For broader market context, see Retracement at Investopedia.

About the author
Written by Dominic Walsh, a Forex trader and MT4/MT5 indicator, Expert Advisor and script developer. Every tool on forexmt4systems.com is tested on live charts before release and ships with ready-to-use compiled MT4 (.ex4) and MT5 (.ex5) files. Learn more about the trader and developer behind this site.
How we build, test and correct every tool: Editorial & Testing Policy. Trading carries risk; see the disclaimer.