
Ask a trading forum which one matters more and the trading psychology vs technical analysis argument starts within three replies. One camp swears the chart decides everything. The other insists that mindset does.
Both answers miss the mechanism. In the trading psychology vs technical analysis question, analysis produces the decision, while psychology decides whether you take that decision exactly as your plan describes it.
Trading Psychology vs Technical Analysis at a Glance
These two things sit at different points in one chain. Asking which matters more is a bit like asking whether a recipe beats the cooking.
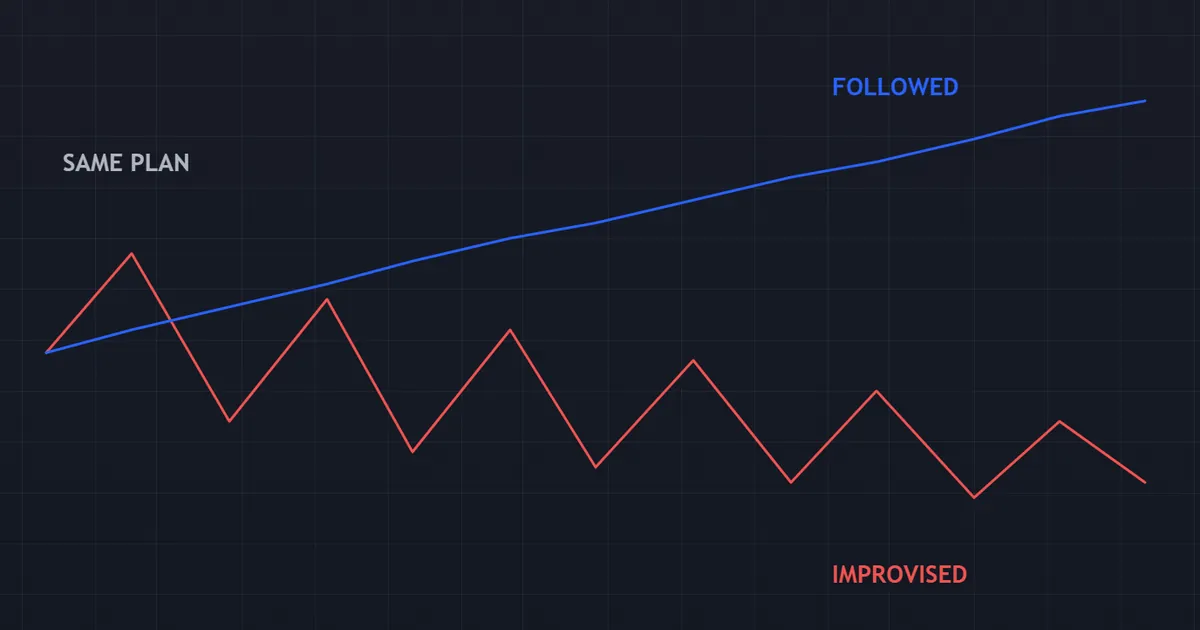
Look at the two equity paths in the panel above. Both came from the same rule set, and only the execution differed.
The Short Answer
Analysis gives you a reason to act. Psychology gives you the ability to act the same way on trade fifty as on trade five.
Neither side works alone. A sharp read that you abandon halfway through has no value, and firm discipline applied to a plan with no edge simply loses money more consistently.
So the useful question changes shape. Instead of picking a winner, ask which link in your own chain keeps breaking.
Why the Debate Never Ends
Each side can point at real evidence. Traders with weak charts lose money, and traders with strong charts lose money too.
Content also rewards the fight. A headline that pits two ideas against each other travels further than one saying both matter.
Meanwhile the honest answer sounds dull. Write the rules down, follow them, then measure the gap between the two.
What the Two Words Actually Cover
Technical analysis covers the study of price and volume history. Charts, levels, indicators and patterns all live under that heading.
Trading psychology covers how a person behaves while money moves. Hesitation, impulse, fatigue, ego and habit all sit inside it.
Those definitions barely overlap. So a trader can genuinely be strong at one and weak at the other without any contradiction.
What This Guide Does Instead
The sections below split the chain into parts you can inspect. You will see where a decision gets made, where it gets altered, and how to tell those two failures apart in your own records.
Nothing here needs new software. A spreadsheet, your trade history and one honest hour cover the whole exercise.
What Each Side Actually Produces
Give each discipline a job description and the overlap disappears. One writes the instruction, and the other carries it out.
What Technical Analysis Produces
Technical analysis turns price history into a decision you can state in one sentence. It names the condition, the entry, the invalidation point and the target.
Everything else falls outside its remit. A chart cannot tell you how you will feel at the third loss in a row.
What Trading Psychology Produces
Psychology governs the distance between your written rule and your actual click. That distance already has a name in every serious journal: deviation.
It also governs repetition. Because an edge only pays across a long run of trades, the ability to repeat one behaviour matters as much as the behaviour itself.
The Chain From Chart to Closed Position
Every trade travels the same route. Six steps separate the chart you watch from the result in your statement.
- Read the market. Your method describes the condition you trade and nothing else.
- Write the trade down. Entry, stop, target and size go on paper before you touch the platform.
- Size the position. Stop distance and risk per trade set the lot size, not your confidence.
- Place the order. The click either matches the note or it does not.
- Manage by the rule. Stops move only where the written rule allows it.
- Record the outcome. Result and deviation both go into the journal.
Steps one and two belong to analysis. Steps three through six belong almost entirely to behaviour, which explains why most leaks appear on the right-hand side of that list.

Why Loose Execution Erases an Edge
An edge describes an average across many trades. Skip the worst-looking ones and you no longer own that average.
Expectancy Needs Repetition
The trades you skip are rarely random. Traders tend to skip after losses, which is exactly when a choppy sequence often turns.
So the sample you actually traded differs from the sample you tested. Your results then measure your selection rather than your system.
The Sampling Problem in Plain Terms
Picture forty signals across a quarter. Your written plan takes all forty, while your live account took twenty-six.
Fourteen missing trades leave a gap you cannot audit. Because the missing ones cluster around drawdowns, that gap usually flatters the plan and punishes the account.
Where the Leak Usually Appears
Four behaviours account for most of the damage. Each one looks tiny on a single trade.
Traders widen a stop to postpone a loss. Winners get closed early to lock in a feeling. Size creeps up after a bad session to catch up. Then the signal that follows two losers gets skipped entirely.
None of those choices appear in a strategy document. All four appear in real account statements.
Notice what the four have in common. Each one arrives at the exact moment a rule felt uncomfortable, which is precisely why the rule existed.
A Worked Example of One System and Two Traders
Numbers make the point faster than argument. Give two traders the same rule set and watch the paths separate.
Both run one trend pullback method on the same pair list. Both risk one percent per trade, and both share the same written stop rule.

The Rules They Share
Take the signal whenever the condition prints. Risk one percent, place the stop beyond the swing, and target twice the risk.
Nothing in that description leaves room for opinion. Forty signals arrive across the quarter.
Trader A Follows the Note
Trader A takes all forty. Fifteen reach the target, twenty-three hit the stop, and two close early under a written time rule.
The arithmetic lands slightly positive. Fifteen winners at two units return thirty units, while twenty-three losers cost twenty-three units.
Costs then eat a slice of that gap. The quarter finishes modestly ahead, which is what a small edge looks like in real life.
Trader B Improvises
Trader B takes thirty-one signals. Nine went untaken after losing days, and two of those nine turned out to be the largest winners in the set.
Trader B also moved three stops. Two of those trades crawled back to breakeven, and one turned a small loss into a large one.
The same rule set finishes the quarter down. Nothing changed on the chart, and everything changed in the record.
What Separated Them
Neither trader had better analysis. They shared one document and one signal list.
The gap came from nine skipped entries and three moved stops. Twelve decisions across a quarter turned a modest gain into a loss.
Running the Same Quarter Again
Now imagine Trader B repeating the exercise with one change. They take every signal and leave every stop alone.
Their result lands on top of Trader A. The method never improved, and the paperwork simply stopped leaking.
This is the whole argument in miniature. Because the same chart produced both outcomes, the chart clearly was not the variable.
Our expectancy calculator shows how quickly a missing tail changes an average, and our trade journal gives you somewhere to log each deviation as it happens.
Download the complete indicator database
Put these concepts on your charts. One email unlocks the full library of 1,380+ indicators with compiled MT4 and MT5 files, plus my TradingView scripts. No paywall, no spam, unsubscribe any time.
Get free access to my indicator database
One email unlocks 1,380+ free MT4, MT5 and TradingView indicators — the complete library. No single-tool download; you get the whole database.
Where Behavioural Finance Fits In
The behaviours above are not personal defects. Researchers documented them long before retail trading existed.
Loss Aversion and the Disposition Effect
Prospect theory, developed by Daniel Kahneman and Amos Tversky, found that losses weigh heavier than equivalent gains. That asymmetry drives a very familiar pair of habits.
Traders hold losers to avoid booking the pain, then close winners early to secure the relief. Researchers call that pattern the disposition effect, and it shows up in real brokerage records across many markets.
Overconfidence After a Good Run
People routinely rate their own judgement above its measured accuracy. Trading hands that bias a lever, because confidence usually arrives as a bigger position.
Three winners in a row rarely change the underlying edge. Yet the fourth trade often carries double the risk of the first, which is how a good week becomes a flat month.
Confirmation Bias at the Chart
Once you form a view, you look for support rather than tests. Two more timeframes then get opened until one of them agrees.
Notice the crossover here. What began as an analysis habit ends up as a behaviour problem, because the extra chart only served the decision you already made.
Recency and the Gambler’s Fallacy
Recent events feel more informative than older ones. Four losses in a week therefore feel like a broken system, even when the sample says nothing yet.
The opposite error follows closely. A trader who expects a winner “because one is due” has borrowed the gambler’s fallacy, since independent trades carry no memory of each other.
Both errors push the same button. They tempt you to change size or skip entries at the least useful moment in the sequence.
Why Naming the Bias Helps
A named habit becomes something you can log. Vague self-criticism produces nothing you could ever measure.
So add a bias column to your journal. Over thirty trades the column tells you which specific pull deserves a rule of its own.
How to Tell Which Side Is Costing You
Guessing wastes months. A short audit of your own records answers the question in a single evening.
Read the Journal Before the Chart
Pull your last fifty trades. Mark each one either as a plan trade or as a deviation.
Deviations above roughly one in five point at execution. A clean record with poor results points at the method instead.
Count the Deviation Types
Sort deviations into four buckets: skipped signals, early exits, moved stops and oversized entries. One bucket normally dominates.
That dominant bucket is your actual project. Fixing it beats reading another indicator guide.
When the Analysis Really Is the Problem
Sometimes a plan genuinely lacks an edge. A record with almost no deviations and a steady decline says so plainly.
Then the work moves back to the chart. Test the rules across more history, check the costs you assumed, and confirm the market condition still exists.
Honest traders visit both diagnoses. The mistake lies in assuming an answer before you look.
Costs Change the Verdict
Spread, commission and swap sit between a good idea and a good result. A plan that looks fine on raw price can fail once those three arrive.
Short-term methods feel this hardest. Because costs repeat on every trade, a scalping plan pays them far more often than a swing plan does.
So run the audit with real costs included. Otherwise you may blame your behaviour for a bill your method was always going to face.
Building a Plan You Can Actually Follow
Most execution problems shrink when the plan gets more specific. Vague wording hands every trade back to your mood.
Write Conditions a Stranger Could Follow
Replace “wait for confirmation” with a testable line. A close beyond the level, a specific bar type, or a fixed number of pips all qualify.
Read the rule aloud to somebody who does not trade. If they ask a clarifying question, the rule still needs work.
Cap the Variables
Fewer decisions leave fewer places for a slip. One entry type, one stop method and one sizing formula cover most retail plans.
Complexity feels like sophistication. In practice it mainly multiplies the moments where discretion can enter.
Size So the Plan Stays Comfortable
Fear of a loss usually tracks the size of that loss. Halve the stake and the same chart suddenly looks calmer.
Traders often discover their discipline was never the issue. The position simply outgrew their tolerance, and behaviour followed the money.
Two Habits That Serve Both Sides
A short list of routines protects the analysis and the execution at once. Neither habit costs more than a few minutes.
The Pre-Trade Checklist
Write five questions and answer them before every order. Does the condition exist, where does the stop go, what size follows, what invalidates the idea, and have you already hit your daily limit?
A checklist works because it moves the decision earlier. You answer under calm conditions rather than while a candle is closing.
Keep it short enough to finish in a minute. A checklist nobody completes protects nothing at all.
The Post-Session Review
Spend five minutes at the end of each session on two columns. One column records what the plan said, and the other records what you did.
Gaps between the columns are your data. Because the record accumulates, a pattern shows up within a couple of weeks.
Add a one-line note about your state as well. Tired, rushed, bored and frustrated all predict deviations far better than any chart does.
Why Both Habits Beat Motivation
Motivation fades on the days you most need it. A written routine survives a bad mood because it asks nothing from you emotionally.
Think of them as scaffolding rather than as self-improvement. The structure holds while the skill catches up.
Common Mistakes in This Debate
Most damage comes from a handful of habits. The graphic below sets an analysis problem beside an execution problem so you can tell them apart.

Treating Discipline as a Personality Trait
Discipline behaves far more like a system than a virtue. Written rules, a size cap and a daily stop achieve more than willpower ever will. So build the constraint into your process instead of asking yourself to be tougher.
Rewriting the System After Every Loss
A single losing trade tells you almost nothing. Changing the rules each time destroys the sample you need. So set a review point in advance, then leave the rules alone until you reach it.
Blaming Emotion for a Vague Plan
Many so-called psychology problems are specification problems. A rule that says “wait for confirmation” invites a fresh judgement call every session. So write conditions somebody else could follow without asking you anything.
Studying More Instead of Trading Smaller
Another course rarely fixes a behaviour gap. Reducing size until the pressure drops usually does. So shrink the stake before you enlarge the library.
Judging a Plan on a Handful of Trades
Ten trades tell you about luck rather than edge. Traders who quit at trade twelve never learn what they held. So define the review window by trade count and stick to it.
Separating the Two in the First Place
A plan you cannot follow is a design fault, not a character flaw. Fit the method to the person who has to run it. So a trader who dislikes screens should avoid a method needing constant attention.
Quick Reference for Diagnosing Your Own Results
Work down this list before you change anything. It takes about an hour with a spreadsheet open.
- Export your last fifty closed trades.
- Tag each one as a plan trade or a deviation.
- Calculate the deviation share as a percentage.
- Sort deviations into skipped, early exit, moved stop and oversized.
- Recalculate the results with every deviation excluded.
- Compare the two figures side by side.
- Pick the single largest leak and write one rule for it.
- Set a review date at least thirty trades away.
Step six carries the whole diagnosis. A clean set that still loses sends you back to the chart, while a messy set that would have won sends you back to your process.
What Goes Wrong When One Side Gets Ignored
Both failure modes leave a signature shape on an equity curve. The panel below shows those two paths side by side.

All Analysis and No Process
This curve wanders. Good weeks appear and then vanish, because the trader keeps changing what they do.
The tell sits in the record rather than the result. Trade sizes jump around, and the rule set has three versions inside one quarter.
All Mindset and No Edge
This curve declines smoothly. Every trade follows the plan, and the plan simply does not pay after costs.
Discipline makes the decline tidier, not shallower. So a trader in this position needs research rather than another affirmation.
The Rebuild Loop
The worst outcome mixes both. A trader deviates, blames the system, rebuilds it, deviates again, and never accumulates a sample of anything.
Breaking that loop takes one decision. Freeze the rules, cut the size, then let thirty trades run before you touch a thing.
When to Step Away Entirely
Some patterns go beyond trading habits. Chasing losses across whole nights, hiding results from family, or trading with money you need elsewhere all point somewhere serious.
Treat that honestly and early. Stepping away from the market and speaking to a qualified professional matters far more than any rule in this guide.
Related Concepts to Study Next
Three neighbouring guides finish this picture. Each covers a piece the debate usually skips.
Start with our overview of what trading psychology is, then work through how to be a disciplined trader for the process side. Where hesitation is the leak, our guide to analysis paralysis in trading covers the fix, while our note on emotions in trading names the feelings involved. On the chart side, our guide to combining indicators keeps the analysis lean, and our explainer on risk per trade sets the size that makes both jobs easier.
FAQ
Is trading psychology more important than technical analysis?
Neither one outranks the other, because they do different jobs. Analysis produces a decision, and psychology decides whether that decision reaches the market unchanged. A trader with no edge cannot behave their way to a profit, and a trader with an edge can certainly behave their way out of one.
How do I know whether my problem is analysis or execution?
Audit fifty closed trades and tag each as a plan trade or a deviation. Then recalculate your results with the deviations removed. A much better figure points at execution, while a similar figure points at the method.
Can better analysis fix an execution problem?
Rarely on its own, though clearer rules help a great deal. Vague conditions force a judgement call on every trade, so tightening the wording removes many chances to improvise. Beyond that point, the fix lives in sizing, routine and record keeping.
How many trades before I judge a plan?
Pick the number in advance and treat it as a rule. Thirty trades gives a rough read, and a hundred gives a far steadier one. The exact figure matters less than refusing to change course halfway through.
Does reducing position size really change behaviour?
It changes the stakes attached to each decision, which usually changes the decision. Traders who hesitate at one percent often act normally at a quarter of that. Treat the smaller size as training rather than as a demotion.
Where should a beginner spend their time first?
Write a plan simple enough to follow, then trade it small while logging every deviation. That single habit teaches both sides at once, since it exposes weak rules and weak execution in the same file. Results are not guaranteed; past performance is not indicative of future results.
External references
- For background on this concept, see Market Psychology at Investopedia.
- For broader market context, see Technical Analysis at Corporate Finance Institute.

About the author
Written by Dominic Walsh, a Forex trader and MT4/MT5 indicator, Expert Advisor and script developer. Every tool on forexmt4systems.com is tested on live charts before release and ships with ready-to-use compiled MT4 (.ex4) and MT5 (.ex5) files. Learn more about the trader and developer behind this site.
How we build, test and correct every tool: Editorial & Testing Policy. Trading carries risk; see the disclaimer.