
A balanced price range is the zone where two opposing fair value gaps overlap. One gap forms on a move down, another forms on the move back up, and the area they share becomes a single strong reaction zone. After this guide you will spot both gaps on a chart. You will mark where they cross. Then you will trade the return into that overlap with a clear bias and a defined stop.
The idea builds on fair value gap theory taught by Michael Huddleston, the Inner Circle Trader (ICT). A lone gap shows a one-sided imbalance, which price often revisits. A balanced price range, or BPR, shows imbalance in both directions stacked on the same prices. So the overlap carries more weight than either gap alone, and price tends to respect it sharply on the retest. That extra weight is the entire reason traders hunt for these zones rather than settling for a single gap.
What a Balanced Price Range Looks Like on the Chart
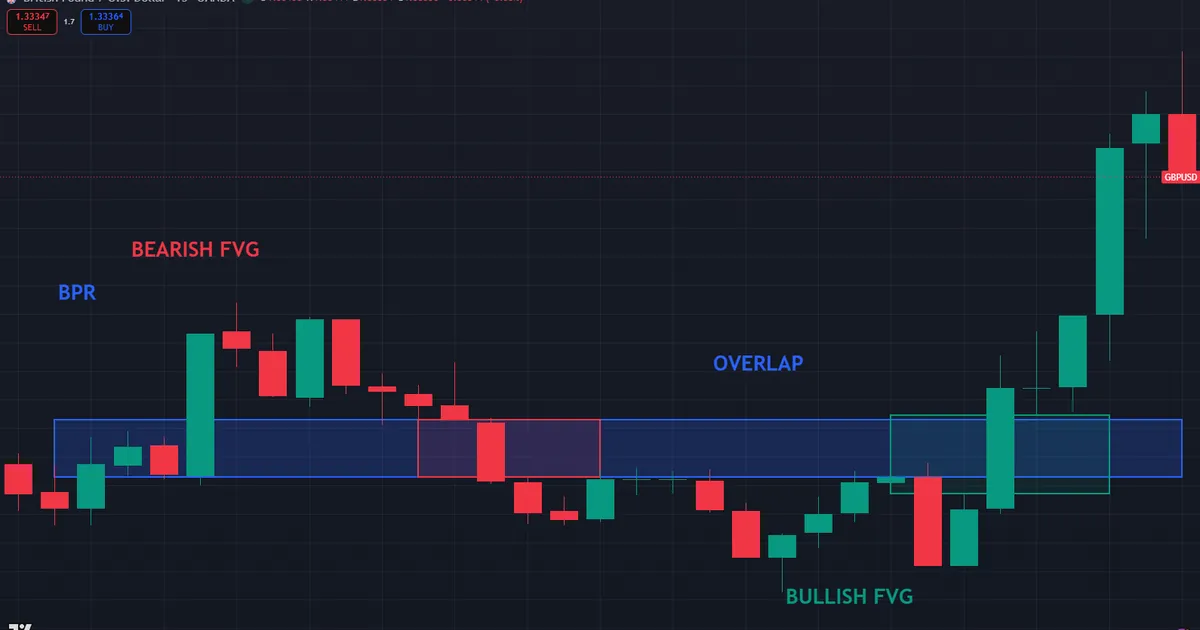
Picture a sharp drop that leaves a bearish gap behind it. Then picture a sharp rally back through the same area, leaving a bullish gap. The prices those two gaps share form the balanced price range. The chart below marks one such overlap on a major pair, with both gaps shaded and the shared zone highlighted.
Reading the Overlap Zone
Start with the two gaps. A bearish fair value gap sits where price fell so fast it skipped a band of prices. A bullish fair value gap sits where price rose just as fast through a nearby band. Where those two bands cross, you get the balanced price range. So the zone is not one gap but the slice both gaps have in common.
Notice why the overlap matters. Each gap alone is a magnet, since price likes to rebalance an imbalance. When two gaps point in opposite directions on the same prices, the market has left unfinished business twice. So a return to that shared zone meets orders from both moves, which is why the reaction there tends to be quick and clean.
Keep the picture simple in your head. Two moves tore through the same prices from opposite sides, and each left a scar. The balanced price range is where those two scars cross. Because both moves cared about that band, price rarely passes through it quietly on the first return, at least when the higher timeframe agrees.
Why Two Gaps Beat One
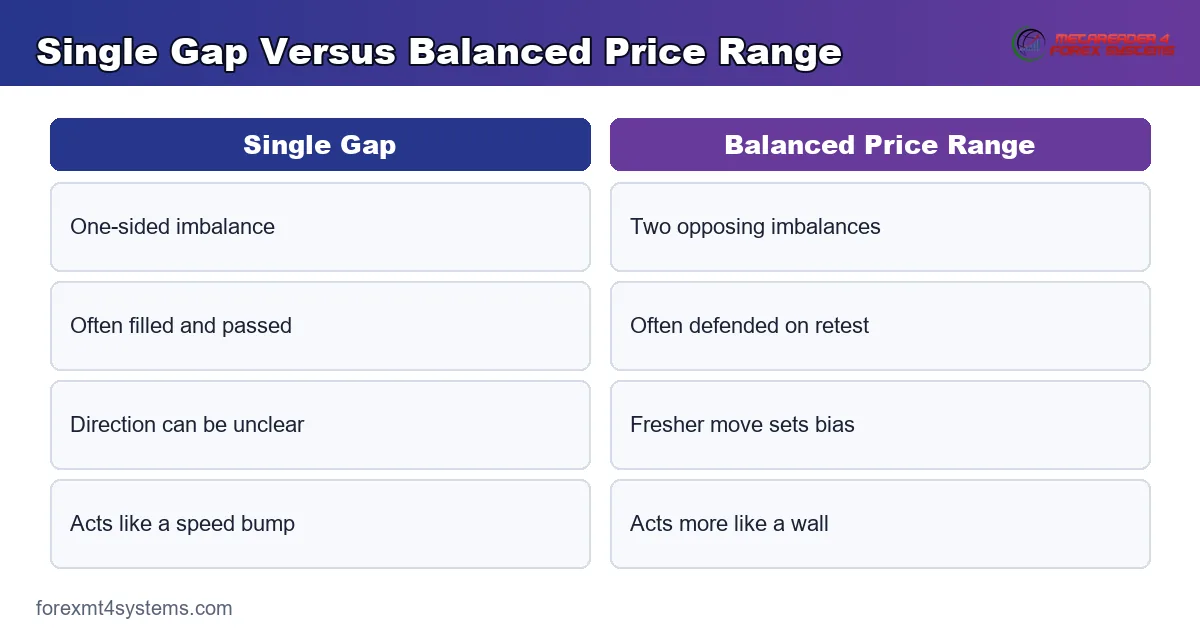
A single gap can fill and keep going. Price often trades straight through a lone fair value gap without much of a pause. A balanced price range resists more, because the overlap holds residual orders from both the drop and the rally. So the zone acts less like a speed bump and more like a wall, at least on the first retest.
That extra resistance changes how you plan the trade. With a lone gap, you often expect a shallow reaction and a quick continuation. With a balanced price range, you can lean on a firmer bounce and place the stop a touch tighter. So the overlap does more than mark a level. It shapes your expectations for how hard price should react when it returns.
Hold the idea to an honest standard, though. Not every pair of gaps forms a valid BPR, and forcing the label onto gaps that barely touch only invents a level price ignores. A real balanced price range needs a genuine overlap, where the two gaps clearly share prices. The next section shows how to confirm that overlap before you trust it.
How to Mark a Balanced Price Range Step by Step
The zone only helps when both gaps are real. So gap selection comes first, and most beginners rush it. A balanced price range forms from two clean, opposing fair value gaps, not from two vague pauses. Overlapping noise never qualifies.
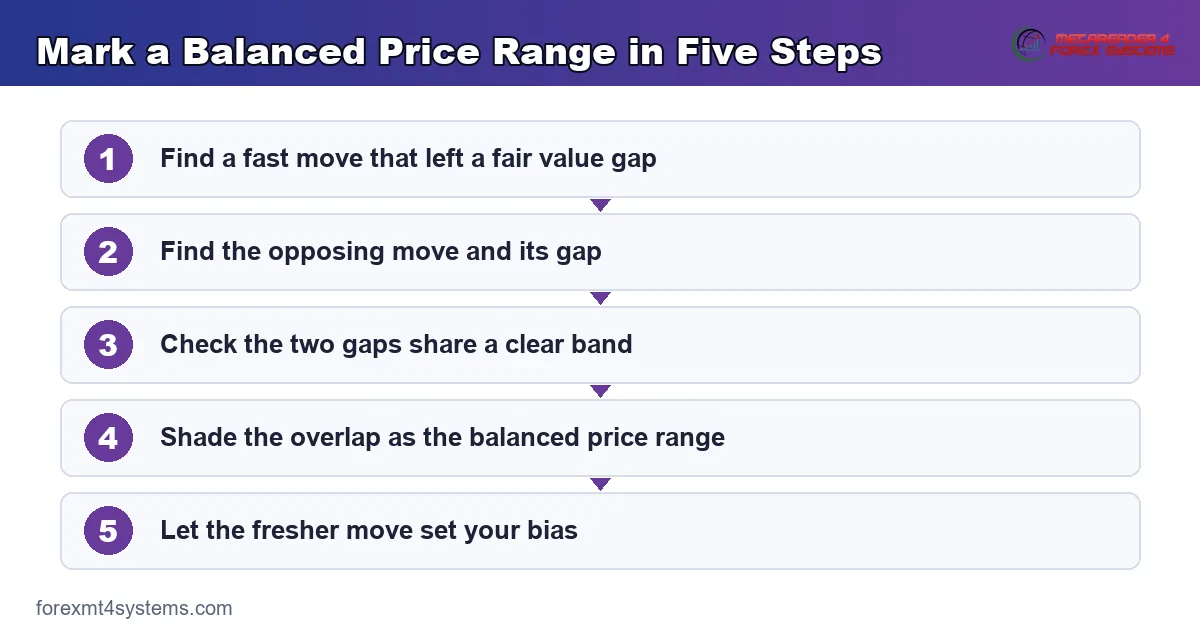
- First, find a sharp move in one direction that left a clear fair value gap.
- Next, find the sharp move back the other way that left an opposing gap.
- Then check that the two gaps share a band of prices, not just a single tick.
- Now shade the overlap, since that shared band is the balanced price range.
- Last, note the direction of the second move, because that sets your bias into the zone.
Read the steps as a filter, not a rush. Each line removes a weak candidate, so the overlap that survives all five usually holds real weight. The gap logic underneath matters here, and our guide to the difference between a fair value gap and an order block shows how these imbalances form in the first place.
Confirming a True Overlap
One test filters most fakes. The two gaps must share a clear band, wide enough to draw as a zone rather than a line. If they meet at a single price and no more, the overlap is too thin to trade. A band of several pips gives price something to react to, and it gives your stop room to sit beyond the zone. Anything thinner is better left alone, since it rarely holds when price returns with momentum.
Setting the Bias Into the Zone
Direction comes from the second move. When the rally is the more recent leg, treat the balanced price range as support and lean long on the return. When the drop is the more recent leg, treat it as resistance and lean short. So the freshest move sets the bias, while the overlap sets the exact price. Read them together and the trade takes shape, with direction and level answered in one glance.
How the Two Gaps Build the Zone
The power of a balanced price range comes from order flow left behind twice. A fast drop skips prices because sellers overwhelmed buyers, so unfilled buy orders remain in that gap. A fast rally then skips the same prices because buyers overwhelmed sellers, leaving unfilled sell orders. The overlap holds a little of both.
Read that mix as tension. When price returns to the shared band, it meets residual orders pulling in two directions at once. So the reaction can be sharp, since both sets of orders activate near the same prices. The fresher move usually wins, which is why bias follows the more recent leg into the zone. When the higher timeframe backs that same direction, the case for the trade grows firmer still, and the overlap becomes a location worth waiting for.
The Sweep That Often Precedes It
Many balanced price ranges form right after a liquidity raid. Price sweeps an old high or low, then reverses hard and leaves the opposing gap on the way back. So the overlap often sits just beyond a swept level, which stacks two edges in one place. That pairing of a sweep and a double imbalance is among the cleaner setups in the method.
First Test Versus Later Tests
The first return matters most. A fresh balanced price range holds the bulk of its residual orders, so the initial reaction tends to be the strongest. Each later test spends some of that order flow, which weakens the zone over time. So favour the first retest, and treat a third or fourth touch with growing caution.
Where the Balanced Price Range Fits the SMC Workflow
A balanced price range is a point of interest, not a whole system. It answers one question: where is a high-quality zone to trade from. First you read the higher timeframe for bias and a draw on liquidity. Then you scan for an overlap of opposing gaps inside the correct half of the range. Only then does the BPR become a place to plan an entry.
Sequence keeps the trade honest. A balanced price range often behaves like an inversion fair value gap, where a gap that once acted as support flips to resistance or the reverse. When the overlap sits at such a flip, its weight grows, and the reaction on the retest tends to be sharper. The broader library of ICT indicators for MT4 and MT5 can plot both gaps and shade the overlap for you.
Session Timing in New York Hours
Timing sharpens the plan. Mark the higher-timeframe gaps before the London kill zone opens near 2:00 AM New York time. Then watch for the return into the overlap during London or the New York morning window from 8:30 to 11:00 New York time. The Asian range from 8:00 PM to midnight often drifts, so treat any overlap that forms there with extra care.
Pairing the Zone With Higher-Timeframe Bias
A strong zone still needs a reason. Picture a four-hour bias pointing up toward an old high. Price pulls back into a balanced price range on the fifteen-minute chart, where a bearish gap and a bullish gap overlap. Because the bias already leaned long, that overlap becomes a clean trigger rather than a lone guess. Bias supplies the why, and the balanced price range supplies the where.
Worked Example: A Bullish Balanced Price Range
Rules feel abstract until you price a real setup. The chart below walks a fifteen-minute bullish sequence, and it goes long off a balanced price range inside discount. Follow the numbers as a story, since each step leans on the one before it. Notice how the overlap, not either full gap, defines the exact entry.
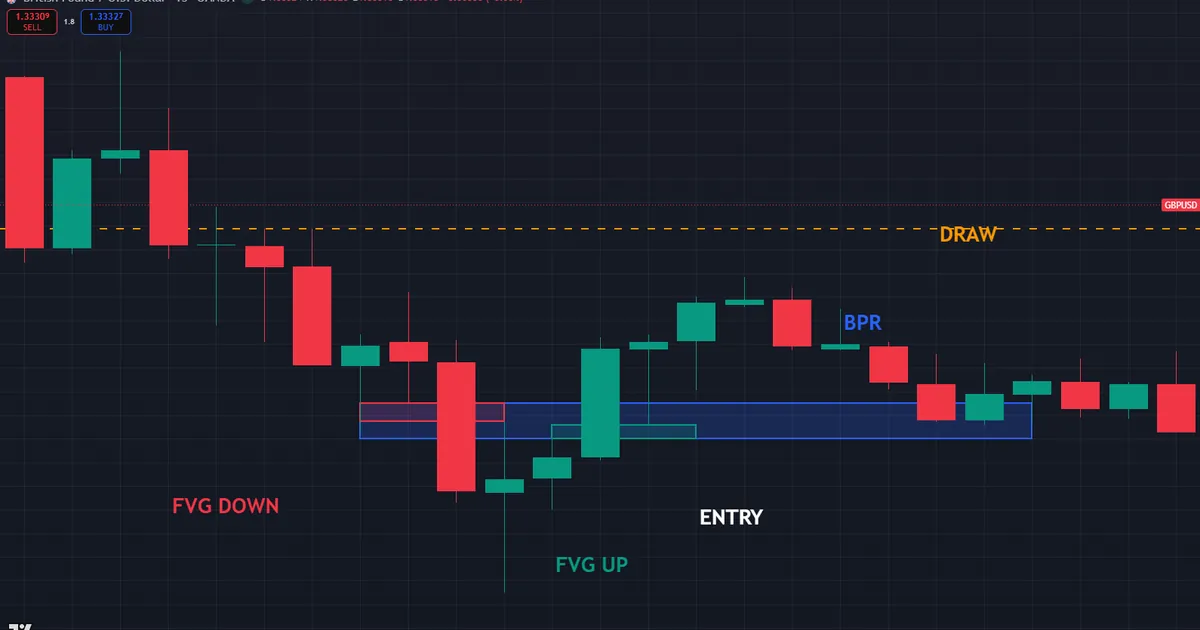
- First, the bias: the four-hour chart broke higher, so buy-side liquidity above an old high near 1.33298 stood as the draw.
- Next, the drop: a fast decline into discount left a bearish gap from 1.3312 to 1.3320.
- Then the rally: a sharp push back up left a bullish gap from 1.3308 to 1.3315.
- The overlap: the two gaps shared the band from 1.3312 to 1.3315, and that band became the balanced price range.
- The bias: the rally was the fresher move, so the zone read as support.
- Last, the trade: buy the retrace into the overlap, stop below the swept low near 1.3299, first target the old high at 1.33298.
Why the Overlap Pays
Price paid does the quiet work again. A long filled near 1.3313 risks only about fourteen pips to the stop below the swept low, while the draw at 1.33298 sits roughly seventeen pips above. So the reward still edges past the risk, and that ratio comes straight from the tight overlap zone. A trade taken across the full width of either gap would have needed a wider stop for the same target.
Notice the discipline the zone enforces. The same pair of gaps without a real overlap would offer no precise entry at all. So you would either chase the bounce or size too wide. The balanced price range gives you a small, defined band instead, which is exactly what a tight stop needs.
Consider what happens if you ignore the bias. The same overlap in a market trending hard against you would likely fail, since price is set on running through zones. So the balanced price range never overrides the higher timeframe. It only sharpens an entry the bias already approved, and that order of operations keeps you out of the worst trades.
Managing the Balanced Price Range Trade
Manage the position with the same map that framed it. Many traders bank a partial at the halfway point of the higher-timeframe range, then trail the rest toward the old high. Others exit fully at the first clear resistance on quiet days. For the exact midpoint and retracement levels, the free Fibonacci calculator turns two prices into every level in seconds. Choose one exit plan before entry and write it down.
Download the complete indicator database
Put these concepts on your charts. One email unlocks the full library of 1,380+ indicators with compiled MT4 and MT5 files, plus my TradingView scripts. No paywall, no spam, unsubscribe any time.
Get free access to my indicator database
One email unlocks 1,380+ free MT4, MT5 and TradingView indicators — the complete library. No single-tool download; you get the whole database.
Common Balanced Price Range Mistakes and Their Fixes
Selection errors sink more balanced price range trades than entry errors, and a few dominate beginner journals. Each mistake below carries a plain fix you can apply on the very next chart.
- Calling two gaps that barely touch a balanced price range. Fix: demand a clear shared band, not a single price.
- Using the same-direction gaps. Fix: the two gaps must oppose each other, one up and one down.
- Ignoring which move is fresher. Fix: the more recent leg sets your bias into the zone.
- Trading the overlap against the higher-timeframe bias. Fix: the bias chart must agree first.
- Drawing the zone across a full gap instead of the overlap. Fix: shade only the band both gaps share.
- Placing the stop inside the zone. Fix: the stop sits just beyond the overlap, never within it.
The second graphic pairs each mistake with its fix for a fast pre-session review.
A Balanced Price Range Pre-Trade Checklist
Run these six lines before any entry that leans on a balanced price range. A single failure sends the trade back to the watchlist.
- Higher-timeframe bias set, with a clear draw on liquidity marked.
- Two opposing fair value gaps sit on nearly the same prices.
- The gaps share a clear band wide enough to draw as a zone.
- The fresher move sets the bias, and it matches the higher timeframe.
- Price is returning into the overlap, not just near it.
- The stop sits just beyond the zone, and the draw offers at least double the risk.
Also score a month of trades against this list. The line you skip most often is your real leak, and fixing one leak beats learning three new setups. Keep the list short so you can run it in seconds while price sits at the zone.
One line deserves extra weight, since it hides in plain sight. Traders often shade the whole space between two gaps rather than the band they truly share. So the zone balloons, and the stop widens with it. Draw only the overlap, however small, because that shared band is the part with double order flow behind it.
Related SMC Concepts to Study Next
The balanced price range connects to several ideas worth learning together. It rests on gaps, so the full guide to fair value gap trading builds the foundation you need first. When a gap inside the overlap flips roles, it becomes an inversion gap, which changes how the zone behaves on later tests. A thin, unfilled gap can also mark a liquidity void, where price tends to travel quickly once it enters. Read all three and your read on imbalance sharpens fast.
When a Balanced Price Range Fails
Strong trends break the zone regularly. In a runaway move against your bias, price can slice through a balanced price range without pausing at all. So the sharp reaction you expected never prints, and the trade stops out fast. That is a real cost the framework accepts in exchange for high-quality zones.
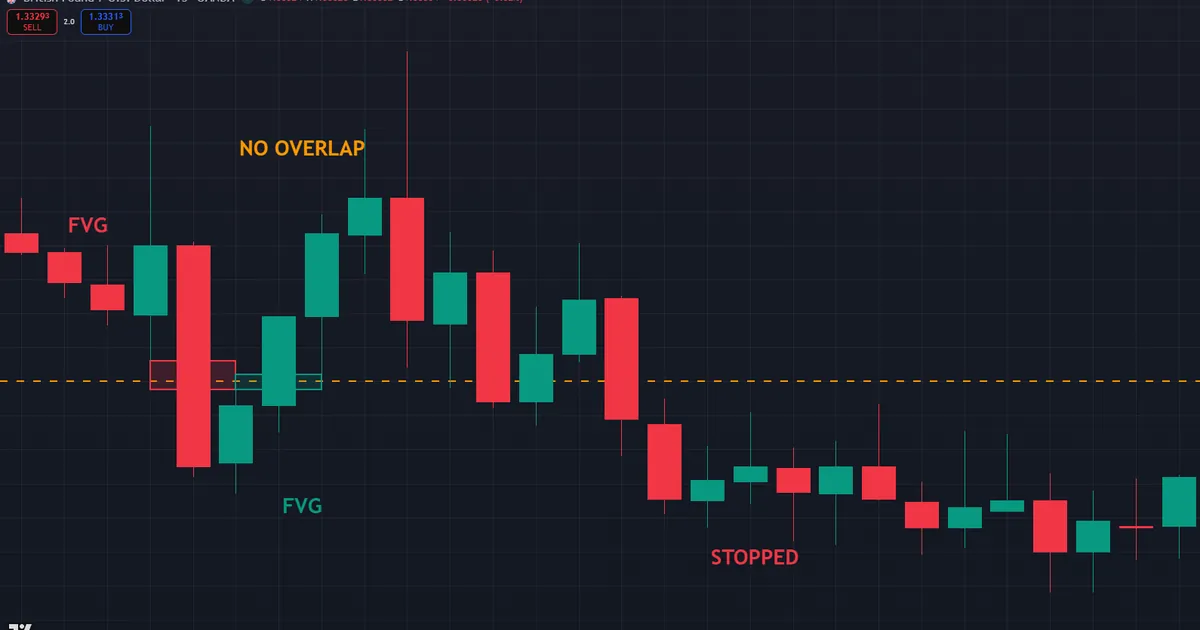
Gap selection is the other failure point. Mark two gaps that never truly overlap and the zone points at empty air. The chart below shows exactly that trap, with a balanced price range drawn where two gaps only grazed each other.
A Failure Walkthrough
One failure repeats more than the rest. A trader spots a bearish gap and a bullish gap nearby, shades the space between them, and calls it a balanced price range. Yet the two gaps shared no real band, since they met at a single price and parted. So the zone had no double imbalance behind it, and price drifted straight through the stop. The lesson stays simple: without a genuine overlap, two gaps are just two gaps. Demand the shared band before you draw a single line.
News breaks even valid zones. A surprise release can drive price through a clean balanced price range without pausing, so the reaction you waited for never arrives. That is a real cost the method accepts in exchange for tight risk. So check the calendar before you lean on an overlap, and stand aside when a high-impact print looms. A balanced price range improves your odds, yet no single zone controls where price finally stops.
FAQ
What is a balanced price range?
A balanced price range is the band where two opposing fair value gaps overlap. One gap forms on a move down, the other on the move back up, and the shared prices become a strong reaction zone. Traders use that overlap for precise entries with a defined stop.
How is a BPR different from a single fair value gap?
A single fair value gap marks one-sided imbalance, which price often trades straight through. A balanced price range stacks two opposing gaps on the same prices, so it holds residual orders from both moves. That double imbalance is why the overlap tends to react more sharply on the retest, especially the first time price returns to it.
Which direction do I trade a balanced price range?
Let the fresher move set the bias. When the rally is the more recent leg, treat the overlap as support and lean long. When the drop is more recent, treat it as resistance and lean short. The higher-timeframe bias should agree before you commit.
How wide should the overlap be?
Wide enough to draw as a zone rather than a line. If the two gaps meet at a single price, the overlap is too thin to trade well. A band of several pips gives price room to react and gives your stop room to sit safely beyond the zone.
Does the higher-timeframe bias still matter?
The bias comes first every time. A balanced price range is only a point of interest, so it needs a direction and a draw to point toward. Trading one against the higher-timeframe bias is among the most common ways the setup fails.
Does a balanced price range work on any market?
The logic applies to any liquid market where fast moves leave gaps, so traders use it on indices, metals, and crypto. Still, volatility differs across markets, so test the zone on your instrument first. A fast index may need a wider stop beyond the overlap than a calmer pair would, so let your own journal supply the numbers that fit each market. Results are not guaranteed; past performance is not indicative of future results.
External references
- For background on this concept, see Fair Value on Wikipedia.
- For broader market context, see Mean Reversion at Corporate Finance Institute.

About the author
Written by Dominic Walsh, a Forex trader and MT4/MT5 indicator, Expert Advisor and script developer. Every tool on forexmt4systems.com is tested on live charts before release and ships with ready-to-use compiled MT4 (.ex4) and MT5 (.ex5) files. Learn more about the trader and developer behind this site.
How we build, test and correct every tool: Editorial & Testing Policy. Trading carries risk; see the disclaimer.