
What is ICT trading? Plainly, it is the price-action method taught by Michael Huddleston, the Inner Circle Trader (ICT), and it reads markets through liquidity and institutional order flow rather than lagging indicators. After this guide you will know the core vocabulary, understand how the concepts chain into one trade model, and hold a clear order in which to study them.
Also, treat this page as the hub of our Smart Money Concepts series. Each section links to a deeper article on that single concept, and a full learning path near the end sequences the whole series. Bookmark the sibling guides as you go; every one of them drills a single idea to entry-level depth.
What Is ICT Trading? A Plain Definition
ICT trading assumes that large institutions push price toward pools of resting orders before the real move begins. Indeed, retail stop losses cluster at obvious places: above old highs, below old lows, and beyond trendlines. Big players, in this view, drive price into those clusters to fill large positions, then send it the other way. So the ICT trader waits for the raid, confirms the reversal, and enters at the zone where the move started.
The chart below shows the method’s raw material on a live example: EURUSD H1 during the New York morning of July 13, 2026.
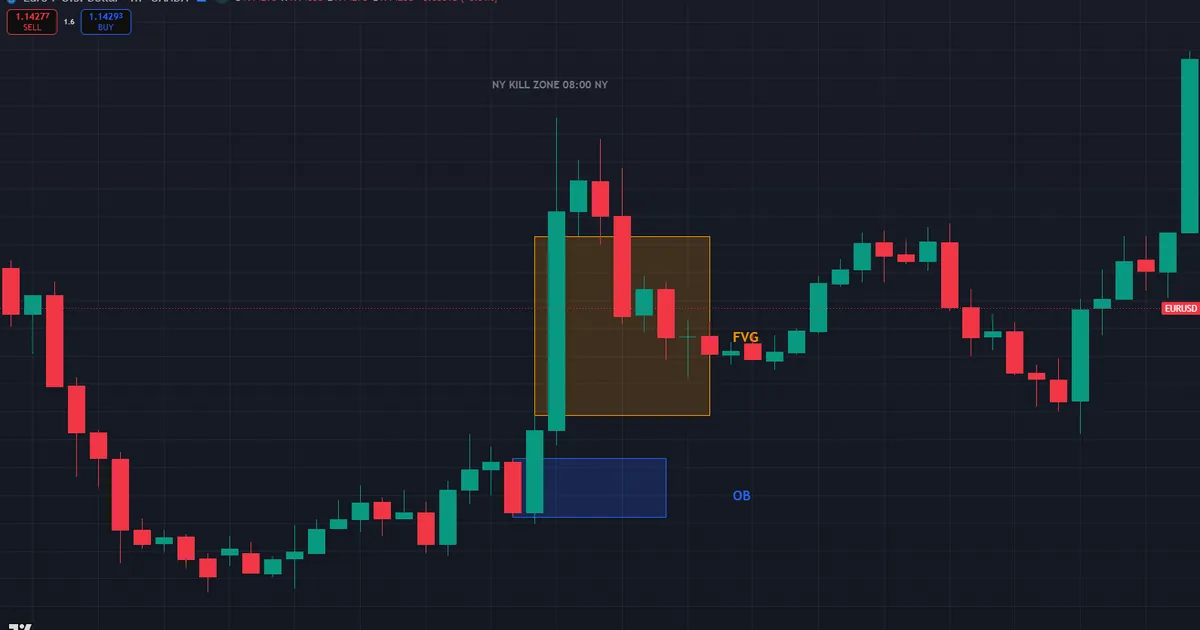
Reading the July 2026 EURUSD chart
Focus on the displacement leg that fires just after 8:00 AM New York time. EURUSD had drifted through the London morning without conviction. Then one full-bodied hourly candle drove price higher and broke short-term structure. That single leg left two tradeable footprints. First, a bullish order block between 1.13910 and 1.14016 — the last down-closing zone before the surge. Second, a fair value gap between 1.14094 and 1.14415, a pocket price crossed so fast that the candles never overlapped.
Also, mark the clock. The leg launched inside the New York kill zone, the 7:00 to 10:00 AM window where institutional volume peaks. An ICT trader reads that chart as intent: someone with size wanted higher prices, and the zones the move left behind become the map for the retrace entry.
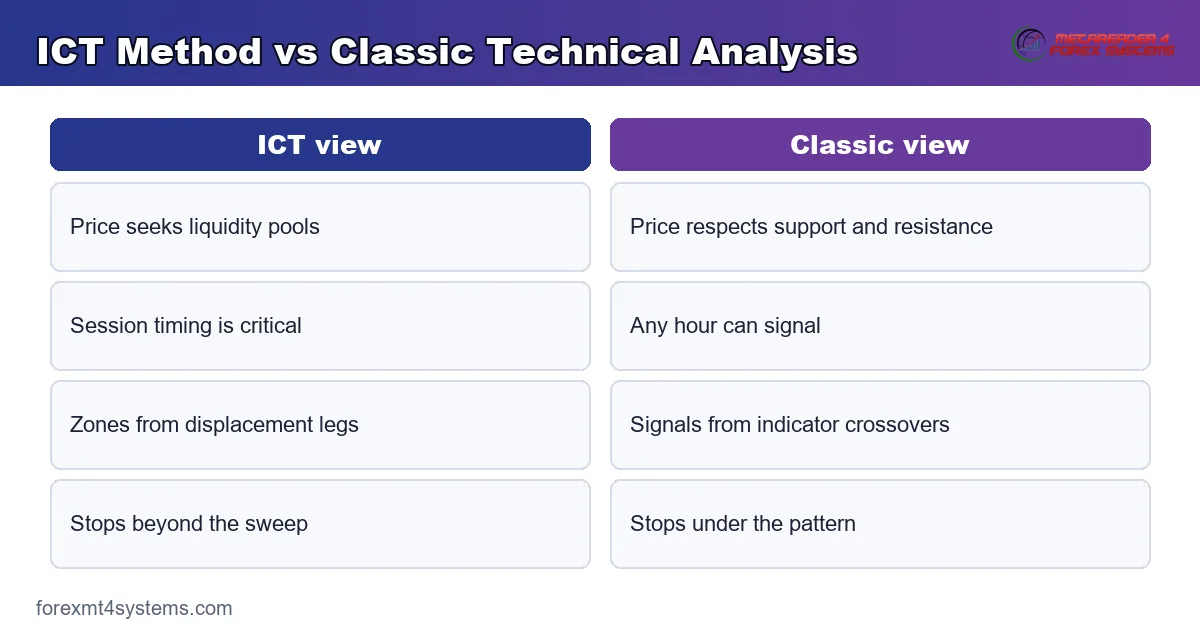
Three ideas separate the method from classic technical analysis. First, price seeks liquidity; it does not simply bounce between support and resistance. Second, time matters as much as price, because institutional volume concentrates in narrow session windows. Third, entries come from mapped zones such as order blocks and fair value gaps, not from indicator crossovers.
The method grew up on forex, and most lessons use currency pairs. Still, traders now apply the same logic to index futures, gold, and crypto, because stop clusters exist wherever a chart has obvious highs and lows.
Whose orders power the pattern
The mechanics rest on how the order book works. A resting stop loss is a market order in waiting: a sell stop below an old low becomes a market sell the instant price touches it. Hence clusters of stops form pools of ready liquidity. An institution that needs to buy in size wants exactly that — a burst of selling it can absorb without chasing price higher.
Retail traders supply the fuel without meaning to. Breakout buyers chase the push above an old high, and their stops seed the next pool once the move reverses. Thus the cycle repeats, which explains why the same footprints — sweep, displacement, retrace — keep appearing at the same kinds of levels.
Keep the claim in proportion, though. No public dataset proves that every sweep comes from deliberate institutional hunting; ordinary order-flow mechanics can produce the same shapes. Qualitatively, the pattern appears often enough to build a process around — and that is the honest ceiling of what anyone can say.
Who Is Michael Huddleston, the Inner Circle Trader?
Michael Huddleston is an American trader who says he began charting in the early 1990s and cites commodity trader Larry Williams as an early influence. He taught on forex forums for years and ran a paid mentorship around 2016 and 2017. Then he released hundreds of free lessons on YouTube from 2022 onward, and those playlists pushed the vocabulary into the mainstream. His teaching style is dense, and single lessons often run for hours, which is why structured summaries like this one exist.
Meanwhile, a parallel scene repackaged his ideas under the label Smart Money Concepts (SMC). The terms differ slightly, yet the core logic stays the same: liquidity, imbalance, and structure. Critics note that Huddleston has never published an independently audited track record. So weigh every performance claim, from any source, with care.
His catalog is enormous, and that size becomes its own obstacle. Core lessons hide inside hundreds of hours of video, and terms sometimes shift meaning between years. Hence most students lean on structured summaries and curated playlists first, then return to the source material once the skeleton makes sense.
The Core ICT Vocabulary
Six terms carry most of the method. Learn them in this order, and the rest of the material becomes far easier to follow.
Liquidity
Liquidity means clusters of resting orders. Buy stops sit above old highs, while sell stops sit below old lows. Hence ICT speaks of buy-side and sell-side liquidity, and price routinely sweeps one side before reversing. Our article on buy-side and sell-side liquidity maps the main pool types.
Market structure
Structure tracks the swing highs and swing lows that define a trend. A break of structure (BOS) continues the trend, while a change of character (CHoCH) hints at a turn. Then a market structure shift (MSS) — displacement through a key swing — flips the working bias.
Order blocks and PD arrays
An order block is the last opposite-direction candle before a strong move, and price often reacts when it returns there. Also, ICT groups order blocks with breakers, mitigation blocks, and similar zones into a ranked family called PD arrays. Together they form the entry layer of the whole model.
Fair value gaps
A fair value gap (FVG) is a three-candle imbalance where the first candle’s high and the third candle’s low never overlap. Later, price frequently trades back into that pocket before continuing. Thus fresh gaps serve as entry zones inside a confirmed move.
Premium and discount
Every dealing range splits at its 50 percent midpoint, called equilibrium. Above that line price is expensive, or at a premium; below it price is cheap, or at a discount. So ICT traders buy in discount and sell in premium, never the reverse.
Kill zones
Kill zones are the session windows where institutional volume peaks. The London kill zone runs from 2:00 to 5:00 AM New York time, and the New York kill zone runs from 7:00 to 10:00 AM. A smaller third window covers the London close, from 10:00 AM to noon. Also, our free forex market hours tool shows every window in your local time.
The first reference graphic below compresses all six terms into a single card you can keep beside the charts.
Where ICT Sits in the Smart Money Workflow
SMC traders run the method as a strict top-down routine, and the order never changes. Context comes first, the zone second, the trigger last. Skipping a layer is how most losing ICT trades begin.
The four-layer routine
- First, context: read daily and 4-hour structure, then name the draw on liquidity — the pool price most likely seeks next.
- Second, the point of interest (POI): mark the order blocks and gaps that sit in the path toward that draw.
- Third, confirmation: drop to the 5- or 15-minute chart at the POI and wait for a sweep plus displacement.
- Fourth, entry: execute at the fresh zone the displacement leaves, with the stop beyond the sweep.
Notice the division of labor. Higher timeframes decide direction and location, while lower timeframes only time the trigger. Hence the classic pairing: an H4 or H1 zone with an M5 or M15 entry. Mixing the roles — say, picking direction from a 5-minute chart — collapses the whole structure.
Session timing in New York time
Time filters the routine further. London’s 2:00 to 5:00 AM window sets the day’s first real range, and the New York 7:00 to 10:00 AM window brings the second wave of volume. Also, many practitioners anchor their charts to the midnight New York open and judge every morning move against that reference. Setups hunted outside the windows fight thin participation and slower follow-through, which is why patience between sessions is a core skill.
Each session plays a role in the day’s story, too. The Asian hours often build the tight range whose edges hold the first stops. Then London frequently runs one side of that range — a false push many traders call the Judas swing — before the real direction asserts itself. New York either continues London’s move or reverses it at a higher-timeframe zone. Knowing that rhythm turns the clock into context.
ICT Trading vs Indicator-Based Trading
The philosophical split matters more than any single concept. An oscillator or moving average derives from past price, so it describes what already happened. ICT zones work the other way: the trader maps where liquidity and imbalance sit, then waits for price to arrive. Hence the method plans forward while indicators report backward.
Honesty cuts both ways, though. Indicator rules are mechanical, so a coder can backtest them and measure the results objectively. Most ICT concepts stay discretionary, which makes rigorous testing hard and lets hindsight flatter the method. Many traders therefore blend the two: ICT for context and location, plus one or two simple tools for consistency of execution. Neither camp owns the truth, and the blend you can execute calmly beats the purest theory you cannot.
How the Concepts Chain Into One Trade Model
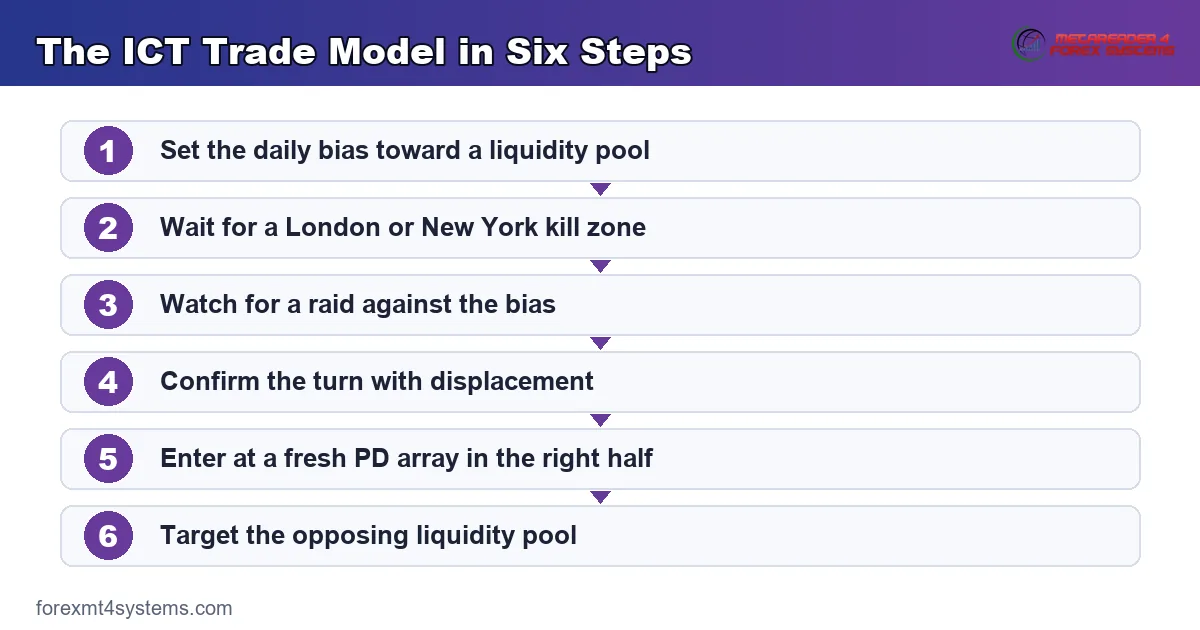
The vocabulary only pays off when the pieces snap together in sequence. Indeed, most ICT setups follow the same six-step chain.
- First, establish a higher-timeframe (HTF) bias on the daily chart by asking which liquidity pool price is drawing toward. Our walkthrough on finding your ICT daily bias covers this step in depth.
- Next, wait for a kill zone, since setups outside those windows carry less institutional participation.
- Then watch for a liquidity raid against the bias — for example, a sweep below an old low while your bias is bullish.
- Now confirm the turn with displacement: a fast, full-bodied move that shifts market structure.
- Enter at a PD array left behind by the displacement, ideally in the correct half of the range. Many traders use the optimal trade entry (OTE) pocket, the 62 to 79 percent retracement.
- Last, target the opposing liquidity pool and place the stop beyond the sweep.
Picture the July 13 chart once more. Suppose the daily bias pointed at buy-side liquidity above an old high near 1.14800. During the New York kill zone, EURUSD displaced upward through structure and left the gap at 1.14094 to 1.14415. So the model reads: buy the retrace into that gap, hide the stop below the order block at 1.13910, and hold for the old high overhead.
Truly, that chain is the whole method in miniature. Everything else in the ICT library refines one of those six steps.
Worked Example: A Bearish New York Setup
One bullish walkthrough never covers the whole skill, because half the job is recognizing the mirror image. So here is the same six-step chain run as a short. The chart below tracks each numbered step on a GBPUSD 15-minute chart during a New York session.
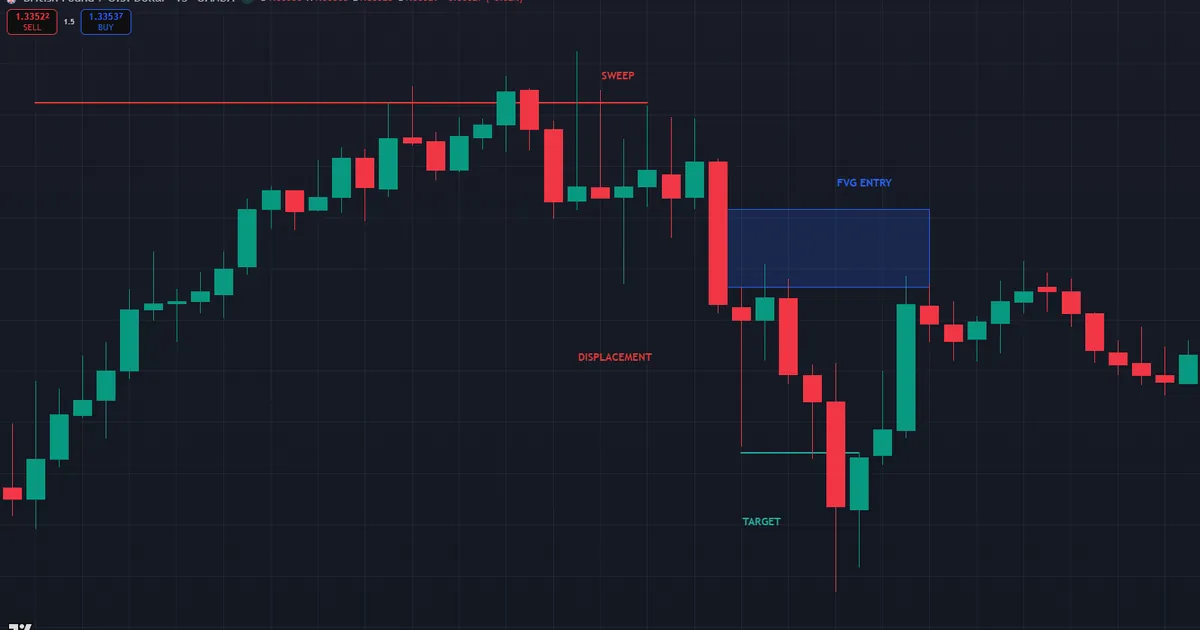
- First, the daily chart showed lower highs and a fresh displacement down, so the bias pointed at sell-side liquidity under equal lows at 1.34210.
- Next, price rallied through the New York morning and swept the London high at 1.35120 by four pips.
- Then a heavy 15-minute candle displaced down through the swing at 1.34850 — the raid had failed.
- The drop left a bearish fair value gap between 1.34890 and 1.34960.
- Now the entry: sell the retrace into the gap near 1.34920, with the stop at 1.35160, above the swept high.
- Last, the target: the equal lows at 1.34210, the pool the bias named from the start.
Run the risk math before the click. The stop sits roughly 24 pips above the entry, while the first pool waits about 71 pips below it, so the potential reward spans nearly three times the risk if the read holds. Also, note what actually confirmed the short: not the sweep alone, but the displacement that followed. Raids without displacement fail constantly, and skipping that filter is the fastest way to donate a stop to the market.
Management follows the map as well. Many traders bank a partial at the first intermediate low, then move the stop to entry once price displaces again in their favor. Others hold the full position for the equal lows and accept the occasional round trip. Either plan works if you write it down before entry; improvising mid-trade is the version that fails.
Download the complete indicator database
Put these concepts on your charts. One email unlocks the full library of 1,380+ indicators with compiled MT4 and MT5 files, plus my TradingView scripts. No paywall, no spam, unsubscribe any time.
Get free access to my indicator database
One email unlocks 1,380+ free MT4, MT5 and TradingView indicators — the complete library. No single-tool download; you get the whole database.
What to Learn First: A Study Path for Beginners
Beginners often drown in vocabulary. Instead, follow a narrow path and add concepts only when the earlier ones sit firmly.
- First, study liquidity until you can mark old highs, old lows, and equal highs on any chart without hesitating.
- Next, learn market structure so you can tell continuation breaks from genuine shifts.
- Then add fair value gaps and order blocks as your entry zones.
- Now layer in premium and discount to filter which zones actually matter.
- Last, add time: kill zones and the daily bias routine.
Practice each stage on a demo account and log every level you mark. Also, expect the first weeks to feel slow; pattern recognition builds only through repetition. Purpose-built ICT indicators for MT4 and MT5 can mark structure, gaps, and zones automatically while you learn. Meanwhile, our full guide to ICT indicators compares the main options in plain language.
The full learning path in this series
This hub anchors a twenty-article series, and the sibling guides slot straight into the five stages above. Read them in this order, because each one leans on the vocabulary of the last.
- Liquidity first: the buy-side and sell-side guide linked earlier, then liquidity pools in forex for a catalog of the pool types worth marking.
- Structure second: the market structure shift article, which also untangles BOS from CHoCH.
- Conviction third: displacement in trading — the filter that validates every raid before you trust it.
- Zones fourth: the PD array matrix, then the individual block and gap guides it links onward to.
- Value fifth: premium and discount, plus the optimal trade entry pocket inside it.
- Time last: the daily bias routine and the kill zone windows that give setups their schedule.
Also, resist skipping ahead to entry models. Traders who learn zones before structure mark boxes everywhere and trust none of them.
Set a pace you can sustain. One concept per week, drilled on fifty historical charts, beats a weekend binge through the whole list. Then loop back: rereading the liquidity material after studying displacement reveals connections the first pass hides. The series stays here; the market will still exist next month.
Common ICT Mistakes and How to Fix Them
Certain errors repeat in almost every beginner journal. Here are the six most common, each paired with its correction.
- Marking every down candle as an order block. Fix: only zones that launch displacement and break structure earn a box.
- Trading every fair value gap on the chart. Fix: demand bias alignment and a prior liquidity event first.
- Entering on the sweep alone. Fix: wait for displacement; a raid without follow-through is just a breakout.
- Hunting setups around the clock. Fix: restrict entries to the London and New York kill zones while learning.
- Flipping bias after one adverse candle. Fix: one bias per session, re-planned only after the daily close.
- Trading without a journal. Fix: log every marked level, every entry, and every skipped setup — the skips teach the most.
The second reference graphic pairs each mistake with its fix, in a format built for a quick pre-session review.
A Pre-Trade Checklist for the ICT Model
Before any live entry, run this list from top to bottom. Truly, if a single line fails, the trade waits.
- Daily and 4-hour structure agree on one direction.
- A clear draw on liquidity sits in that direction.
- Price trades inside a kill zone window.
- An opposing liquidity pool just got swept.
- Displacement broke a meaningful short-term level.
- A fresh gap or block offers a sensible retrace entry.
- The stop beyond the sweep risks 1 percent of the account or less.
- The journal entry exists before the order does.
Score every trade against all eight lines for a month. The line you break most often marks your real leak, and no new concept will patch it faster than that single fix.
Limitations and Honest Criticism
The method has real weaknesses, and knowing them early protects your account. Most concepts are discretionary, so two trained traders can mark different order blocks on the same chart. Also, hindsight bias is a constant trap, because every reversal looks like a clean sweep after the fact.
Some ICT claims resist testing, too. The idea that a central “algorithm” deliberately engineers prices is not falsifiable, and academic research offers it no support. Indeed, many concepts overlap older ideas — an order block behaves much like a supply or demand zone. Still, the framework can structure a disciplined process when you pair it with strict risk control and honest journaling. Without those two habits, no vocabulary will help.
Session dependence is a final limit. Concepts lean on London and New York volume, so they translate poorly to thin holiday markets and exotic pairs. Hence any backtest should cover both trending and ranging months before real risk goes on.
A failure walkthrough: when the sweep is the whole move
Picture the failure mode every new ICT trader meets first. EURUSD sweeps sell-side liquidity below an old low, exactly as the playbook hopes. Then the bounce stalls: the up candle prints a small body, structure never breaks, and price churns sideways at the lows. A trader who bought the sweep without waiting now holds a long with no displacement behind it. The chart below shows how that day resolves.
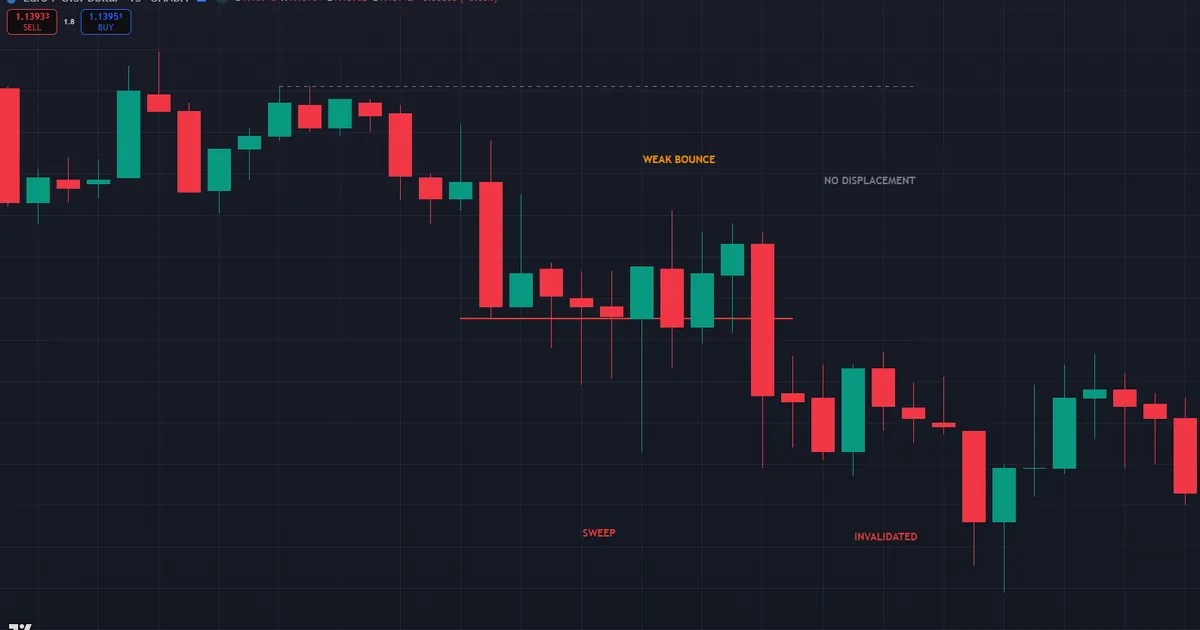
Next comes the resolution. Price rolls over, trades through the sweep low a second time, and closes beneath it — the invalidation. That close is the rule that caps the damage: a genuine raid should not see acceptance below the raided low. Exit on the close, take the small loss, and log the miss honestly.
The log entry needs four fields: the pair and session, the filter that went missing, the exit price, and the lesson in one sentence. Here the missing filter was displacement — the pattern never finished forming, and the entry fired early. Indeed, most blown ICT trades die at this exact step, which is why the checklist above gives confirmation its own line.
FAQ
Is ICT trading the same as Smart Money Concepts?
Mostly, yes. Smart Money Concepts is a community repackaging of Michael Huddleston’s teachings with slightly different labels. Indeed, the mechanics — liquidity, structure, imbalance — match closely, so material from either school transfers well.
Do I need special indicators to trade the ICT method?
No. The method works on a bare candlestick chart. Still, tools that auto-mark order blocks, fair value gaps, and session windows save screen time and reduce mapping errors while you learn.
What timeframes suit ICT trading best?
Most traders set bias on the daily and 4-hour charts, then execute on 5-minute to 15-minute charts inside a kill zone. Also, the concepts are fractal, so the same patterns appear on every timeframe.
How long does it take to learn ICT trading?
Expect months, not weeks. The vocabulary takes a few weeks, yet consistent execution demands hundreds of logged chart sessions. Meanwhile, journaling and market-replay practice shorten the curve considerably.
Is ICT trading good for beginners?
It can be, with one warning: the learning curve runs long and the vocabulary runs deep. Start with liquidity and structure only, practice on a demo account for months, and add one concept at a time. Meanwhile, expect the study path above to take a full season, not a weekend.
Can the ICT method lose money?
Yes. Every setup fails some of the time, and losing streaks happen even with a correct process. So trade small, manage risk on every position, and judge yourself on execution rather than outcomes. Results are not guaranteed; past performance is not indicative of future results.
External references
- For background on this concept, see Technical Analysis at Corporate Finance Institute.
- For broader market context, see Price Action at Investopedia.

About the author
Written by Dominic Walsh, a Forex trader and MT4/MT5 indicator, Expert Advisor and script developer. Every tool on forexmt4systems.com is tested on live charts before release and ships with ready-to-use compiled MT4 (.ex4) and MT5 (.ex5) files. Learn more about the trader and developer behind this site.
How we build, test and correct every tool: Editorial & Testing Policy. Trading carries risk; see the disclaimer.