
The central bank dealers range is a six-hour price band that ICT traders use to project the next session’s targets. It forms between 14:00 and 20:00 New York time, and its height feeds a set of standard-deviation levels above and below it. So it turns a quiet afternoon into a map for the busy hours ahead.
This guide shows you how to draw the central bank dealers range, how to project the deviations, and how to trade toward them without chasing. By the end, you will be able to build the levels before London opens and know which days give the cleanest readings. You will also learn when to trust the projections and when to set them aside entirely.
What Is the Central Bank Dealers Range?
The central bank dealers range, or CBDR, is the high-to-low band price prints between 14:00 and 20:00 New York time. Michael Huddleston, the Inner Circle Trader (ICT), named it for the late-day window when major dealing desks quiet down and price often coils. So the range captures a period of low activity that tends to precede the next expansion.
The logic runs like this. During those six hours, order flow thins out and price consolidates into a tight box. Then the algorithm uses that box as a reference and delivers the following session in measured steps away from it. Each step is a standard deviation, and each deviation equals the height of the range itself. The chart below shows a clean CBDR on EURUSD with its deviation levels projected upward and downward.
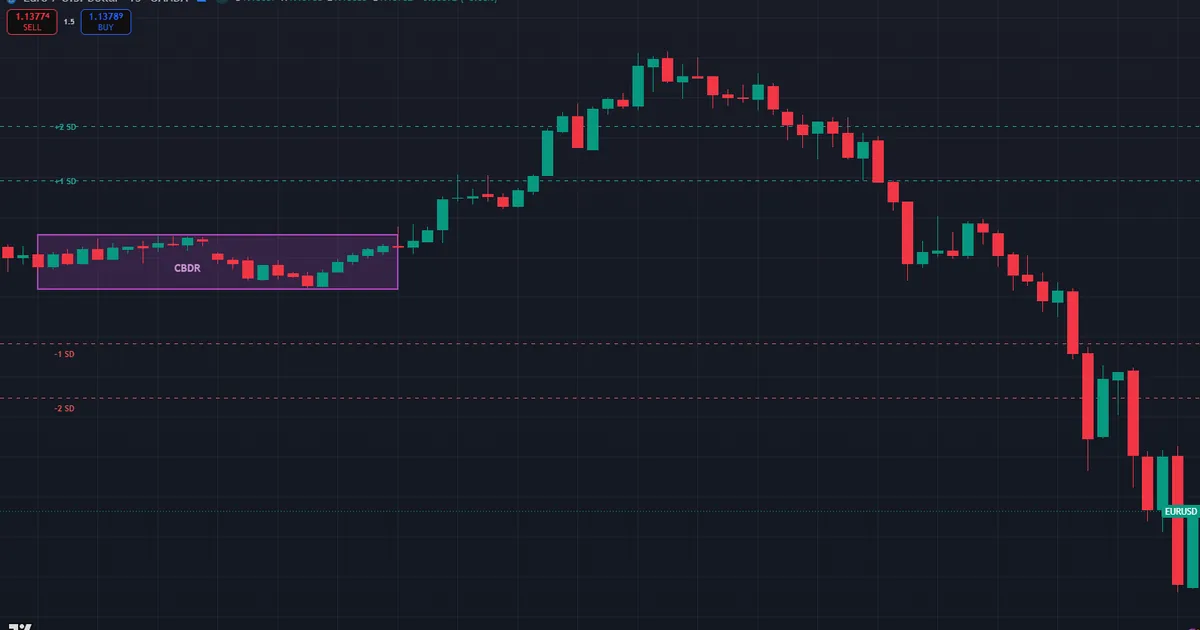
Look at the frame closely. EURUSD coiled between 1.14060 and 1.14128 during the 14:00 to 20:00 window, a compact box. From that box, the chart projects each deviation by the same height: the first level above sits at 1.14196, the second at 1.14264, and the mirror levels fall at 1.13992 and 1.13924. Price then pushed up to the second deviation near 1.1435 during the following New York morning, before reversing back down through the lower deviations.
Why Dealers Go Quiet After 14:00
The window is not arbitrary. By early New York afternoon, the London desks have closed and the main New York session is winding down. So participation drops, spreads widen slightly, and price loses the fuel for a large directional push. That lull is exactly what makes the range useful. A tight, low-volume box gives the cleanest reference for the deviations, while a wide, news-driven afternoon muddies the whole projection.
How to Draw the Range and Project the Deviations
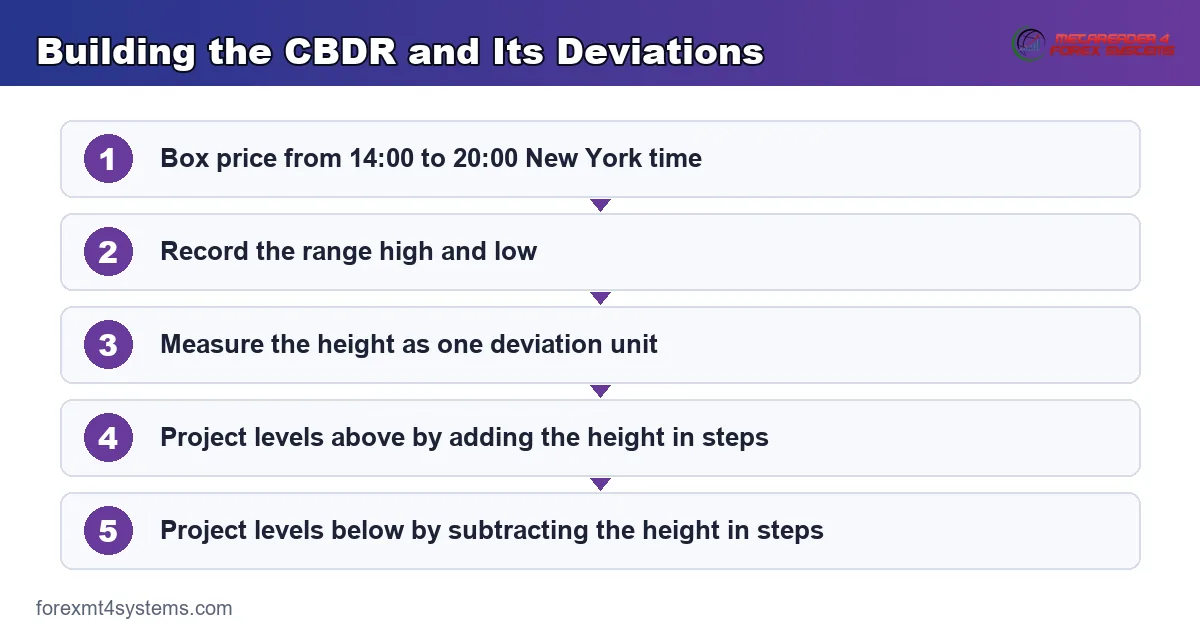
Building the levels takes only a few steps, and you can do it before the London open. Follow the sequence below each day you plan to use the model.
- Mark the window. Box off price action from 14:00 to 20:00 New York time on a fifteen-minute or five-minute chart.
- Find the extremes. Record the highest high and the lowest low inside that window; the body-only version ignores wicks if you prefer a stricter read.
- Measure the height. Subtract the low from the high. That distance becomes one standard deviation unit.
- Project upward. Add the height to the range high for the first deviation, add it twice for the second, and so on.
- Project downward. Subtract the height from the range low in the same steps to build the mirror levels.
Now you hold a ladder of targets. Truly, the levels act as magnets and reaction zones during London and New York. The branded graphic below turns this five-step routine into a single reference card you can keep beside your charts.
The Ideal Range Height
Height decides quality. ICT teaches that a CBDR between roughly 20 and 40 pips gives the most reliable projections. So a box of that size sits right in the sweet spot. When the range stretches beyond 40 pips, each deviation becomes so large that the targets lose precision. Instead of forcing a trade off a bloated range, note the distortion and lean on other tools that day.
Where the CBDR Sits in the SMC Workflow
The CBDR gives you targets; the rest of your toolkit gives you direction and timing. So the range never trades alone. Start with higher-timeframe bias, then use the deviations to frame where price is likely to reach.
First, set direction from the daily and four-hour charts. A bullish daily draw on liquidity tilts you toward the deviation levels above the range, and a bearish draw points you at the levels below. Second, wait for the session windows where price actually travels. London from 02:00 to 05:00 and the New York morning from 08:30 to 11:00 New York time do most of the work. Then let price react at a deviation and confirm with lower-timeframe structure before you commit.
The order of operations protects you from the most common mistake. Traders who lead with the deviations, and only later check bias, end up fading strong trends into thin air. Instead, let bias narrow the choice to one side of the range before you even glance at the targets. So on a bullish day you simply ignore the levels below the box, and on a bearish day you ignore the ones above it. This discipline cuts the number of setups in half and lifts the quality of the ones that remain.
The CBDR also pairs naturally with the day’s opening reference. Many traders combine it with the ICT midnight open to judge whether price sits at a premium or discount relative to the new day. Meanwhile our guide to ICT daily bias walks through building that directional read before the range even completes.
The Best Days to Use It
Timing across the week matters as much as timing within the day. ICT points to Tuesday and Wednesday as the strongest CBDR days. Monday often drifts as the week finds its footing, and Thursday or Friday can distort under high-impact news and end-of-week positioning. So the midweek sessions tend to respect the deviations most cleanly. Our free forex market hours tool shows exactly when the 14:00 window opens in your local time.
How Price Reacts at Each Deviation
The deviations are not equal in weight, so read them with nuance. Each level tends to produce a different kind of reaction, and knowing the pattern keeps your targets realistic.
The first deviation usually acts as an early reaction point. Price often pauses there, offers a partial exit, and sometimes stalls for a whole session. Then the second deviation tends to be the more common full target on trending days. It is far enough to reward patience yet close enough to reach within a normal session. So many traders treat the second deviation as their main objective and the first as a scaling zone.
The midpoint deserves attention too. Halfway between the range high and low sits the equilibrium of the box, and price frequently returns to it before choosing a direction. So a retrace to the midpoint during London is common and does not, by itself, invalidate the setup. Instead, watch how price behaves there: a clean rejection off equilibrium in the direction of your bias often marks the start of the real delivery toward the deviations.
The Third Deviation and Beyond
The third deviation is different. Price reaches it mainly on expansion days, often driven by news or a strong higher-timeframe trend. Truly, a run to the third level signals unusual momentum rather than ordinary delivery. So rather than fade it, respect it as a sign that the session has broken out of its normal rhythm. Reaching a fourth deviation is rarer still and usually means the range was too small for the day’s real volatility. On those days, the box simply failed to capture the true condition of the market.
Combining the Two Reference Ranges
Advanced users stack the CBDR with the Asian session range for confluence. When a CBDR deviation lands near an Asian range projection, that shared level carries extra weight. So price reacting at a doubled-up zone offers a higher-quality signal than either range alone. This layering also helps on days when one range prints an awkward height, since the second range can confirm or reject the read. Keep the two boxes on separate colors so you never confuse which projection you are trading.
Worked Example: A Long Toward the Upper Deviations
Run a bullish case first, step by step. EURUSD holds above a rising daily draw on liquidity, so the bias favors longs. It is a Wednesday, and the CBDR looks clean. So this is exactly the kind of day the model was built for, with a midweek session, a modest range, and a clear higher-timeframe direction to lean on.
Between 14:00 and 20:00, EURUSD prints a 22-pip box from 1.0908 to 1.0930. So the first deviation above sits at 1.0952 and the second at 1.0974. During the London session, price dips into the discount half of the range near 1.0912, sweeps a minor low, and rejects. Then a fifteen-minute structure shift breaks the last lower high and leaves a small fair value gap. A long inside that gap carries a stop below the range low, near 1.0904.
Targets come straight from the ladder. The first deviation at 1.0952 offers a logical partial exit, and the New York morning drives price into the second deviation at 1.0974. Price stalls there and rejects, which is the reaction the model expects at a projected level. This alignment of discount entry and premium target is where the equilibrium idea earns its place, a concept our note on premium and discount unpacks in full.
The aftermath confirms the read. After tagging the second deviation, price failed to close above it and drifted back toward the range for the rest of the day. That behavior is typical when a session reaches its measured objective early. Exit style stays personal here, whether you bank the full target, trail a stop, or scale out across both deviations. Yet the plan never changed once the levels were drawn before London.
Download the complete indicator database
Put these concepts on your charts. One email unlocks the full library of 1,380+ indicators with compiled MT4 and MT5 files, plus my TradingView scripts. No paywall, no spam, unsubscribe any time.
Get free access to my indicator database
One email unlocks 1,380+ free MT4, MT5 and TradingView indicators — the complete library. No single-tool download; you get the whole database.
Worked Example 2: A Short Toward the Lower Deviations
Now flip the direction. GBPUSD trades below a falling daily draw on liquidity, so the bias favors shorts. The plan is to sell a rally into the range and target the deviations beneath it. The chart below marks the CBDR box, the entry, and the downside levels.

Between 14:00 and 20:00, GBPUSD coils in a box from 1.33674 to 1.33815. So the first deviation below sits at 1.33533 and the second at 1.33392. During the London open, price pushes up into the premium half and sweeps the range high to 1.33934. Then it rejects hard and prints a bearish structure shift on the five-minute chart.
The entry follows the rejection. A short near the swept high carries a stop above 1.33954, roughly 12 pips of risk. Next, the New York morning delivers the expansion down through the first deviation at 1.33533 and into the second at 1.33392, where price finally bases near 1.33269. Notice the sequence never changes: coil, sweep, reject, deliver toward the projected level. Only the direction flipped from the first example.
Position sizing deserves a word here. A 12-pip stop keeps the risk tight, yet a tight stop only helps if you size the trade sensibly against your account. So decide the lot size from the stop distance, not the other way around. Our position size calculator turns the stop in pips into a precise lot figure, which keeps every CBDR trade inside the same risk budget regardless of how tall the range prints.
Common Mistakes and How to Fix Them
The model is mechanical, yet the same errors repeat. The graphic below collects the four traps we see most, and the fixes follow beneath it.
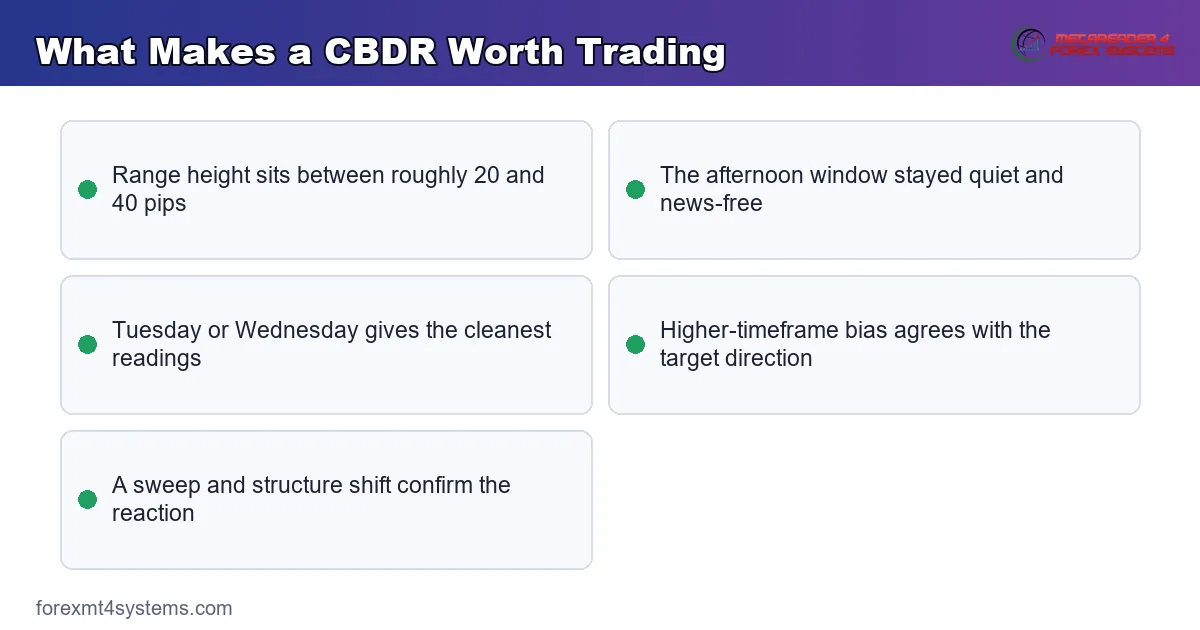
Using a distorted range
A CBDR stretched by afternoon news gives bloated, unreliable deviations. So check the height first, and if it runs well beyond 40 pips, skip the projection for that day rather than forcing it.
Trading toward the deviations blindly
The levels are targets, not entry signals on their own. Instead of buying or selling the moment price nears a deviation, wait for a sweep and a structure shift to confirm the reaction. The deviation tells you where, not when.
Ignoring the higher timeframe
Aiming at the upper deviations while the daily draw points down invites a shallow bounce and a quick reversal. Always align the direction of your target with the higher-timeframe bias before you act.
Forcing it on the wrong day
Monday drift and Friday news often break the clean rhythm. Rather than trade every session, favor Tuesday and Wednesday, when the deviations tend to hold their reputation for precision.
Quick-Reference Checklist
Run this list before you trade any CBDR projection. A minute here saves a poor entry later. Treat any unchecked box as a reason to stand aside.
- Range boxed from 14:00 to 20:00 New York time.
- Height measured and confirmed between roughly 20 and 40 pips.
- Deviations projected above and below in equal steps.
- Higher-timeframe bias marked on the daily and four-hour charts.
- Day of week noted, with a preference for Tuesday and Wednesday.
- Entry taken only after a sweep and structure shift confirm the reaction.
- Stop beyond the range extreme, target at the next logical deviation.
Honest Limitations: When the Range Fails
Study the failure case as closely as the success case. Here is a common one. EURUSD prints a tidy CBDR on a Wednesday, and the deviations look textbook. Then a surprise central-bank headline hits during the London session. Price rockets straight up through the first, second, and third upper deviations to 1.14356 without a single clean reaction. The chart below shows that runaway move blowing past every projected level.
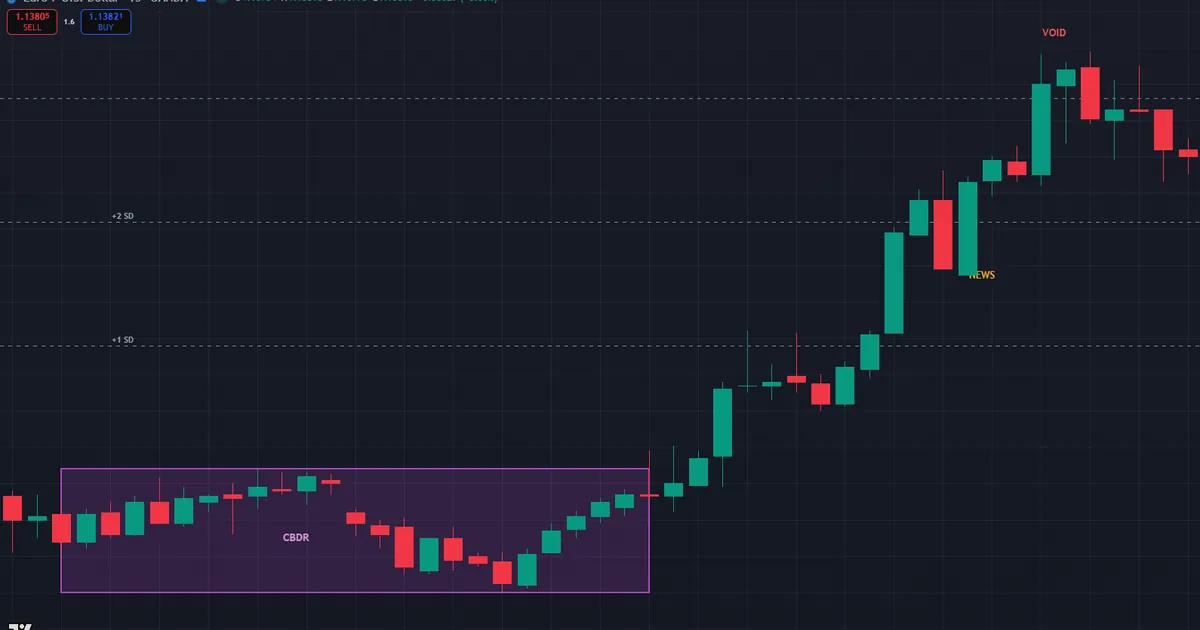
What went wrong? The model assumes ordinary, algorithmic delivery. A shock headline overrides that delivery entirely, and the measured steps mean nothing while the news reprices the market. Hence the invalidation rule. Once price slices through two deviations without reacting, treat the projection as void for the session and step aside until normal conditions return.
The wider lesson is about context, not mechanics. A projection tool can only describe a market that is behaving normally. So the CBDR shines on quiet, orderly days and fails on chaotic ones, which is precisely why the day-of-week filter exists. Checking the economic calendar before you draw the range does more for your results than any tweak to the deviation math. When a major release lands during your target session, expect the box to matter far less than usual.
Journaling the Void Days
Then log the day while it stays fresh. Note the pair, the range height, the day of week, and the news event that broke the pattern. Also record how far price ran past the deviations before settling. Review a few dozen of these notes and a filter emerges. Failed CBDR days cluster around scheduled high-impact releases and end-of-week sessions, exactly where the theory already warns you to tread lightly. Over time, that log becomes your own personal rulebook for which sessions to skip.
No Fixed Success Rate Exists
Be blunt about this point. No reliable success percentage exists for the CBDR, and anyone quoting one is guessing. Outcomes hinge on your range selection, your bias, and your discipline around news. Qualitatively, clean midweek ranges of ideal height, traded in the direction of the daily draw, hold up far better than wide ranges taken against the trend. That direction of effect is the only honest claim worth making.
Related Concepts to Study Next
The CBDR belongs to a family of reference-range tools, and two siblings deserve your next reading hour. The Asian session range works on the same principle over a different window, and our guide to the ICT Asian range strategy shows how those deviations feed the London move. Meanwhile the deviations often deliver their reaction inside a specific execution window, which our breakdown of the New York kill zone covers in detail. For the full timing map that ties all these windows together, read the complete guide to ICT kill zones, and browse the wider set of smart money indicators to automate the range plotting. Master the range, the deviations, and the timing together, and the late-day box stops looking like dead time. Build the levels the same way every day, and the routine soon takes under a minute before London opens.
FAQ
What does CBDR stand for?
CBDR stands for central bank dealers range. It is the ICT name for the price band between 14:00 and 20:00 New York time, when major dealing desks quiet down. Traders project standard deviations from that range to map the next session.
What time is the central bank dealers range?
The range runs from 14:00 to 20:00 New York time, a six-hour window in the late New York afternoon and early Asian hours. You box off the high and low during that period, then project the deviations outward from the box.
How tall should the CBDR be?
ICT points to a height of roughly 20 to 40 pips as the ideal. A box in that band gives precise, well-spaced deviations. When the range stretches much wider, usually from news, the projected levels lose reliability and are best skipped.
How do you calculate the standard deviations?
Each deviation equals the height of the range itself. Add that height to the range high for the first level above, add it twice for the second, and so on. Subtract it from the low in the same steps to build the mirror levels beneath.
Which days work best for the CBDR?
Tuesday and Wednesday tend to give the cleanest readings. Monday often drifts while the week settles, and Thursday and Friday can distort under news and end-of-week positioning. So the midweek sessions usually respect the deviations most reliably.
Can I trade the CBDR on its own?
No single range tool should stand alone. Combine the deviations with higher-timeframe bias, a liquidity sweep, and structure confirmation before entering. Always manage risk on every trade. Results are not guaranteed; past performance is not indicative of future results.
External references
- For background on this concept, see Central bank on Wikipedia.
- For broader market context, see Interbank Market at Investopedia.

About the author
Written by Dominic Walsh, a Forex trader and MT4/MT5 indicator, Expert Advisor and script developer. Every tool on forexmt4systems.com is tested on live charts before release and ships with ready-to-use compiled MT4 (.ex4) and MT5 (.ex5) files. Learn more about the trader and developer behind this site.
How we build, test and correct every tool: Editorial & Testing Policy. Trading carries risk; see the disclaimer.