
Learning how to set risk reward ratio in TradingView takes about a minute once you know the right tool. That tool is the built-in Long Position drawing tool, and it does all the math for you. So instead of counting pips by hand and dividing under pressure, you simply drag three lines and read the finished ratio straight off the chart.
This guide shows how to set risk reward ratio in TradingView step by step. You will open the Long Position tool, mark your entry, then set your stop and target, and let the tool shade the risk and reward zones for you. By the end you can screen any setup for a fair payoff in a matter of seconds, right on the chart.
How to Set Risk Reward Ratio in TradingView
The Long Position tool is built for exactly this job. It draws a green zone for your reward and a red zone for your risk. So a glance tells you whether a trade pays enough for what it risks.
The tool sits in the drawing toolbar on the left of the chart. It shares a slot with the Short Position tool, one for longs and one for shorts. So you simply pick the version that matches the direction of your intended trade.
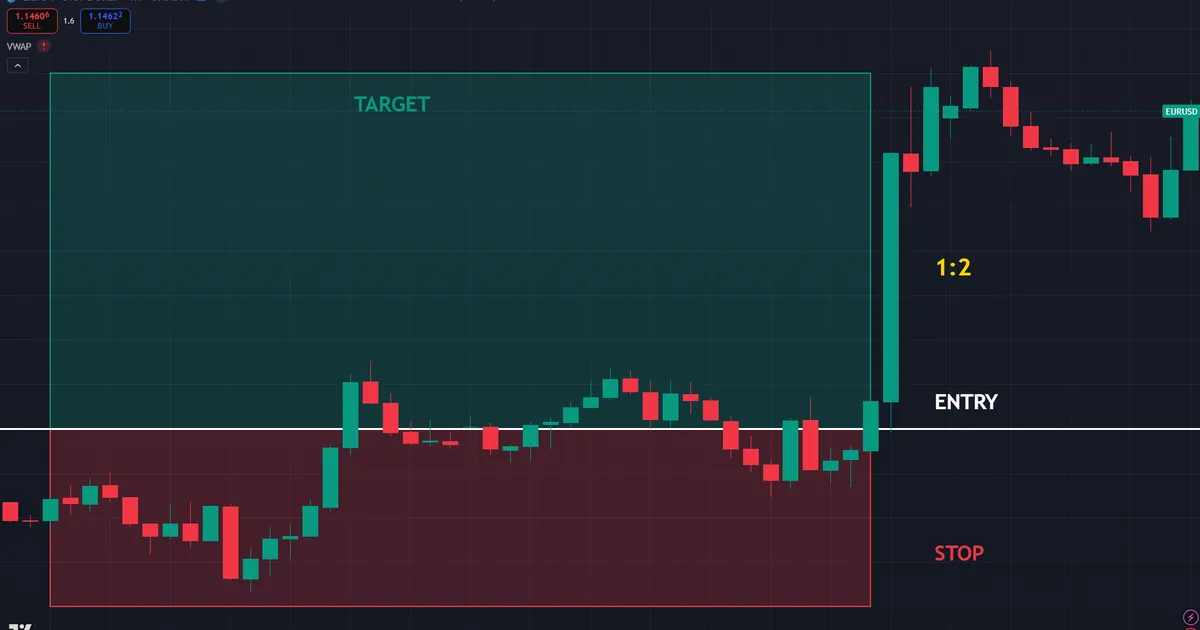
Once placed, the tool shows the stop and target in price, percent, and ticks. It also prints the profit, the loss, and the reward-to-risk ratio. So every number you need to judge the trade appears in one small panel.
That panel travels with the box as you drag it. Slide the whole tool to a new entry, and every figure recalculates at once. So you can audition several entries on the same setup and compare their ratios in seconds.
Why the Long Position Tool
You could measure risk and reward by hand, yet that invites errors. Counting pips and dividing under pressure leads to slips. So a tool that computes the ratio live removes a common source of mistakes.
The tool also updates as you drag. Move the target higher, and the ratio climbs in real time. So you can shape a trade to a clean payoff before you ever place an order.
A Visual You Can Trust
Numbers alone can hide a lopsided trade. The colored zones fix that by showing risk and reward as areas you can see. So a red block that dwarfs the green one warns you at a glance, long before you read a single figure. A green block that towers over the red, by contrast, flags a setup worth a closer look.
This visual feedback matters most under pressure. In a fast market, a quick look at the two zones tells you whether a trade is worth it. So the tool turns a rushed judgment into a calm, visual check.
Setting the Ratio Step by Step
The whole process takes five short steps. Follow them in order, and the ratio appears without any manual math.
- Open the toolbar. Find the position tools in the left drawing panel and pick Long Position.
- Set the entry. Click the chart at your intended entry price to drop the tool.
- Drag the stop. Pull the lower handle down to your stop level, which shades the red risk zone.
- Drag the target. Pull the upper handle up to your target level, which shades the green reward zone.
- Read the ratio. Check the panel for the reward-to-risk figure the tool prints.
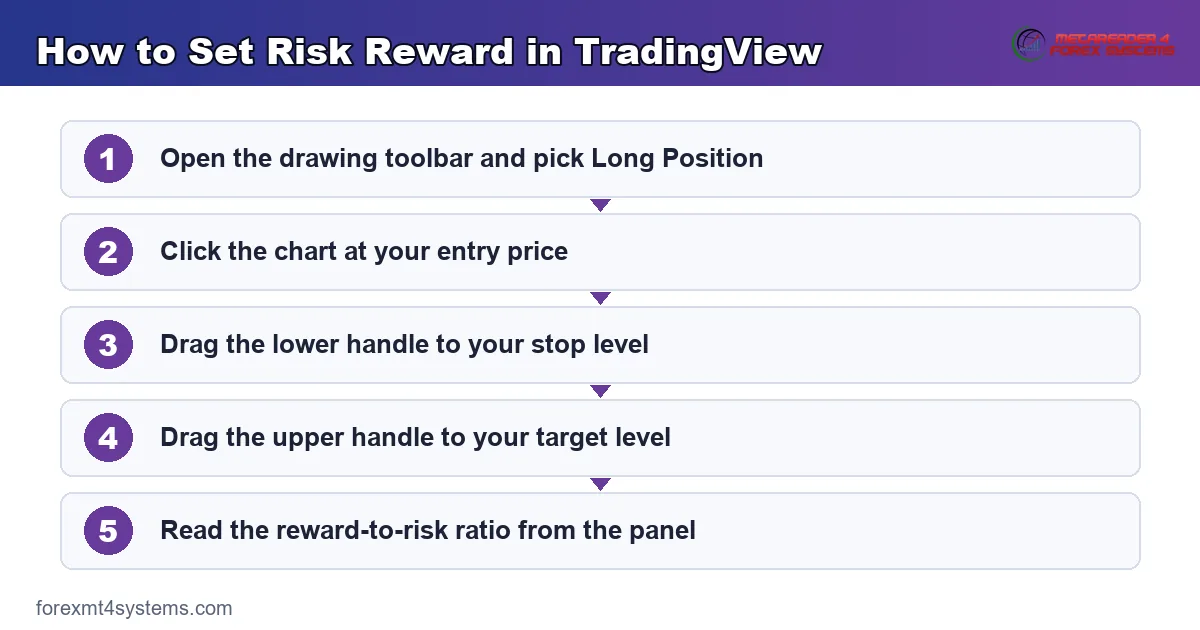
Notice how little arithmetic you did. The tool measured both distances and divided them for you. So your only job was to place three lines where structure told you to.
Placing the Tool on the Chart
Start by clicking the entry level, the price where you plan to enter. The tool drops with a default stop below and target above. So you begin with a rough box that you then refine to your real levels.
Grab the lower edge and drag it to your stop, below a recent swing low for a long. The red zone stretches to match. So the size of that red block now mirrors the exact risk you accept.
Then reach for the upper edge and pull it to your target. The green zone grows as you drag. So the two blocks together frame the whole trade, with risk below entry and reward above it.
Take your time on this step, since the levels decide everything. A rushed drag lands the stop or target at a random price. So place each handle on a real level, and let the tool report the ratio those honest levels create.
Reading the Ratio It Prints
Look at the panel that floats with the tool. It lists the target and stop as prices and percentages, then the reward-to-risk ratio. So a reading of two means the green reward zone is twice the height of the red risk zone.
That single figure is the whole point. It tells you, in one number, whether the trade pays fairly for its risk. So you can accept or reject the setup on the spot, before committing a cent.
Adjusting the Zones to Hit Your Target Ratio
The tool shines when you shape a trade toward a floor. Say you demand a minimum of one-to-two on every setup. So you drag the zones until the panel shows two or more, then check the levels still make sense.
Never force the ratio by moving a level into thin air, though. The stop and target must rest on real structure. So you adjust within reason, and reject the trade if an honest layout falls short of your floor.
Dragging to a Clean Ratio
Suppose your stop sits forty pips below entry on EURUSD near 1.14. A target eighty pips above then prints a clean one-to-two. So the green zone stands twice as tall as the red, and the panel confirms the figure.
Now imagine a nearby resistance only sixty pips up. Dragging the target there drops the ratio to one-to-1.5. So you weigh whether that lower payoff still clears your floor, or whether to skip the trade.
This is the tool’s real value in one moment. It forces an honest choice between a realistic target and a flattering one. So rather than dreaming up a distant level, you see the true payoff of the level price can actually reach.
You can also test a wider stop the same way. Drag the red zone down to a safer level, and watch the ratio fall. So the tool shows the cost of extra safety, letting you balance a survivable stop against a fair reward.
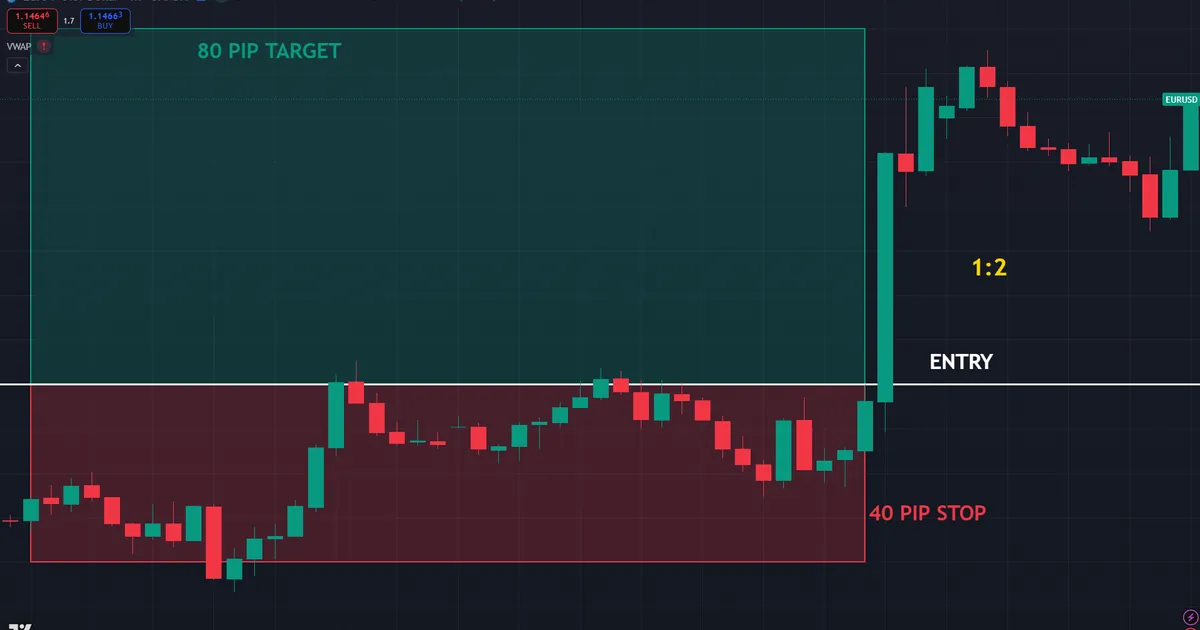
Cross-check the reading with our risk reward calculator when you want a second opinion. Enter the same stop and target distance, and it returns the ratio too. So the calculator and the chart tool confirm each other.
The two tools suit different moments. A live setup calls for the chart tool, since it shades the zones right in place. Planning away from the chart, or a quick what-if on paper, calls for the calculator instead. So keep both handy and reach for whichever fits the task.
Setting Account Size and Risk
Open the tool’s settings to enter your account size and risk. You type the balance and the amount you will risk, either as a figure or a percent. So the panel then shows the position size that keeps the loss at your line.
This turns the drawing tool into a quick sizing aid as well. It marries the ratio with the lot size in one place. So you leave the chart knowing both the payoff and the size in a single glance.
What the Panel Tells You
The floating panel packs a lot into a small space. Learn to read each line, and the tool becomes far more than a ratio meter. So take a moment to decode the readouts you will lean on most.
Target and Stop Rows
The panel lists your target and stop three ways, as a price, a percent, and a count of ticks. The price row shows the exact level, while the percent row shows the move from entry. So you can judge distance in whichever unit suits the pair.
Ticks matter on some markets more than pips. On a pair with many decimals, the tick count gives a precise feel for distance. So glance at the row that fits how you normally measure a move.
The percent row is handy across different pairs. It states each move as a share of price, so you compare a major and an exotic on equal terms. So a two percent target means the same thing whether the pair trades near one or near two hundred.
Profit, Loss, and Ratio
Below the levels, the panel shows the money at stake on each side. It prints the profit if the target fills and the loss if the stop hits. So you see the payoff in your account currency, not just as a ratio.
The ratio ties those two figures together. It divides the reward by the risk, so a reading of two means twice the reward for the risk. So this single number is the fastest read on whether a trade earns its place.
Using the Tool Across Timeframes and Pairs
The Long Position tool behaves the same on any chart. Yet the honest ratio shifts as you change the timeframe or the pair. So a little judgment keeps the readings meaningful.
Higher Timeframes, Wider Zones
On a daily chart, structure sits farther apart, so the zones grow. A stop may span a hundred pips rather than forty. So the same one-to-two now covers a much larger move, which suits a patient swing trade.
On a five-minute chart, the zones shrink toward a handful of pips. Costs then eat a bigger share of a tiny reward. So a scalper leans on the tool for tight setups and watches the spread closely.
Volatile Pairs Need Room
A jumpy pair like gold demands a wider stop to survive its swings. Drag the red zone accordingly, and let the target stretch to keep the ratio. So the tool adapts to volatility as long as you place the stop from real structure.
A calmer pair allows a tighter stop and a nearer target. The zones then sit close together. So read the pair’s normal range first, and size the zones to fit how it actually moves.
Making the Tool Faster to Use
Once the tool feels natural, a few habits speed it up. Small tweaks save seconds on every setup, which adds up across a trading day. So invest a little time now to trade more smoothly later.
Save a Default Ratio
Open the settings and set a default reward-to-risk that matches your floor. The tool then drops each new box near your target ratio. So you start close to a fair layout and only fine-tune the levels from there.
This default acts as a gentle reminder of your standard. A box that opens below your floor prompts a second look. So the tool nudges you toward discipline without any extra effort.
Learn the Keyboard Shortcut
You can assign a shortcut to the Long Position tool in the drawing settings. A single key then arms it, ready to click your entry. So you skip hunting through the toolbar on every trade.
Pair the shortcut with a habit of clearing old tools. Arm the tool, draw the box, read the ratio, then remove it. So the chart stays clean, and each setup gets a fresh, honest read.
Color the Zones for Clarity
The settings let you tune the zone colors and opacity. A bolder green and red make the balance jump out at a glance. So a quick look tells you the story even before you read the panel.
Download the complete indicator database
Put these concepts on your charts. One email unlocks the full library of 1,380+ indicators with compiled MT4 and MT5 files, plus my TradingView scripts. No paywall, no spam, unsubscribe any time.
Get free access to my indicator database
One email unlocks 1,380+ free MT4, MT5 and TradingView indicators — the complete library. No single-tool download; you get the whole database.
The Short Position tool works the same way, only flipped. The red risk zone sits above entry, and the green reward zone sits below. So a short trade reads exactly like a long, with the two zones simply mirrored across the entry line.
Common TradingView Ratio Mistakes and Fixes
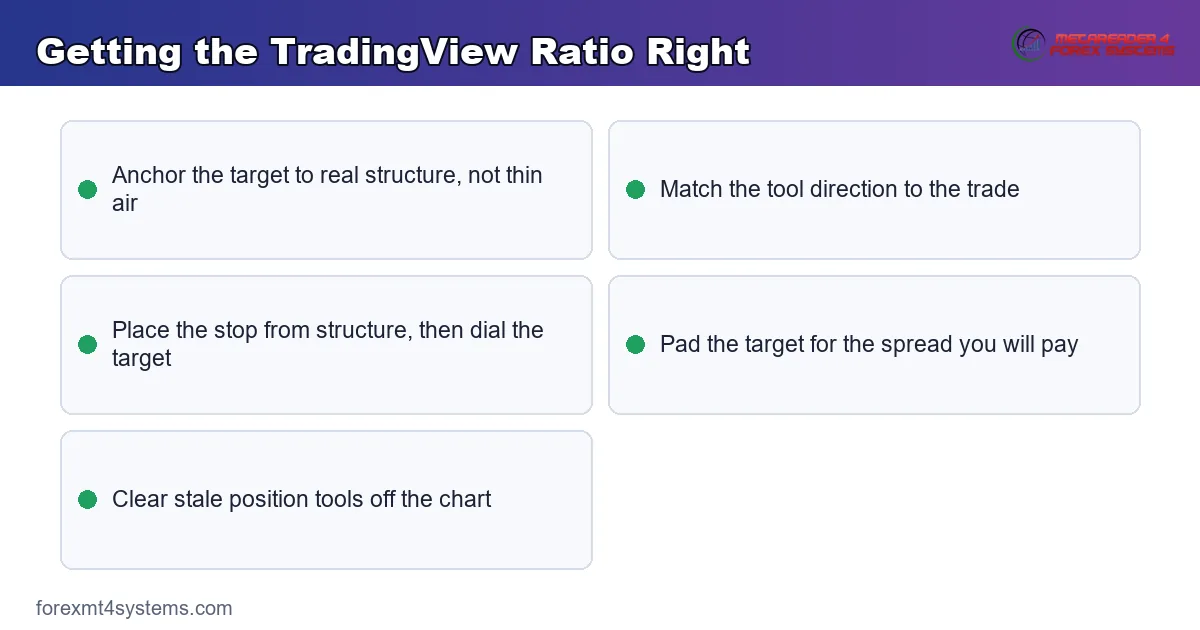
The tool is simple, yet a few habits blur the reading. Most come from forcing the ratio rather than reading it. The checklist below pairs each slip with a quick fix.
Forcing the Ratio With a Fake Level
Dragging the target far past any structure inflates the ratio on screen. Yet that target rarely fills, so the pretty number lies. So anchor the target to a real level, and accept the honest ratio the chart offers.
Using the Wrong Tool Direction
Grabbing the Long Position tool for a short trade flips your zones. The risk and reward then sit on the wrong sides. So match the tool to the trade, Long for a buy and Short for a sell, every time.
Ignoring the Stop Placement
Some traders set a tidy ratio but a careless stop. A stop pinned too close clips out on noise. So place the stop from structure first, then let the target dial the ratio around it.
Reading Ratio Without Costs
The tool measures raw price distances, not the spread. So a one-to-two on screen can settle nearer one-to-1.8 after costs. Pad the target a shade, and treat the printed figure as slightly generous.
Leaving Stale Tools on the Chart
Old position boxes pile up and clutter the view. They confuse the next read and hide fresh levels. So clear finished tools, and draw a clean one for each new setup you study.
Judging the Trade on the Ratio Alone
A tidy ratio can lull you into skipping the rest of the plan. The tool shows the payoff, yet it says nothing about the trend or the news ahead. So read the ratio as one input among several, not as the whole decision.
Quick Reference Checklist
Keep this short list beside the chart. Run through it each time you screen a setup.
- Pick Long Position for a buy, or Short Position for a sell.
- Click your entry level to drop the tool.
- Drag the stop to structure, shading the red risk zone.
- Drag the target to structure, shading the green reward zone.
- Read the reward-to-risk figure from the panel.
- Reject the trade if an honest layout falls below your floor.
Pitfalls and Edge Cases
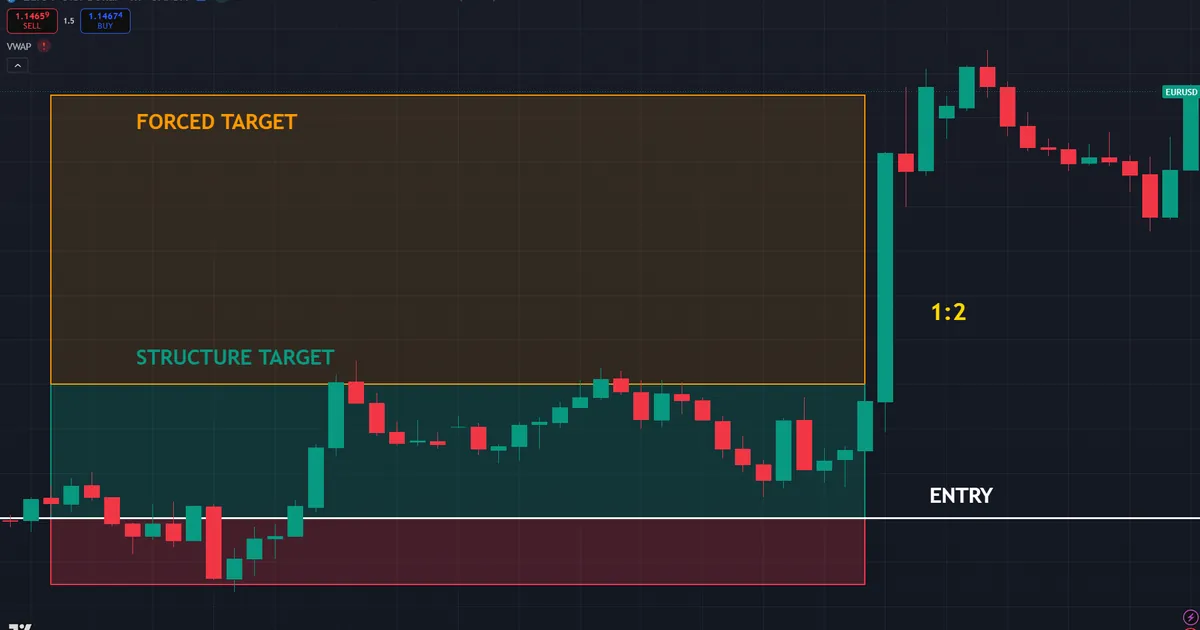
A few wrinkles bend the clean reading, so keep them in view. The chart below sets a target anchored to real structure against one forced far above it. Both targets start from the same entry line.
Percent Versus Price Confusion
The panel shows both percent and price for the levels. Reading the wrong row can mislead you on a big pair. So confirm which figure you are reading before you judge the ratio.
Default Settings Carry Over
The tool remembers your last account size and risk. A stale setting then sizes the next trade wrong. So glance at the settings on each fresh setup, and update them when the account changes.
The Ratio Ignores Hit Rate
A clean two on the tool says nothing about how often the target fills. A distant target lifts the ratio but lowers the fill rate. So pair the ratio with your real hit rate before you trust it.
The Tool Does Not Place Orders
The Long Position drawing is a study aid, not an order. It shapes the plan, yet you still place the trade separately. So treat the tool as a ruler, and enter the stop and target through your order ticket.
Related Concepts to Study Next
The tool draws the ratio, yet the judgment behind it rewards deeper study. The mechanics of the ratio shape every read. Your exits then decide the two zones the tool shades.
Start with the risk reward ratio explained for the full mechanics. Then read what a good risk reward ratio is and compare the two exits in stop loss versus take profit. To place the risk side well, study how to use a stop loss, then size the trade with our position size calculator and plan it on our forex trading strategies hub.
FAQ
How do I set a risk reward ratio in TradingView?
Pick the Long Position tool from the drawing toolbar, then click your entry price. Drag the lower handle to your stop and the upper handle to your target. The tool then shades the two zones in green and red and prints the reward-to-risk ratio for you in the panel.
Where is the Long Position tool in TradingView?
It sits in the drawing toolbar on the left of the chart, in the position tools group. It shares that slot with the Short Position tool, so a small arrow or long-press reveals both. Choose Long for a buy and Short for a sell.
Can the tool show my position size too?
Yes, open the tool settings and enter your account size and risk amount. The panel then shows the lot size that holds the loss at your chosen line. So you read the ratio and the size in one place.
Does a higher ratio on the tool mean a better trade?
Not on its own, since a bigger ratio pushes the target farther and lowers how often it fills. The tool shows the payoff, not the odds. Pair the printed ratio with your real hit rate before you judge the setup.
Why does my ratio look great but the trade still loses?
A ratio forced with a distant target flatters the screen yet rarely fills. Costs also trim the reward the tool ignores. So anchor the target to structure, pad it for the spread, and read the ratio as slightly generous.
Does the tool promise a profit if the ratio is high?
No tool promises a profit, since price stays uncertain on any single trade. The Long Position tool only measures the payoff so you can screen setups quickly. Pair it with a sound hit rate, size small, and stay patient. Results are not guaranteed; past performance is not indicative of future results.
External references
- For background on this concept, see Rate of Return on a Portfolio on Wikipedia.
- For broader market context, see Sharpe Ratio at Investopedia.

About the author
Written by Dominic Walsh, a Forex trader and MT4/MT5 indicator, Expert Advisor and script developer. Every tool on forexmt4systems.com is tested on live charts before release and ships with ready-to-use compiled MT4 (.ex4) and MT5 (.ex5) files. Learn more about the trader and developer behind this site.
How we build, test and correct every tool: Editorial & Testing Policy. Trading carries risk; see the disclaimer.