
The ICT midnight open is the price at exactly 00:00 New York time, used as a daily reference that splits the day into premium above and discount below. Michael Huddleston, the Inner Circle Trader (ICT), teaches that the trading day truly begins at midnight, not at the London or New York bell. So this guide explains what the ICT midnight open is, why it matters, and how to trade premium and discount around it.
You will learn how to mark the level, how to read price relative to it, a worked walkthrough, and the honest ways the midnight open misleads traders on trending days. By the end, you can anchor every intraday decision to one clean reference line.
What the ICT Midnight Open Is
The ICT midnight open is a single horizontal line: the price printed at 00:00 New York time. It resets each day and acts as the day’s equilibrium. Price above it sits in premium, and price below it sits in discount. Hence the line turns a messy chart into two simple halves.
ICT treats midnight as the algorithm’s daily reset. The new day’s delivery, in this view, references that opening price all session long. So the midnight open is less a support level and more an anchor, a fixed point the day’s move is measured against.
The chart below shows a EURUSD 30-minute chart. The midnight open printed at 1.14290. Early in the session, price held premium above the line, near 1.14350. Then delivery pushed it down through the open and into discount, reaching 1.14180.
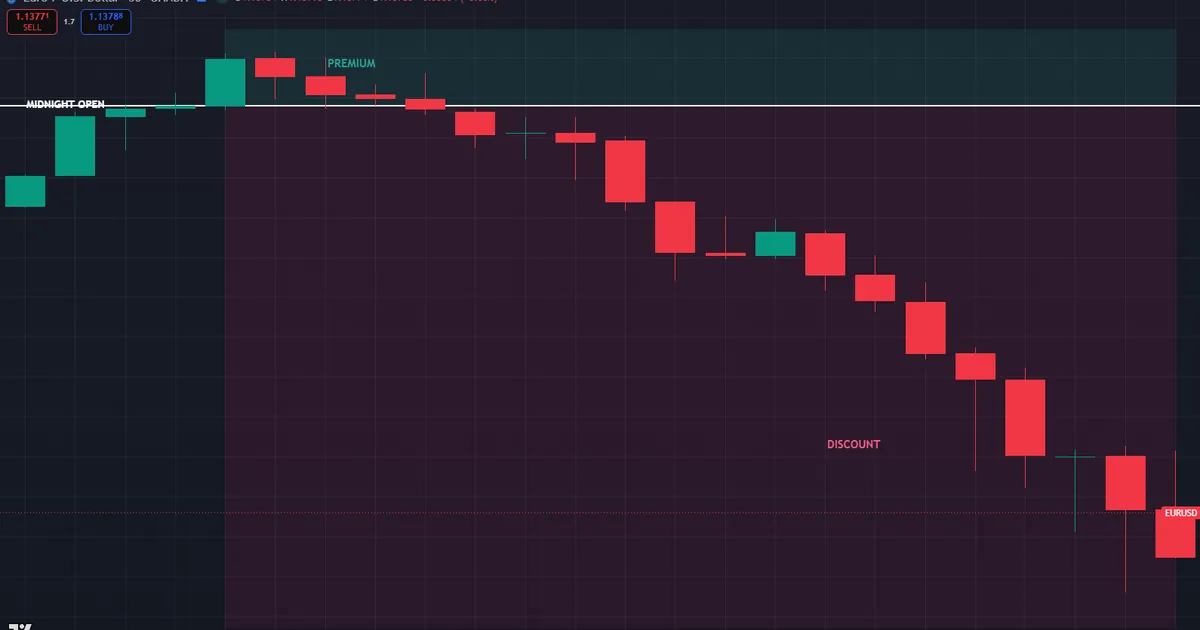
Reading the EURUSD 30-minute chart
Notice the rotation around the line. Price spent the early session above the midnight open, holding premium. That premium was the value area for a bearish day, the place to look for shorts rather than longs.
Delivery then broke the open with force. A displacement candle pushed down through 1.14290, confirming the shift from premium toward discount. Truly, the midnight open marked the exact midpoint the day rotated around.
Trace the path once more, since the order teaches the lesson. Price held premium early, stalled there while volume stayed thin, then broke down through the open as delivery arrived. So the premium was the opportunity and the break lower was the confirmation, both measured against one fixed line.
Also, weigh what the line never sold you. It gave a reference and a framework, yet it never promised the discount would keep extending. On a strongly bullish day, price can reclaim the open and run higher, which is why bias always comes first.
Why 00:00 New York time
The choice of midnight is deliberate, not arbitrary. New York is the reference clock for the ICT model, and 00:00 there sits during the quiet Asian hours. So the open forms in thin liquidity, before London or New York has shown its hand.
That timing gives the level a clean start. Price at midnight reflects the overnight balance, uncontaminated by the day’s main sessions. Then the algorithm delivers around it as volume arrives, which is why the open so often behaves like a magnet or a pivot.
The Midnight Open and the True Day
ICT frames midnight as the start of the true trading day. Most platforms label a day from broker rollover, often 17:00 New York time, yet the model prefers 00:00 New York for its delivery logic. So the midnight open marks where the algorithm’s fresh day genuinely begins.
Standard deviations from the open
Some traders project bands from the open using standard deviations. They measure an early range, then extend multiples of it above and below the line as likely reach points. So a first deviation might mark a modest target, while a third deviation flags an extended, less common move.
Treat these bands as guides, not promises. They frame how far a day might stretch from equilibrium, which helps you set realistic targets. Still, structure and liquidity pools always outrank a projected band when the two disagree.
Pairing the open with other references
The midnight open rarely works alone. Traders stack it with the previous day high and low, the weekly open, and nearby session extremes. Then a confluence forms when the open lines up with one of those pools, which strengthens the read. A midnight open that sits right on the previous day low, for instance, gives two separate reasons to expect a reaction there rather than only one, and that overlap is always worth marking clearly on the chart before the sessions begin their delivery.
Layering references also cross-checks your bias. When the open sits in discount and the previous day low rests just below, both point the same way. Hence the confluence is not decoration; it raises the odds that price rotates as planned.
How to Use the ICT Midnight Open
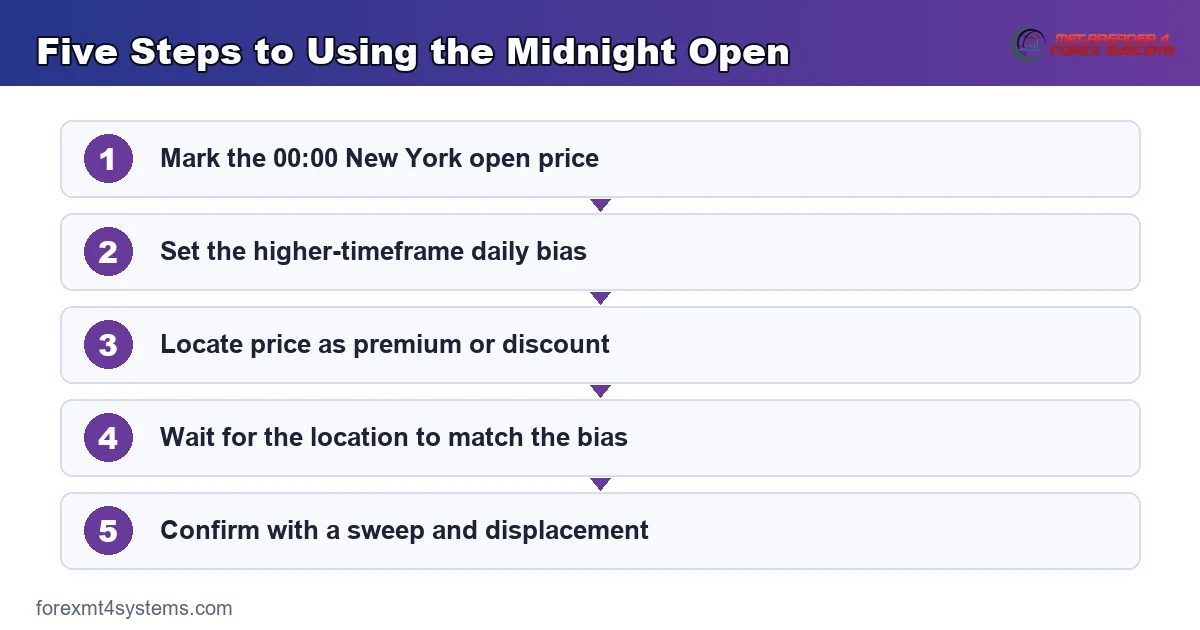
The midnight open is a framework, not a signal on its own. Now walk the steps, because the line only earns its keep when you pair it with bias and structure.
- Mark the open. Draw a horizontal line at the 00:00 New York time price and extend it across the day.
- Set the bias. Decide whether the daily draw on liquidity points up or down.
- Locate price. Note whether price sits in premium above the open or discount below it.
- Wait for alignment. On a bullish bias, look for longs from discount, not from premium.
- Confirm with structure. Require a sweep and displacement before you enter, using the open as your reference.
Each step guards the next. A discount price with a bearish bias is not a buy, and a premium price with a bullish bias is not a chase. Thus the open filters entries by location, while bias and structure supply the trigger.
The first graphic below compresses these five steps into one pre-trade card.
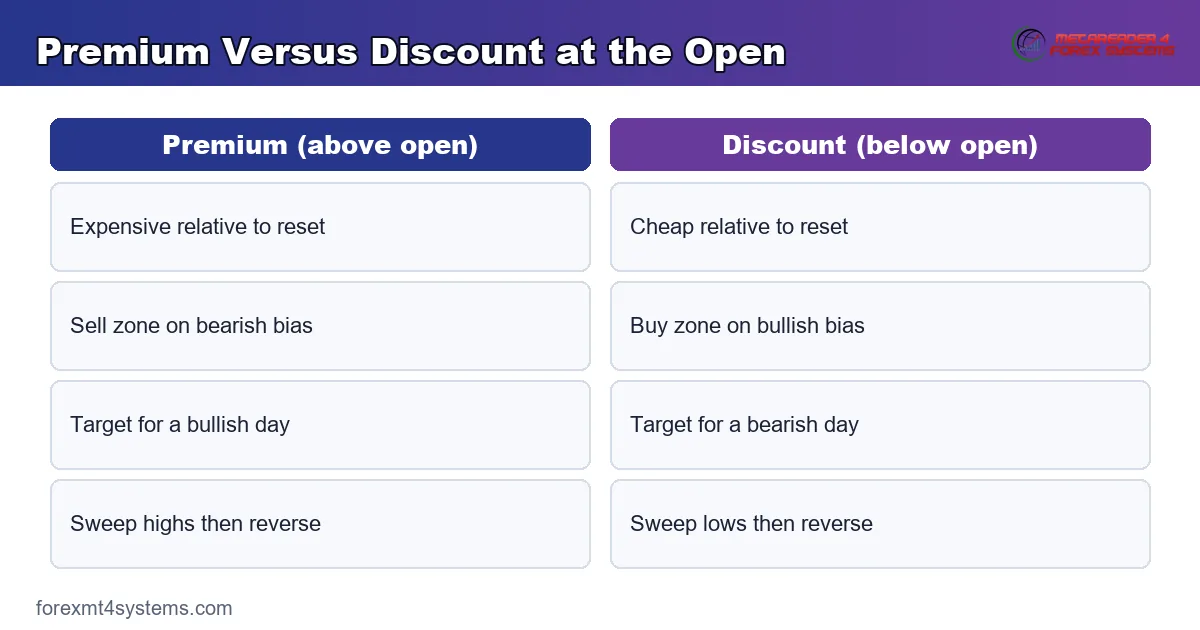
Premium and discount around the open
The open works as your equilibrium line. Everything above is expensive, and everything below is cheap, relative to the day’s reset. So a bullish day wants you buying the discount below the open, then targeting premium above it.
Flip the logic for a bearish day. Then premium above the open is the value area to sell, and discount below becomes the target. The premium and discount guide shows how to draw these zones precisely, and the midnight open gives you a clean midpoint to anchor them.
Distance from the open matters too. A price far into premium on a bearish day offers a richer entry than one hugging the line. Hence the open is not just a yes-or-no filter; it grades how good the location really is.
Watch how price behaves at the line itself. A clean rejection back into the day’s direction confirms the open as a working pivot, while a decisive break through it warns that momentum is strong. So the reaction at the open, candle by candle, tells you whether the equilibrium is holding or failing that day.
Where the Midnight Open Sits in the SMC Workflow
The open supplies a reference, not a full trade. Smart Money Concepts (SMC) traders layer four things in fixed order: higher-timeframe context, a point of interest, lower-timeframe confirmation, and the entry. The midnight open frames the second layer by telling you whether a zone sits in premium or discount.
Start on the daily and 4-hour charts, which set the bias and the draw. Next, mark the midnight open and the nearby pools on an H1 chart. Then a 5-minute or 15-minute chart times the trigger, measured against the open. The ICT daily bias routine shows how to set that direction before midnight even passes.
Timeframe pairing and session timing
Split the work across charts deliberately. The 4-hour names the destination pool, the H1 holds the midnight open and the zones, and the 15-minute catches the sweep and displacement. So each chart answers one question, and the open ties them together.
Get the clock right first. The midnight open depends on your platform showing the correct New York time, and daylight-saving shifts can move it by an hour. Our free forex market hours tool confirms when 00:00 New York time lands on your own clock, so you mark the right candle.
Worked Example: A Bearish Day on GBPUSD
Bearish days flip the premium and discount logic, and the chart below walks one from the open to target, step by numbered step.
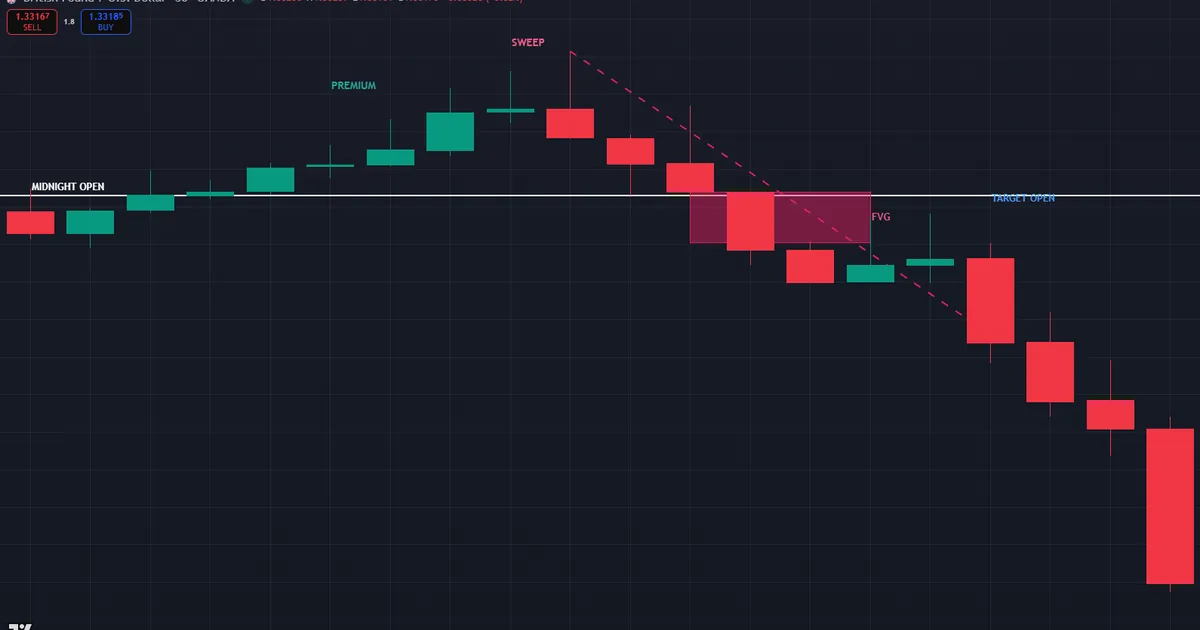
- First, the open: GBPUSD printed a midnight open at 1.34365.
- Next, the bias: the daily chart had displaced lower, so the draw sat below at the previous day low.
- The location: London pushed price up into premium above the open, near 1.34540.
- The trap: price ran to 1.34557, sweeping a small London high and grabbing buy stops in premium.
- The trigger: a fast candle broke back down from premium, leaving a bearish fair value gap between 1.34302 and 1.34370 just below the open.
- The trade: short the premium retrace near 1.34480, stop above the sweep at 1.34580, first target the midnight open at 1.34365.
The premium entry is the point. Selling above the open on a bearish day means selling expensive, exactly where the model says value favors the downside. So the open turned a vague short idea into a located, measurable trade.
Managing the trade around the open
Manage the position against the reference line. The short near 1.34480 risks about 10 pips to the stop, while the midnight open waits roughly 12 pips below as the first target. Many traders bank a partial at the open, since price often reacts there, then trail the rest toward the discount below.
The open also guides the exit logic. When price reclaims the midnight open with force after your entry, the premium-discount read has flipped, and the short loses its edge. Hence the line serves as both a target and a warning, depending on which side price sits.
Also, note the counterfactual. Had the daily draw pointed up, that same premium rally would read as strength, and the clean setup would wait for a pullback into discount below the open instead. So the open never changes, yet the bias flips which side becomes the entry and which becomes the target.
Download the complete indicator database
Put these concepts on your charts. One email unlocks the full library of 1,380+ indicators with compiled MT4 and MT5 files, plus my TradingView scripts. No paywall, no spam, unsubscribe any time.
Get free access to my indicator database
One email unlocks 1,380+ free MT4, MT5 and TradingView indicators — the complete library. No single-tool download; you get the whole database.
Common ICT Midnight Open Mistakes
Six errors show up in almost every midnight open journal, and each has a plain fix.
- Marking the wrong candle. Fix: confirm your platform is on New York time before drawing the 00:00 open.
- Trading the line with no bias. Fix: set the daily draw first, then use the open to locate entries.
- Buying premium on a bullish day. Fix: wait for price to return to discount below the open before going long.
- Treating the open as hard support. Fix: read it as a reference, not a wall, since price trades through it often.
- Ignoring structure. Fix: still demand a sweep and displacement, even when the location looks perfect.
- Forgetting the daily reset. Fix: draw a fresh open each day, because yesterday’s line no longer applies.
None of these errors are exotic. Still, each one quietly turns a clean reference into a coin flip, and only a written record makes them visible.
The reset mistake catches many beginners. A midnight open is only valid for its own day, yet traders leave old lines on the chart and confuse themselves. So clear the previous open each morning and mark the new one before the sessions begin.
The second graphic pairs the six mistakes with their fixes for a fast pre-trade review.
ICT Midnight Open Pre-Trade Checklist
Run these lines before the London session, in order and without exceptions. Any failed line downgrades the setup or removes it entirely.
- Platform confirmed on New York time.
- Midnight open drawn at the 00:00 price and extended across the day.
- Daily draw on liquidity named as either up or down.
- Price located as premium above or discount below the open.
- Location checked against the bias for agreement.
- Nearby pools marked for the sweep to target.
- Displacement candle confirmed before entry.
- Entry, stop, and first target written before the fill.
Also, grade each setup before you trade it. Score the bias, the location relative to the open, and the structure, then reserve full risk for the cleanest reads. Over a month, those grades show whether the open genuinely sharpens your entries.
Keep the completed cards as a record. A run of them reveals which check you skip under pressure, and that skipped line is usually the next fix. So the checklist is not busywork; it is the feedback loop that turns the midnight open from an idea into a habit you can trust.
Limitations and a Failed Midnight Open Read
The midnight open fails in specific, predictable ways. On a strongly trending day, price can open in discount and simply keep falling, never rotating back to premium. So the equilibrium idea breaks when one side dominates the whole session.
The level is also just a reference, not a force. Price does not have to respect the open, and it trades straight through the line on high-volume days. Meanwhile, purpose-built ICT indicators for MT4 and MT5 can plot the open automatically, which removes the risk of marking the wrong candle.
Keep expectations honest and qualitative. No public dataset measures how often price respects the midnight open, and any precise figure online is a guess. What your own journal can show is a pattern over time: whether the open improves your location on the days you actually trade.
News days deserve special caution. A major release can gap price far from the open before any session begins, which distorts the premium-discount read for hours. So on heavy calendar days, lean on the open lightly and let structure lead. A framework built for orderly delivery struggles when the day opens on a shock.
A failure walkthrough: the trend that ignored the open
The chart below shows the loss that teaches midnight open discipline fastest. Picture EURUSD with a bullish plan: price in discount below the 1.14420 open, daily bias pointing up. You wait for the discount to hold and buy the bounce back toward the line. Instead, price closes candle after candle lower, sliding to 1.13982 and never reclaiming the open.
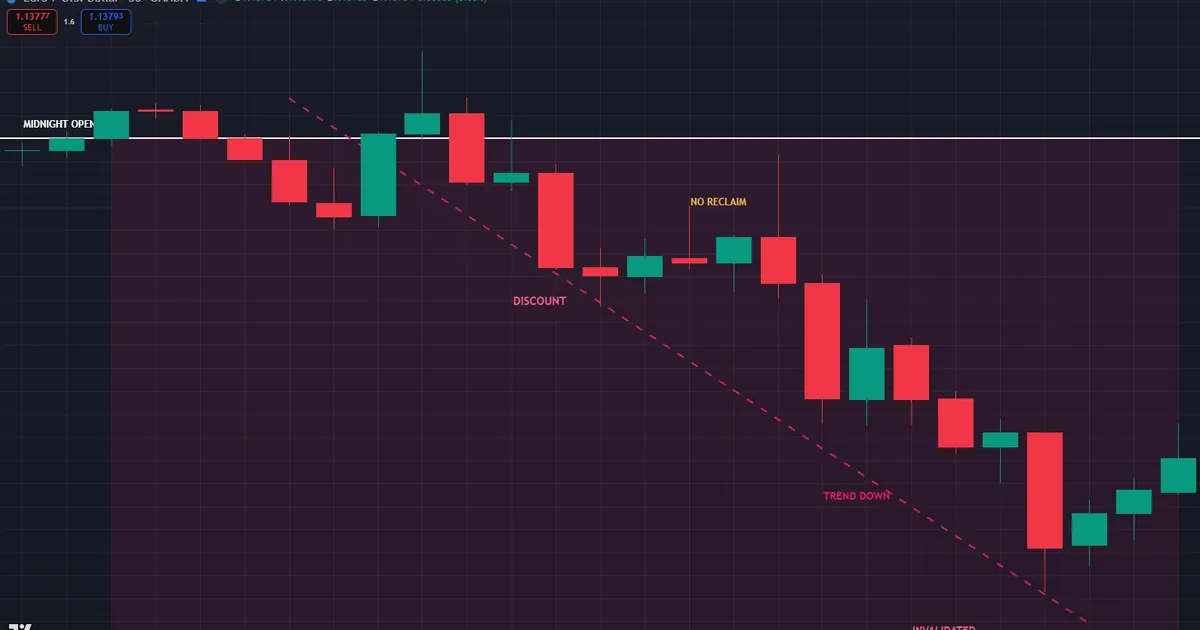
That behavior is a trend overriding the equilibrium. The clue is the close: price printed lower bodies well below the open with no reclaim, which means the bullish bias was simply wrong. Hence the invalidation rule is strict. When price extends deep into discount and holds there, the equilibrium read is void, and the long should never have fired without confirmation.
Log the day as a bias failure, not an open failure. Record how far price ran below the line, whether news drove the trend, and what a confirmed entry would have required. Indeed, one honest failure entry teaches more than a week of clean rotations, because it shows where the framework bent.
What the failed read teaches
There is a lesson about tools here too. The midnight open locates price, yet it never sets direction on its own. So a wrong bias makes even a perfect location worthless, which is why the open sits second in the workflow, behind the bias, and never first.
Failures like this also hint at the next trade. A day that ignores the open and trends hard often continues the following session, so the trend that beat you can become tomorrow’s bias. Meanwhile, the fresh midnight open resets in that trend’s direction, giving you a cleaner reference to work with. Yesterday’s loss, journaled well, quietly funds today’s plan. So even a failed read leaves you with a fresh reference line and a sharper sense of where the day is truly heading next.
Related Concepts for Midnight Open Traders
Several companion reads deepen the framework. The full guide to the ICT power of three frames the whole day as accumulation, manipulation, and distribution around the open, which explains why price so often sweeps one side of the line before the real move. Then the central bank dealers range offers a second time-based reference that pairs neatly with the open, and the New York kill zone guide shows the session that most often delivers the rotation.
FAQ
What is the ICT midnight open in simple terms?
The ICT midnight open is the price at exactly 00:00 New York time, drawn as a horizontal line across the day. Price above it is premium, and price below it is discount. So the line acts as the day’s equilibrium and a reference for every intraday decision.
How do I find the midnight open on my chart?
Set your platform to New York time, then find the candle that opens at 00:00. Draw a horizontal line at that open price and extend it across the session. A daylight-saving check matters, since a wrong time zone marks the wrong candle.
Is the midnight open the same as the daily open?
Not always. Many platforms set the daily open at 17:00 New York time or at broker midnight, which can differ from 00:00 New York time. The ICT midnight open specifically uses 00:00 New York, so confirm the exact candle rather than trusting the default.
Does price always return to the midnight open?
No. Price often rotates around the open, yet on trending days it can stay in premium or discount for the whole session. So treat the open as a reference and a target, never as a level price must reach.
How do I combine the midnight open with bias?
Set the daily bias first, then use the open to locate entries. On a bullish bias, buy from discount below the open and target premium above. Thus the open answers where, while the bias answers which direction.
Does the ICT midnight open work on indices and gold?
The framework transfers to any market that trades through the New York midnight hour, including gold and index futures. Behavior still differs by instrument, though. So test the open on a demo per market before risking capital. Results are not guaranteed; past performance is not indicative of future results.
External references
- For background on this concept, see Opening Price at Investopedia.
- For broader market context, see Trading Day on Wikipedia.

About the author
Written by Dominic Walsh, a Forex trader and MT4/MT5 indicator, Expert Advisor and script developer. Every tool on forexmt4systems.com is tested on live charts before release and ships with ready-to-use compiled MT4 (.ex4) and MT5 (.ex5) files. Learn more about the trader and developer behind this site.
How we build, test and correct every tool: Editorial & Testing Policy. Trading carries risk; see the disclaimer.