
Expert advisor vs indicator is a question about roles rather than quality. One of them describes the market, and the other one acts on that description by sending orders.
Traders blur the two constantly, and the confusion costs money. So this guide separates them cleanly, then shows where each fits inside a working process.
Expert Advisor vs Indicator: The Core Difference
An indicator produces numbers and draws them. An expert advisor reads numbers and places trades.
That single sentence settles most arguments. Everything else follows from it.

The panel above puts the two roles side by side. Both columns hold the same signal, yet only one of them carries an order and a stop.
An Indicator Describes
Indicators transform price into something easier to read. A moving average smooths it, an oscillator scales it, and a level tool marks where price paused before.
None of that touches your account. The terminal draws the output, and a human decides what it means.
An indicator also has no memory of your positions. It cannot see your balance, your stops or your open risk.
An Expert Advisor Acts
A program reads conditions, then sends an instruction to the broker. Open, close, modify, or do nothing at all.
Because it sends orders, it needs permission to trade. It also needs rules for size, for stops and for the moments when it should stay out.
Our guide to what an expert advisor is covers that machinery in detail. Read it if the terminology feels new.
Why the Confusion Persists
Both arrive as files you install, both appear in the same menu, and both can display arrows on a chart. Marketing then blurs the line further by selling arrows as if they were decisions.
An arrow is not a trade. Somebody still has to size the position, place the stop and decide whether to take the signal at all.
What Only an Expert Advisor Can Do
Automation adds five capabilities. None of them involves prediction.
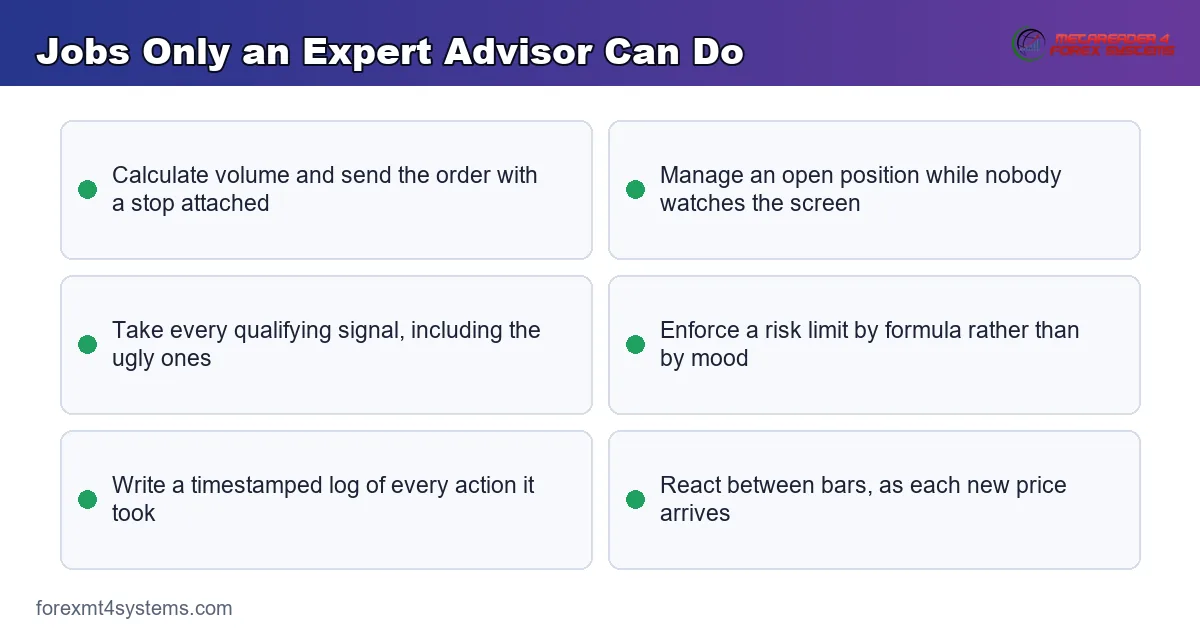
The diagram above lists them. Notice how each item concerns execution rather than analysis.
It Places the Order
The program calculates volume, sends the order and attaches a stop in one step. That sequence happens in milliseconds, at any hour.
It Manages the Position
Trailing a stop, moving to breakeven, closing part of a position: all of it runs without a human present. Manual management fails exactly when it matters most, in fast conditions.
It Never Skips a Signal
People skip valid setups after a losing run or late in a session. A program takes every signal that qualifies, which changes the record for anybody whose problem lives in execution.
It Enforces Risk Limits
Position size follows a formula rather than a mood. Our guide to expert advisor risk settings covers the inputs that do that work.
It Keeps a Complete Log
Every action lands in a file with a timestamp. Review then works from data rather than memory, and a program cannot forget the trade it would rather not discuss.
What an Indicator Does Better
The list runs shorter and matters more than people expect. Indicators keep judgement where a program cannot reach.
It Leaves the Decision With You
You see the same picture the program would see, then apply context it has no access to. A calendar event, a thin session, an instrument behaving oddly all belong to that context.
It Cannot Break Your Account
A badly written indicator draws a wrong line. A badly written program sends wrong orders, and the difference between those two mistakes is the whole account.
It Adapts Instantly
Change your mind about a level and you simply act differently. Changing a program means editing code, recompiling and retesting.
Our note on combining indicators shows how several readings fit together. That judgement stays hard to automate honestly.
A Level That Broke and Came Back
An example makes the division concrete. Here sits a range on the daily chart of the euro against the Australian dollar.

The box held for 28 bars, then price closed up out of it on 2025-10-15 but the break failed: it came back 3.0 ATR against the break within 10 bars. That single episode contains the whole distinction.
What the Indicator Showed
A range tool marks the boundaries and nothing more. It drew the box, then it drew the close above the box, and its job ended there.
No part of that output says buy. The tool described a condition, and conditions carry no instruction.
What a Program Had to Decide
A breakout program facing the same bar needs answers to five questions. How much to buy, where to put the stop, whether to wait for a retest, when to give up, and what to do if price returns inside the box.
Those answers live in the code rather than in the indicator. Two programs reading the identical line can behave in opposite ways.
Why the Failed Break Matters
Price came back hard, well past the level it had just cleared. A program with a stop beyond the box survived that with a defined loss.
One without a stop kept the position open into a much larger move. Same signal, same chart, entirely different outcome, and the difference came from execution rules rather than from analysis.
Sketch that trade before you take it with our trade risk visualizer. Seeing the stop and target on one picture tends to change the size you choose.
Indicator Output Against Program Action
Every indicator reading maps to a decision that somebody must make. The mapping is where automation lives.

The comparison above pairs each output with the action it implies. Note that the right column contains numbers the indicator never supplies.
The Gap Between the Columns
An indicator says the fast average crossed the slow one. It does not say how much to buy or when to stop trying.
That gap is the strategy. People who buy signal tools and then lose money usually never filled it in.
Filling It In Deliberately
Write the missing answers down before you automate anything. Entry trigger, position size, stop, target, maximum trades and stopping rule.
Six lines of plain English convert a drawing into a testable process. Code comes afterwards.
Download the complete indicator database
Put these concepts on your charts. One email unlocks the full library of 1,380+ indicators with compiled MT4 and MT5 files, plus my TradingView scripts. No paywall, no spam, unsubscribe any time.
Get free access to my indicator database
One email unlocks 1,380+ free MT4, MT5 and TradingView indicators — the complete library. No single-tool download; you get the whole database.
Where Each One Lives in the Terminal
The platform treats them differently, and the differences explain several common frustrations.

The panel above splits the terminal into two zones. Indicators occupy the chart window, while programs reach into the order flow.
Different Folders, Different Menus
Indicators install into the indicators folder and appear under the navigator’s indicator branch. Programs install into the experts folder and appear under experts.
Dropping a file into the wrong folder hides it completely. Half the installation questions we receive come down to exactly that.
Permissions Differ
A chart runs an indicator without any special permission. A program needs automated trading switched on at the terminal level, and often at the chart level too.
Look for the smiling face in the corner: it means the program may trade. A different expression means the file loaded and will do nothing.
One Program Per Chart
A chart accepts many indicators at once and exactly one expert advisor. Attaching a second program replaces the first without much warning.
Traders lose whole sessions to that behaviour. Check the chart corner before assuming anything ran.
They Also Run at Different Moments
An indicator recalculates when the chart needs redrawing. A program runs when a new price arrives, which is what lets it react between bars.
A Quick Way to Tell Them Apart
Two tests settle it in seconds. Neither one needs any code.
Ask What It Touches
Does the tool draw on the chart, or does it send an order? Draw means indicator. Send means program.
Nothing else matters for this test. A tool that only draws cannot lose money on its own.
Ask Where It Sits
Check the folder. Files that draw live in one place, and files that trade live in another.
Check the menu too. The navigator lists them under two branches, so the label gives the type away.
Ask What Breaks If It Fails
A broken line wastes your time. A bad order costs your balance.
That gap should shape how much you test each one. Code that trades needs far more care than code that draws.
Two Short Worked Cases
Cases make the split clear. Both start from the same chart.
The Manual Case
You see the line break. You size the trade, place the stop, then walk away.
Your judgement chose the size. Your hand placed the stop, and your log shows both.
The Automated Case
Code sees the same break at the same moment. It works out the size from the stop, sends both, then waits.
No mood entered that choice. The rule you wrote last month made it for you.
What Changed
The chart did not change. Only the hand on the order changed, and that is the whole of the difference.
How Each One Fails
Both go wrong in ways you can plan for. The two failures look nothing alike.
When a Chart Tool Fails
It draws a line you then read wrongly. Or it moves a past signal once new bars land, which flatters the chart.
You notice late, if at all. The chart looks tidy because the tool tidied it.
When a Program Fails
It keeps trading a rule that stopped working. Nothing inside it asks whether the market still fits the plan.
It can also fail loudly. A bad lot size, a missing stop or a dead link to the broker each cost money within hours.
Planning for Both
Reload the chart to test a drawing tool. If old marks move, drop it.
Give a program a hard stop rule. Pick the loss that ends the test, then write it into the code.
Cost, Setup and Upkeep
Both take work. The work simply lands in different places.
Setup
A chart tool drops onto a chart in a minute. A program needs settings, a test run and a check that it may trade.
Upkeep
Charts need almost none. Code needs a weekly look at the log, plus a check after any change at the broker.
Budget that time before you start. Ten minutes a week keeps a program honest, and skipping it costs far more later on.
Machines
A chart tool runs when you look at it. A program has to stay live, so many traders rent a server for it.
Reading a Product Page Without Guessing
Sellers blur the two on purpose. Three lines on the page usually give the type away.
Look for the Word Order
If the page never says the tool sends orders, it draws. Pages that trade say so plainly, because they have to.
Look for Risk Inputs
Risk percent, lot size, daily loss and stop distance belong to code that trades. A drawing tool has no use for them.
Look for the Install Folder
Instructions name the folder. That one line tells you the type before you read anything else.
Ask if the page stays vague. A seller who cannot answer that question has told you enough.
Turning an Indicator Into an Expert Advisor
This step tempts everybody who finds a tool they like. It works, provided you accept what the conversion actually requires.
The Signal Is the Easy Part
Reading an indicator’s value from inside a program takes a few lines. Everything after that reading takes considerably longer.
Repainting Ruins Conversions
Some indicators redraw earlier signals once later bars arrive. On a chart that looks harmless, and inside a program it produces trades the history never contained.
Test on completed bars only. If the signal disappears when you reload the chart, no program can trade it reliably.
The Missing Rules Cost the Most
Sizing, stops, session filters, maximum exposure and a stopping rule all have to be invented. None of them existed in the drawing.
Our overview of algorithmic trading in forex covers that pipeline end to end. The signal occupies one stage out of five.
Then Test It Honestly
Run the program on data the indicator settings never met. A rule tuned by eye on recent charts usually behaves differently on an earlier stretch.
Alerts Sit Between the Two
A third option exists, and it suits more traders than either extreme.
What an Alert Adds
An indicator with alerts watches for you and tells you when its condition appears. You then decide, size and execute by hand.
That combination removes the screen time without removing judgement. For discretionary traders it often beats full automation.
What It Still Costs
Delay creeps in between the alert and your fill. On slow strategies that costs little, and on fast ones it can remove the entire idea.
Keeping the Record
Alerts leave no automatic log of what you did next. Record the outcome yourself with our trade journal, otherwise the review has nothing to work from.
Which One Should You Use
The answer depends on where your difficulty actually sits. Three honest cases cover most traders.
Your Analysis Works and Your Execution Does Not
Automation helps here. If you routinely skip valid signals or move stops under pressure, a program removes the failure point.
You Have No Written Rule Yet
Indicators and alerts serve you better for now. Automating a process you have never executed by hand simply produces mistakes faster.
Trade the rules manually for a few dozen occurrences first. You then know what the log should look like.
You Trade Slowly and Rarely
A swing trader checking charts once a day gains little from automation. Alerts plus a checklist deliver most of the benefit at a fraction of the effort.
Browse our indicator library for tools that support that workflow. Treat every one of them as raw material rather than as an answer.
Misconceptions Worth Clearing Up
Five beliefs cause most of the trouble. Each one has a short correction.
An Expert Advisor Is Not a Better Indicator
It reads the same information you do. Automation changes who acts, never what the market shows.
An Indicator Cannot Trade by Itself
Arrows and alerts still need a person or a program to convert them into orders. Nothing about an arrow reaches the broker.
Neither One Predicts
Both work from the same historical prices. Wrapping a calculation in code adds speed and consistency, not foresight.
More Indicators Do Not Mean More Certainty
Six tools reading the same price series mostly repeat each other. Agreement between them feels like confirmation while adding very little information.
Automation Does Not Remove Work
Somebody has to read the log, watch for broker changes and notice a stalled terminal. The work moves rather than disappears.
Running Both Together
Most serious setups use each for what it does well. Three patterns work reliably.
Indicators for Context, Programs for Execution
Read the higher timeframe yourself, then let a program handle entries in the direction you allow. The human sets the regime, the code handles the repetition.
A Program With a Manual Switch
Keep an input that blocks new entries. Before a major release, switch it on, and let existing positions run under their normal rules.
Indicators for Review
Load the same tools onto a chart after the fact, then compare what the code did against what you would have done. Disagreements point straight at the rule that needs work.
The pillar guide to MT4 indicators covers the tool side of that pairing. Programs then read whatever those tools produce.
What Neither One Can Give You
Both sit on the same side of an important limit. Saying so plainly saves years.
Neither tells you where price goes next. Both compute from bars that already printed, and no arrangement of past bars settles the future.
Neither removes the need for a decision about size. That number decides survival, and it lives outside both tools.
Neither survives a market that changes character. An indicator keeps drawing and a program keeps trading, because nothing inside either one measures whether the conditions still fit.
What both can do looks smaller and helps enormously. They make a process visible, repeatable and reviewable, which is the only ground on which anybody improves.
FAQ
Can an indicator place trades on its own?
No. An indicator computes values and draws them, and nothing in that process reaches the broker. Some indicators send alerts, though an alert only tells you a condition appeared; a person or an expert advisor still has to size the position and send the order.
Is an expert advisor better than an indicator?
Neither ranks above the other, because they solve different problems. An indicator helps you see a condition, while a program removes hesitation and enforces rules you already wrote. If you have no written rule yet, automation simply produces your existing mistakes at greater speed.
Can I convert an indicator into an expert advisor?
Often, and the signal is the easy part. The difficult work involves inventing everything the indicator never supplied: position size, stop placement, session filters, maximum exposure and a rule for switching the whole thing off. Check first that the indicator does not repaint, since a signal that redraws after the fact cannot be traded honestly.
Why does my expert advisor show a signal but never trade?
Usually a permission or an installation problem rather than a logic fault. Automated trading has to be enabled at the terminal, the chart has to show the program as active, and only one program may run per chart. Check the terminal log as well, since rejected orders and invalid stop distances appear there first.
Which one should a beginner start with?
Start with indicators and manual execution, then add alerts once you know which conditions you actually wait for. Trade your rule by hand for several dozen occurrences, keep an honest log, and only automate once the log shows a process worth repeating. Automation rewards traders whose difficulty lies in execution, and it magnifies the problem for traders whose rule was never clear. Results are not guaranteed; past performance is not indicative of future results.
External references
- For background on this concept, see Custom Indicators in the MQL5 Documentation.
- For broader market context, see Technical Indicator in the BabyPips Forexpedia.

About the author
Written by Dominic Walsh, a Forex trader and MT4/MT5 indicator, Expert Advisor and script developer. Every tool on forexmt4systems.com is tested on live charts before release and ships with ready-to-use compiled MT4 (.ex4) and MT5 (.ex5) files. Learn more about the trader and developer behind this site.
How we build, test and correct every tool: Editorial & Testing Policy. Trading carries risk; see the disclaimer.