
Learning how to backtest a trading strategy takes an afternoon. Learning to read the result honestly takes rather longer, and that second part decides whether the work helps you.
A test tells you how a fixed rule would have behaved on one stretch of history, under assumptions you picked. So treat the output as evidence about the past, never as a forecast.
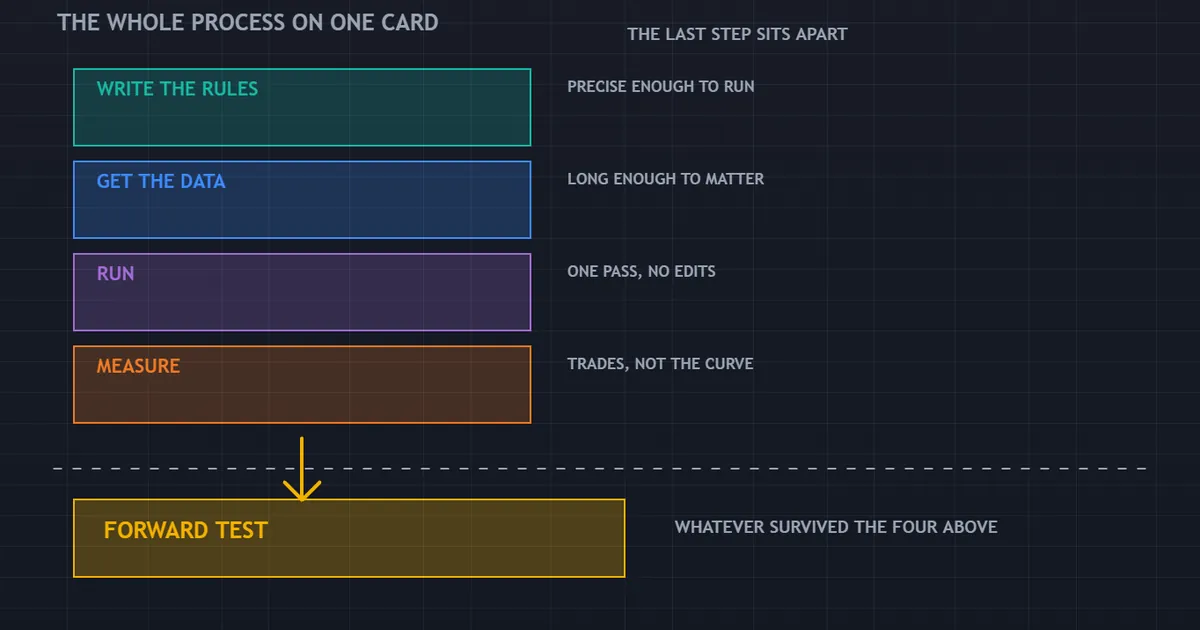
How to Backtest a Trading Strategy in Five Steps
The panel above lays out the whole process. Write the rules, get the data, run the test, measure the result, then forward test what survives.
Most people skip straight to running. That order is exactly backwards, because a rule you have not written down cannot be tested at all.
Step One: Write the Rules Down
A backtest needs a rule with no gaps in it. Vague instructions produce results that change every time you run them.
Entry, Exit and Size
State the entry condition in a sentence a stranger could follow. Then do the same for the stop, the target and the position size.
Every rule needs a value, not an adjective. Near the moving average means nothing, while within ten pips of the moving average means something.
Remove Every Judgement Call
Phrases like if the trend looks strong hide a decision. Replace each one with a measurement you could code.
Our guide to building a written trading plan covers the same discipline for discretionary work. A test simply forces the issue earlier.
Write Down What Would Disprove It
Decide in advance what result would make you drop the idea. Perhaps a drawdown past a certain depth, or a flat year.
Write that line before the first run. Otherwise every poor result turns into a reason to change a setting.
Step Two: Get Data You Can Trust
Data quality sets the ceiling for everything that follows. A perfect method on broken history still produces nonsense.
Where the History Comes From
The MT4 terminal downloads history from your broker’s server. That history is one broker’s record, complete with its own quotes, gaps and holiday handling.
Two brokers can therefore hand you two different results on the same rule. Neither one is wrong, and neither one is the market.
Mismatched Chart Errors
The tester report shows a line for mismatched charts errors. That figure counts holes in the history, so it describes your data rather than your strategy.
A large number there invalidates the run. Fix the history first, then test again.
Importing Better Data
Third-party tools import real tick data into the tester. That route lifts the modelling quality figure, and it takes genuine effort to set up.
Our explainer on what backtesting is covers why the extra precision matters for short-term rules. For a swing rule on daily bars, the gain is small.
Depth Beats Nothing
Short samples flatter almost any rule. Cover several market conditions instead: a trending stretch, a quiet range and at least one shock.
Very old data brings its own problem, since spreads, speed and participants have all changed. Weight the recent years more heavily.
Step Three: Run the Test
The MT4 Strategy Tester offers three modelling options. The choice changes the result far more than most traders expect.
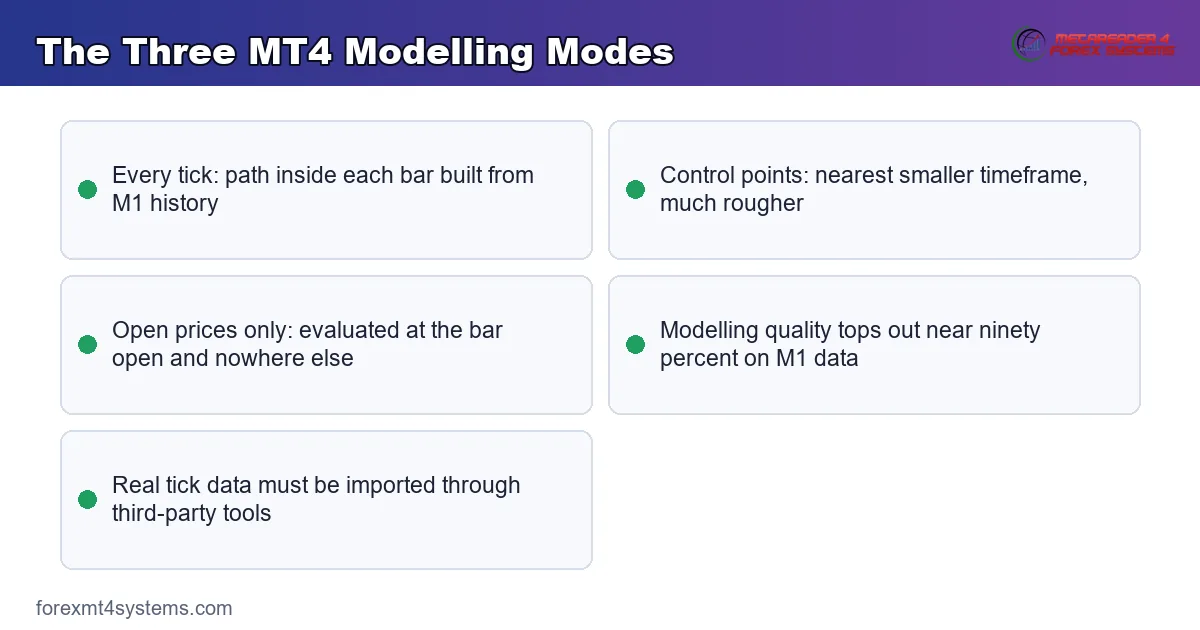
Every Tick
This mode is the most precise of the three. MT4 builds tick movement inside each bar from M1 history, unless you have imported real tick data yourself.
It runs slowly, and it remains the only sensible choice for a rule that acts inside a bar. Our walkthrough of the MT4 Strategy Tester covers the settings screen in detail.
Control Points
Control points uses the nearest smaller timeframe to approximate the path within each bar. It runs faster and much rougher, so treat its output as a sketch.
Open Prices Only
The fastest mode evaluates your rule at the open of each bar and nowhere else. For any rule that reacts intrabar, the output means nothing at all.
It suits a bar-close system tested for obvious errors. Use it to check that the code runs, then switch modes for the real work.
Modelling Quality
The report prints a modelling quality percentage. Around ninety percent is the practical ceiling using MT4’s own M1 history on every tick mode.
It reads not applicable for open prices only. The higher figures people quote in adverts come from imported real tick data through third-party tools.
The Spread Setting
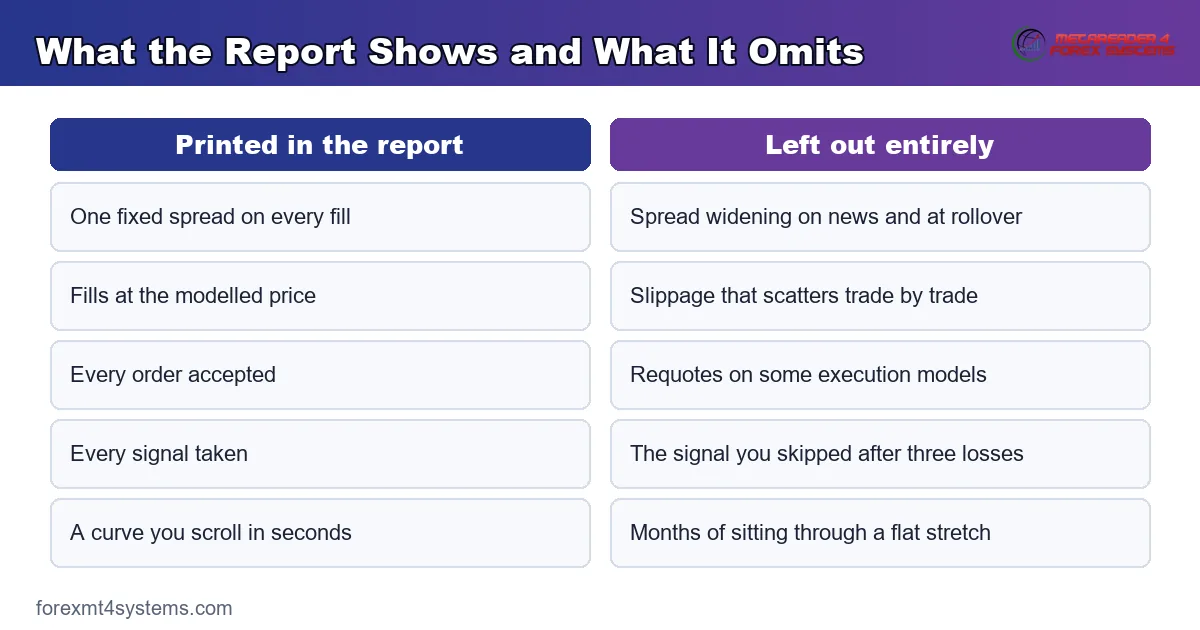
The tester applies a fixed spread unless you configure it otherwise. Real spread widens on news and around the daily rollover, so a test understates cost exactly when cost matters.
Raise the modelled spread and run again. If the result collapses, the edge lived inside an assumption rather than in the market.
Step Four: Measure What Actually Matters
Net profit is the least useful number in the report. Four other figures tell you far more.
Expectancy Per Trade
Expectancy combines how often it wins with the size of the average win and average loss. One number then describes what a single trade is worth on average.
Work yours out with our expectancy calculator. A rule with a positive figure before costs can still fail once spread arrives.
Maximum Drawdown
Drawdown measures the deepest fall from a peak. It describes the experience of holding the rule, which decides whether you keep going.
Model it against your own balance using our drawdown calculator. Then double the figure and ask the question again.
Trade Count
Thirty trades tell you almost nothing. Several hundred start to separate a pattern from a run of luck.
Our note on backtest sample size covers where the line sits. Small samples produce confident numbers and no information.
The Worst Losing Run
Count the longest streak of losses in the trade list. That streak, not the equity curve, is what ends most experiments.
One Window, Two Resolutions
Resolution changes what a test can even see. The two charts here show a single window on EURUSD, viewed twice.
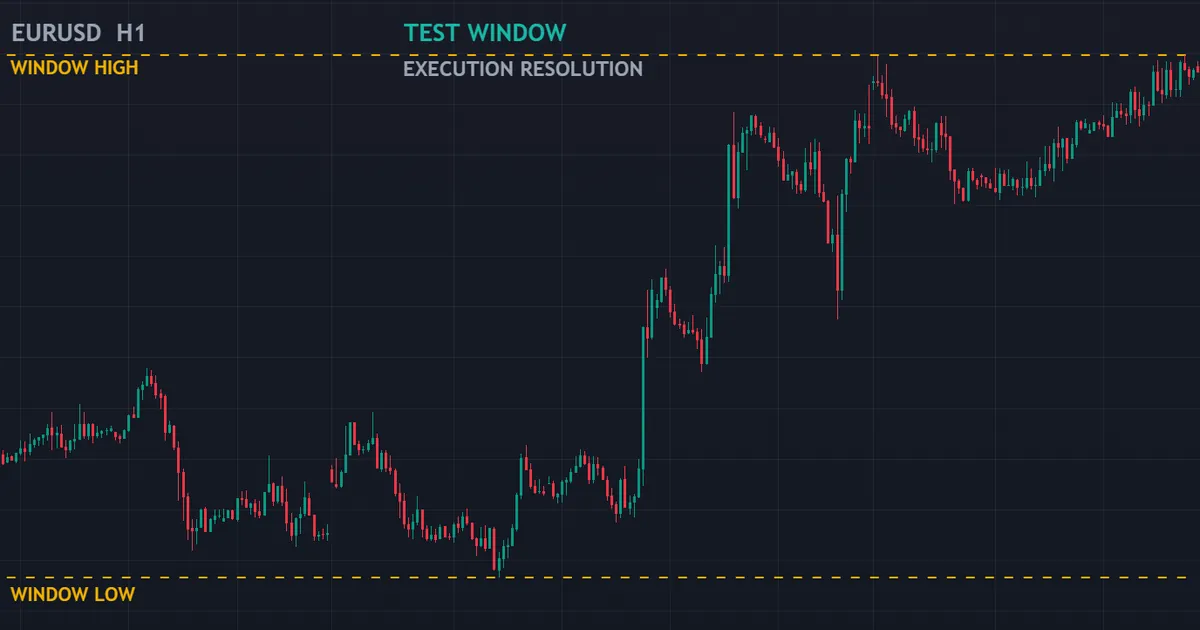
The Hourly View
The hourly chart shows the bars a rule would actually execute on. Entries, stops and exits all resolve at this level.
Within each of those bars sits movement the model never priced. A stop can sit untouched on the hourly chart and still have traded during the hour.
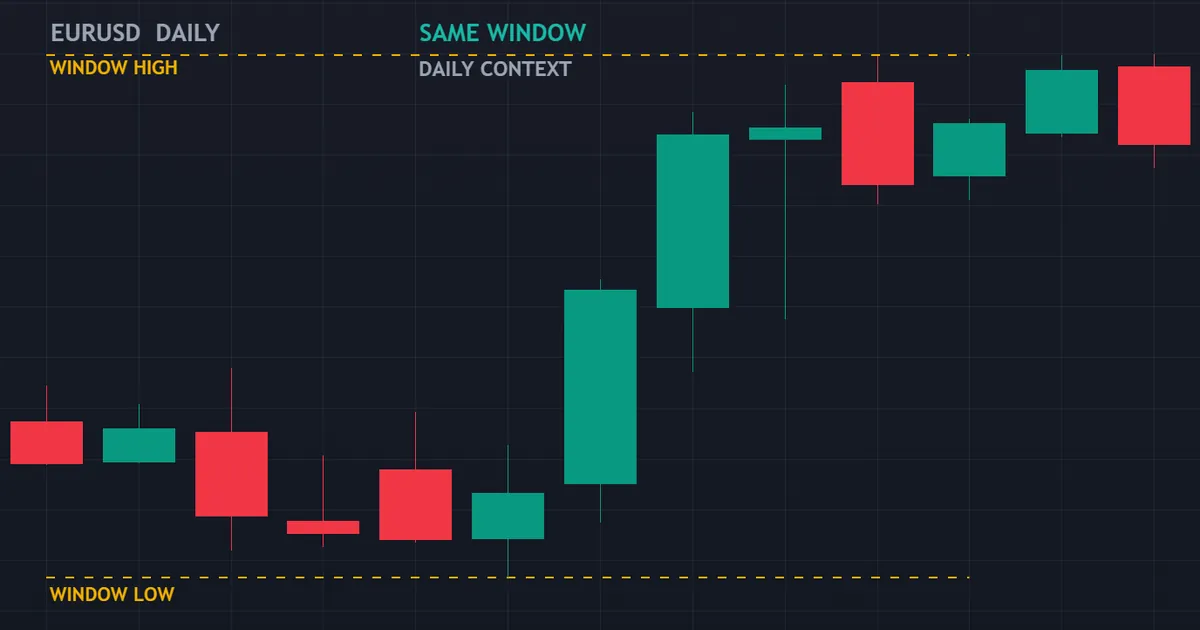
The Same Window, Seen From Above
The daily chart covers exactly the same dates as the hourly chart above it. Nothing changed except the resolution.
Context appears at this level and disappears at the other. A rule that trades every hourly signal cannot see the daily structure it sits inside.
Why That Pair Matters for Testing
Test at the resolution your rule trades on, then look at the window from higher up. The second view often explains a losing stretch that the first view makes look random.
Our guide to multi-timeframe analysis covers the reading habit. Backtesting simply makes the blind spot measurable.
Step Five: Forward Test What Survives
A surviving rule has earned one thing: a look at data it has never met. That step catches most of what history hides.
Out of Sample First
Hold back a stretch of history from the start. Run the finished settings on that stretch once, and accept the answer.
Rerunning until the held-back period agrees defeats the purpose. Our page on curve fitting explains how quickly that habit destroys a result.
Then Demo, Then Small
Run the rule forward on live prices next. Demo exposes session errors, symbol errors and platform behaviour that history cannot show.
After that, trade the smallest size your broker allows. Real fills carry information no simulation contains.
What a Backtest Can Never Contain
Four things sit permanently outside any historical test. Each one costs money in live trading.
- Slippage variation. A test applies a rule about fills. Live fills scatter around your price, and they scatter most in fast markets.
- Requotes. Some execution models return a new price instead of filling. That delay changes the trade, and no report models it.
- A widening spread. The tester holds spread fixed by default, while real spread expands around releases and at the rollover.
- Your own hesitation. Nobody skips a signal in a backtest. Everybody skips one in live trading, usually after three losses.
Read our note on slippage in trading for the mechanics of the first two. Both grow exactly when your rule is most active.
A Backtest Can Only Disprove
Here sits the honest core of the whole exercise. A test can kill an idea, and it cannot confirm one.
Why Disproof Works
A rule that loses money across years of history has failed a fair examination. That verdict is reliable, because the conditions genuinely happened.
So the main value of testing is elimination. You discard ideas cheaply, before they cost real money.
Why Proof Does Not
A rule that made money on history has passed one examination on one sample. The market never promised to repeat that sample.
Confidence grows slowly through unseen data and live results. It never arrives from a single report, however good the curve looks.
What to Say About a Good Result
Describe it as not yet disproved. That phrasing sounds pedantic, and it keeps your position sizing sensible.
It also changes how you react to a losing month. A rule you never called proven needs no rescue when it stumbles.
The Practical Consequence
Size the first live trades as though the edge might not exist. Then let the live log, not the report, decide when size grows.
Download the complete indicator database
Put these concepts on your charts. One email unlocks the full library of 1,380+ indicators with compiled MT4 and MT5 files, plus my TradingView scripts. No paywall, no spam, unsubscribe any time.
Get free access to my indicator database
One email unlocks 1,380+ free MT4, MT5 and TradingView indicators — the complete library. No single-tool download; you get the whole database.
Testing an Indicator Rule and Testing a Robot
The tester runs a program, not an indicator. That distinction trips up plenty of first attempts.
Indicators Draw, Programs Decide
An indicator plots values on a chart. It places no orders, so the tester has nothing to simulate.
To test an indicator rule you need a small program that reads it and acts. Otherwise step through the chart by hand and log each signal yourself.
Repainting Ruins Both Routes
Some indicators redraw earlier signals once later bars arrive. History then shows arrows in places nobody could have traded.
Check that behaviour on live bars before you build anything on top of it. A repainting signal produces a beautiful report and no edge.
One Rule at a Time
Test the signal alone before adding filters. Each filter you bolt on afterwards should earn its place on data the rule has not seen.
Optimisation, and When to Stop
Sweeping settings is legitimate research. It turns into self-deception at a point most traders sail straight past.
Look at the Neighbours
Run the sweep, then examine the settings either side of the best one. A broad patch of decent results suggests something real.
A lonely spike with poor neighbours suggests an accident inside that sample. Prefer the middle of a plateau to the top of a peak.
Count Your Passes
Every pass over the same data spends some of its information. After enough passes, the result describes the sample rather than the market.
Roll the Windows Instead
One method fixes part of this. Optimise on one window, test on the next, then step both windows forward and repeat.
Our guide to walk forward analysis sets out the procedure. It costs more time and produces a far more honest number.
Record the Test So You Can Repeat It
A result you cannot reproduce is not a result. Note six things at the moment of the run.
- Symbol and feed. Write the exact symbol name and which broker’s history supplied the bars.
- Date range. Start and end dates, plus any period you deliberately held back.
- Modelling mode and quality. Both figures appear at the top of the report, so copy them across.
- Costs modelled. The spread setting, the commission and the swap treatment all belong here.
- Every input value. A screenshot of the inputs tab takes two seconds and settles later arguments.
- The code version. Keep a dated copy of the file that produced the run.
Save the report itself beside those notes. Six months later, that folder separates evidence from a vague memory.
Backtesting by Hand
Not every rule needs code. Manual testing suits discretionary methods, and it teaches more than an automated run.
Bar Replay
Step through history one bar at a time with the future hidden. Log each decision as you make it, before the next bar prints.
Speed is the enemy here. Scrolling forward to check an outcome quietly turns the test into a memory exercise.
Keep the Log Honest
Record the entry, the stop, the exit and the reason. Then record the trades you decided to skip.
Our guide to keeping a trading journal applies directly. A manual test is a journal of trades that never happened.
How Many Occurrences
Aim for at least one hundred manual trades before you judge anything. Fewer than that produces an opinion rather than evidence.
When the Live Log Disagrees With the Test
Sooner or later those two records diverge. Work through the causes in order, rather than blaming the market first.
Check the Fills
Compare requested price against filled price across your live trades. A consistent gap points at slippage or at the execution model, not at the rule.
Check the Spread You Paid
Pull the spread at the moment of each entry. Rules that fire around news pay far more than any fixed setting assumed.
Check Whether You Followed It
Count the signals you skipped and the trades you closed early. That number explains more divergence than most traders care to admit.
Then Suspect the Rule
Only after those three checks does the strategy itself become the suspect. Even then, a losing stretch inside the tested range proves nothing by itself.
A Checklist Before You Trust a Result
Run through this list before any rule sees real money. It takes minutes and saves months.
| Check | What good looks like | Warning sign |
|---|---|---|
| Were the rules fixed first? | Written down, then tested once | Settings changed after each run |
| Which modelling mode ran? | Every tick for intrabar rules | Open prices only on a stop-and-target rule |
| What modelling quality printed? | Around ninety percent on M1 history | A low figure, or a page of mismatched chart errors |
| What spread was modelled? | At least the typical live spread | A single tight figure applied everywhere |
| How many trades? | Several hundred across conditions | Twenty trades in one calm year |
| Did unseen data agree? | Similar behaviour on a held-back stretch | Only one run exists, on everything |
| How deep was the worst fall? | A drawdown you could sit through | The report never mentions it |
Any single warning sign is enough to pause. Two of them together usually means starting over.
Mistakes That Ruin Otherwise Good Work
Four habits appear again and again. Each one is easy to avoid once named.
Tuning Until It Looks Right
Every extra pass over the same data costs credibility. The best-looking settings usually describe the noise in that particular sample.
Testing on the Wrong Symbol
Symbol names and specifications differ between brokers. A test on one feed can misprice pip value, swap or contract size on another.
Ignoring Costs Entirely
Commission and swap belong in the model, not in a footnote. A rule that only survives at zero cost was never viable.
Reading the Curve First
Open the trade list before the equity graph. Trade count, holding time and losing streaks describe behaviour, while the curve only summarises it.
Where the Result Should Take You Next
A finished test points somewhere. Three outcomes cover almost every case.
Disproved
The rule lost across fair conditions, so drop it and move on. That outcome is a success, because it cost you nothing but time.
Fragile
Results swing wildly when settings move a little. Treat neighbouring values as part of the test, since a lonely peak rarely survives contact with new data.
Worth Forward Testing
Behaviour held up on unseen history, with a drawdown you could tolerate. Move to demo, then to minimum size, and keep the log running.
Browse our MT4 indicator library when you need the building blocks. Tools supply signals, and the testing discipline supplies the judgement.
FAQ
How much history should a backtest cover?
Enough to include several market conditions rather than a fixed number of years. A trending stretch, a quiet range and at least one shock give you a fair examination. Trade count matters more than calendar length, so a busy rule needs less history than a slow one.
Which MT4 modelling mode should I use?
Use every tick for anything that reacts inside a bar, since it models the path through each bar from M1 data. Control points runs faster and much rougher, and open prices only evaluates at the bar open, which makes it useless for intrabar rules. Match the mode to when your rule actually acts.
What does modelling quality actually measure?
It reports how well the tester could reconstruct price movement inside each bar from the data available. Around ninety percent is the practical ceiling on MT4’s own M1 history, and it prints as not applicable for open prices only. Higher figures come from imported real tick data rather than from a better strategy.
Does a profitable backtest mean the strategy works?
No, and that limit is structural rather than pessimistic. A test can disprove a rule by showing it failed under conditions that genuinely happened, while a good result only means the rule has not been disproved on that sample. Confidence comes from unseen data and live records instead.
Why did my live results differ from the test?
Four causes explain most of the gap: slippage that varies trade by trade, requotes on some execution models, spread that widens exactly when your rule fires, and your own decision to skip a signal. None of them appears in a historical report. Each one is small, and together they close many thin edges.
Should I test one pair or several?
Start with the symbol the rule was designed around, then run the identical settings on two or three others. A rule that works on one symbol alone may still be sound, though it more often signals a fitted result. Treat the extra symbols as a robustness check rather than permission to trade them all.
Can I trust a backtest somebody else ran?
Only with the settings attached, which means the symbol, the date range, the modelling mode, the modelled spread and the full trade list. Without those, a curve is a picture rather than evidence, and it cannot be checked. Ask for the inputs before you form any view. Results are not guaranteed; past performance is not indicative of future results.
External references
- For background on this concept, see Custom Symbols in the MQL5 Documentation.
- For broader market context, see Backtesting and Walk-Forward Testing at Investopedia.

About the author
Written by Dominic Walsh, a Forex trader and MT4/MT5 indicator, Expert Advisor and script developer. Every tool on forexmt4systems.com is tested on live charts before release and ships with ready-to-use compiled MT4 (.ex4) and MT5 (.ex5) files. Learn more about the trader and developer behind this site.
How we build, test and correct every tool: Editorial & Testing Policy. Trading carries risk; see the disclaimer.