
You click buy at one price. The confirmation comes back at another, and the difference lands in your account as real money.
So what is slippage in trading? It is the gap between the price you asked for and the price you actually received, and it runs in both directions.
What Is Slippage in Trading?
Slippage means the difference between the expected price of an order and the price at which it fills. That definition holds across every market, not only forex.
Price moves during the short window between your request leaving the terminal and a counterparty accepting it. Move it does, and your fill lands somewhere other than the quote on your screen.
Nothing in that description implies wrongdoing. It describes ordinary mechanics in a market where quotes update many times per second.
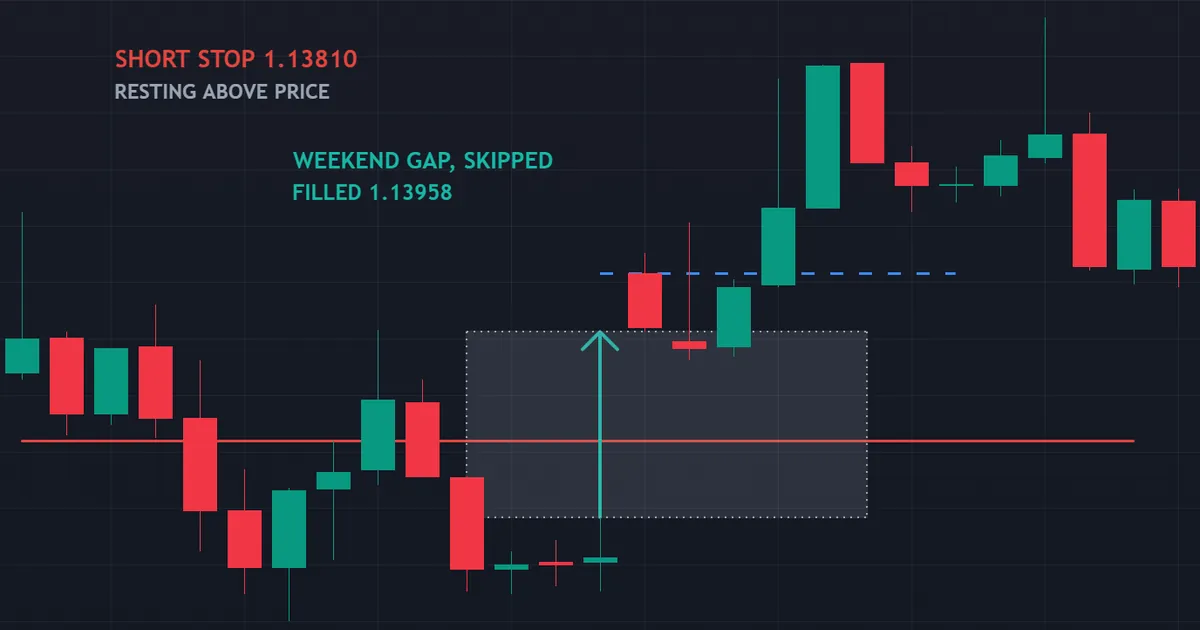
Above sits one of the cleanest recent cases. EURUSD hourly bars reopened after the weekend of 26 July 2026 with an upward gap of 0.00164, roughly 1.63 times the average true range of an hourly bar, and the first print of the new week arrived at 1.13958.
Why That Gap Cost a Short Position
Picture a short trade carrying a protective stop at 1.13810. That level sat neatly inside the hole, because Friday’s last hour topped out at 1.13742 and Sunday’s first bar never traded below 1.13906.
No trading happened in between, so nothing could fill at 1.13810. The stop turned into a market order and met the first available price, roughly 14.8 pips worse than the level chosen.
Note which side took the pain. An upward gap punishes shorts, while a downward gap punishes longs, and the same mechanism serves both.
Positive Slippage Belongs to the Same Mechanism
Traders remember bad fills and forget good ones. Yet the process that fills you worse can equally fill you better.
When price ticks in your favour inside that window, you collect a price improvement instead. Brokers who publish execution statistics report both directions, and the split rarely runs one way.
Treat slippage as two-sided variance around your intended price. Assuming it always works against you produces the wrong conclusions about your broker and about your own results.
Why the Word Carries a Bad Reputation
A negative fill stings more than a positive fill pleases. That asymmetry shapes how traders talk about execution, and it colours nearly every forum thread on the subject.
A genuine minority of cases does involve poor execution quality. Telling the two apart matters, so the rest of this guide hands you the tests.
Our guide to forex trading costs puts slippage alongside spread, commission and swap, which is exactly where it belongs in your accounting.
How an Order Turns Into a Fill
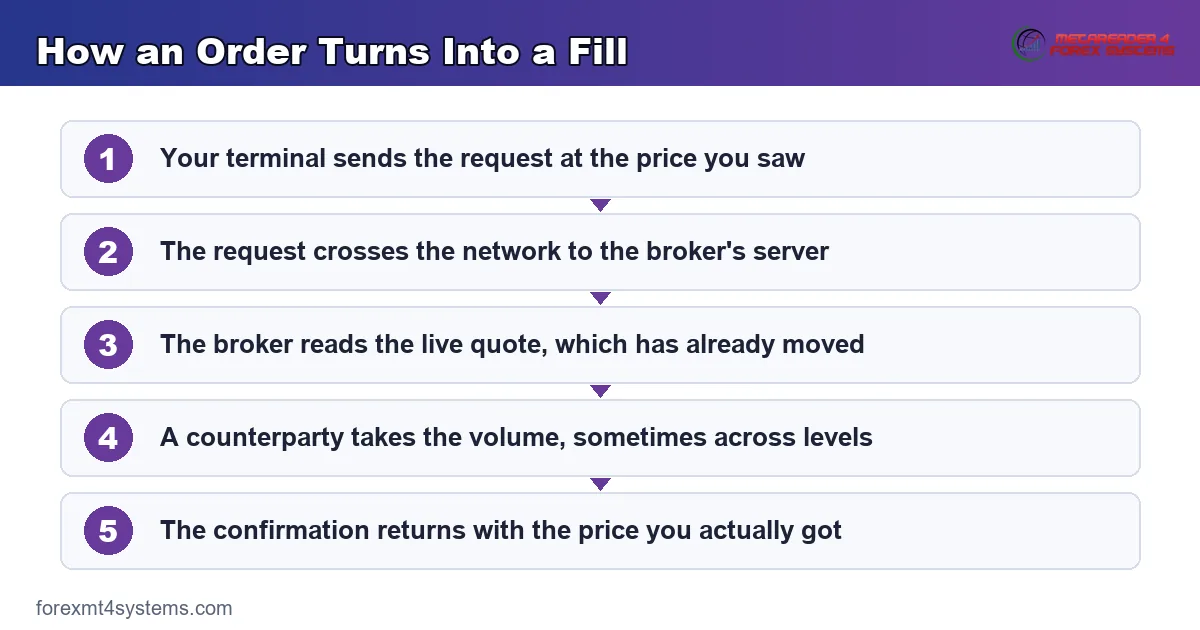
Five things occur between your click and your confirmation. Each adds a little time, and time is where the price change lives.
- Your terminal sends the request. It carries the instrument, the direction, the volume and the price you saw.
- The request crosses the network. Distance to the broker’s server and the quality of your connection both add milliseconds.
- The broker reads the live quote. Liquidity providers stream prices continuously, so the quote has usually moved on already.
- A counterparty takes the volume. Larger orders may need more than one price level before they fill completely.
- The confirmation comes back. Your platform now shows the price the market actually gave you.
Nothing in that chain is unusual. Every venue in every market works roughly this way, from share exchanges to futures markets to the interbank quotes behind your platform.
Where the Delay Lives
Most of the round trip goes on network time plus broker processing. Retail platforms typically measure it in tens or hundreds of milliseconds.
That sounds trivial until a market travels several pips inside one second. In the seconds after a major scheduled release, quotes can update dozens of times.
Latency by itself creates no slippage. It creates the window in which price can change, and volatility supplies the change.
The Three Conditions That Produce It
Slippage needs a reason. Three conditions cover almost every case you will meet at a retail desk.
Condition One: Thin Liquidity
Every quote rests on somebody willing to take the other side. Remove those participants and the next available price sits further away.
Liquidity thins at predictable moments: the Sunday reopen, the hour around daily rollover, public holidays in the major centres. Our guide to why spreads widen covers the same clock from the spread side.
Exotic pairs run thin all day. The quoted spread tells you part of the story, and the depth sitting behind it tells you the rest.
Condition Two: Fast Movement
Speed does the damage that latency merely permits. A market travelling twenty pips in five seconds will move measurably inside a round trip of a hundred milliseconds.
Scheduled releases produce the fastest bursts. Unscheduled headlines produce worse ones, because nobody had a chance to widen quotes in advance.
Volatility and slippage therefore travel together. Any period that widens your spread will usually widen your fill difference as well.
Condition Three: Size Against Available Depth
A small order takes the top of the book and stops there. A large order eats through several levels, and the average fill price drifts away from the first one.
Retail sizes rarely trigger this on major pairs. On exotics, on accounts trading oversized lots, and during holiday sessions, it starts to matter a great deal.
A Fast Session, Measured
Numbers beat adjectives here. The chart below shows what a genuinely fast session looks like on a single daily bar.
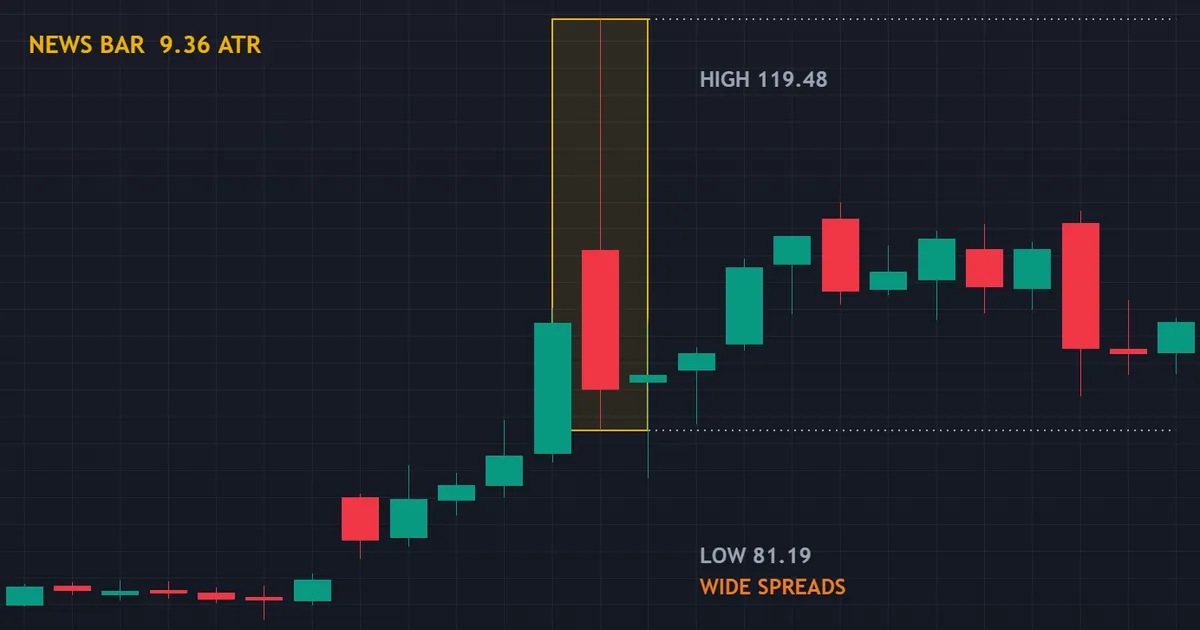
This is USOIL daily bars on 8 March 2026, a news-driven session. The bar opened at 98.00, spiked to 119.48, collapsed to 81.19 and closed at 85.07, covering 9.36 times its own average true range, with only about 34 percent of that range inside the body.
What the Bar Shows
A body filling barely a third of a huge range means violent two-way travel. Buyers took control first, sellers took it back, and neither side held the level for long.
Sessions like that produce the worst fills of the year. Quotes widen, depth vanishes for seconds at a time, and every resting stop in the region converts to a market order at once.
Afterwards the market turned back up. The next five sessions recovered about 2.24 average ranges from that close. Anyone stopped out near the low watched price return without them.
What a Stop Would Have Met
Consider a protective stop placed anywhere inside that daily range. The instant price touched it, the order became a market order.
Whether it filled near the chosen level depends entirely on what sat in the book that second. On a bar of this speed, several points of difference would surprise nobody.
None of this argues against stops. Our guide on how to use a stop loss explains why an imperfect exit still beats an open-ended one.
Which Orders Are Exposed and Which Are Not
Order type decides your exposure. Two families behave in opposite ways.
Market Orders and Stop Orders
A market order takes whatever price the market currently offers. Filling is likely; the price is not fixed.
A stop order behaves identically once touched, because touching the level converts it into a market order. Every protective stop you place carries that property, which surprises traders more than it should.
Our companion guide to the market order works through the trade-off in more detail.
Limit Orders
A limit order fills at your price or better, never worse. Price control comes as standard.
The cost sits elsewhere: the order may never fill at all. Price can reach your level, take the orders queued ahead of yours, then leave without you.
So the choice is not between a good order type and a bad one. You simply choose which uncertainty you prefer, uncertain price or uncertain participation.
Entry Slippage Versus Exit Slippage
The two are not the same problem. One you choose, and the other chooses you.
On the Way In
Entry slippage stays optional. You pick the moment, so you can wait for a calmer one.
Nobody forces you to buy in the first seconds of a release. Skipping that window costs you nothing but patience.
A worse entry price also shifts every number that follows. Your stop distance grows, your target sits further away, and your risk per lot climbs with it.
On the Way Out
Exit slippage rarely waits for permission. A stop triggers when price says so, not when you feel ready.
That makes the exit the harder half. You control where the level sits, yet nothing about the fill itself.
Both charts in this guide show that plainly. The stop level was sensible; the market simply never traded there.
Why the Exit Matters More
Entry slippage costs a little on every trade. Exit slippage costs a lot on a few trades, and those few shape your worst months.
Budget for it where it hurts, then. A stop wide enough to survive normal noise also tends to fill closer to plan.
Small and frequent is easier to absorb than rare and huge. Plan around the rare case anyway.
Building a Slippage Budget
A budget turns a vague worry into a number. Three lines cover it.
Line One: Your Normal Figure
Take the average fill difference from your own records. On major pairs in liquid hours, that figure usually stays small.
Add it to every trade in your expectancy maths. Small numbers matter once you multiply them across hundreds of trades.
Line Two: Your Event Figure
Now take the average from your release and reopen trades. That second number will look very different.
Apply it only to positions you hold through those windows. Anything closed beforehand escapes the charge entirely.
Line Three: Your Tail Figure
Finally, note the worst single fill in your records. Treat it as the size of hole a weekend can open.
Then check that one such event would not damage the account badly. If it would, your size is the thing to change.
How to Measure Your Own Slippage
Opinions about execution multiply because almost nobody measures. Three habits fix that in a fortnight.
Record the Quote and the Fill
Write down the price on screen when you clicked, then the price on the confirmation. The difference in pips is your figure for that trade.
Do this for every entry and every exit. Twenty trades already tell you something; fifty tell you rather more.
Separate the Conditions
Tag each trade with the session and whether a release sat nearby. Calm London hours and the first minute of a release belong in different buckets.
Mixing them hides the pattern. Once separated, most traders discover their problem lives in one bucket rather than across the board.
Read the Distribution, Not the Worst Case
One shocking fill proves nothing on its own. Look at the average, look at the spread of outcomes, and check whether positive fills appear at all.
An execution stream with no positive slippage whatsoever deserves questions. A stream that averages near zero with occasional tails on both sides looks entirely normal.
Download the complete indicator database
Put these concepts on your charts. One email unlocks the full library of 1,380+ indicators with compiled MT4 and MT5 files, plus my TradingView scripts. No paywall, no spam, unsubscribe any time.
Get free access to my indicator database
One email unlocks 1,380+ free MT4, MT5 and TradingView indicators — the complete library. No single-tool download; you get the whole database.
Common Mistakes and the Fixes
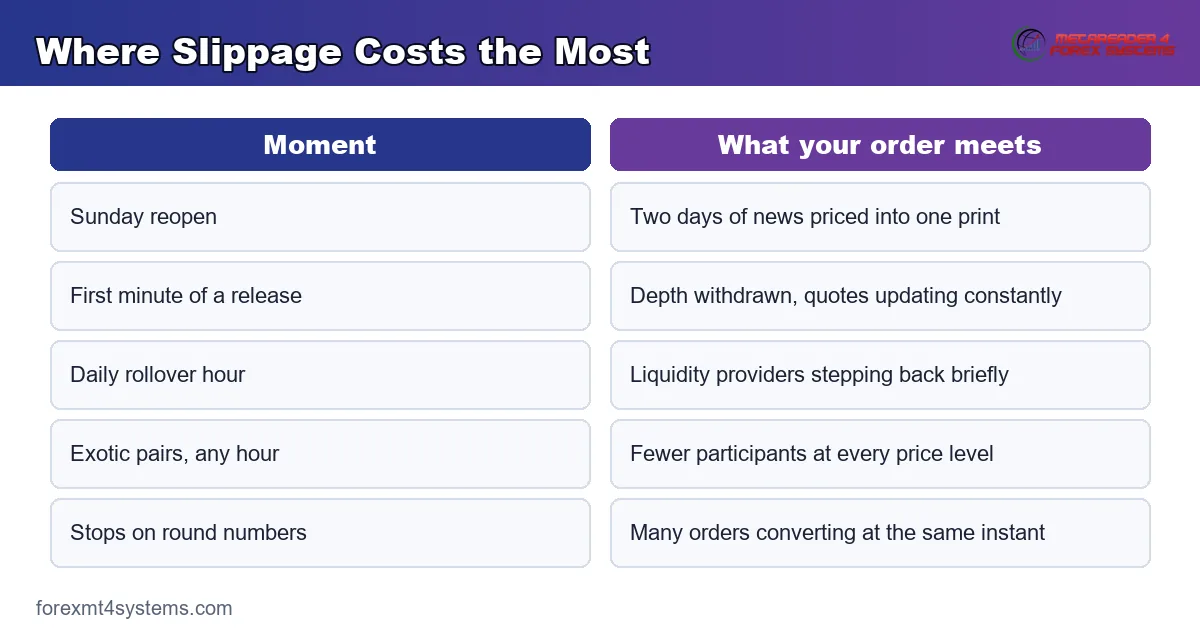
Five habits turn ordinary slippage into an expensive recurring problem. The panel below sets out where it bites hardest.
Treating Every Bad Fill as Misconduct
Complaining before measuring wastes energy. Log your fills against the quote you saw, then judge the distribution across fifty trades rather than one.
Leaving Positive Fills Out of the Record
Counting only the bad ones produces a distorted picture. Record both directions, and the average starts telling you something useful.
Sizing as If the Stop Were Exact
A stop level is an instruction, not a promise about the exit price. Build a small buffer into your risk figure so a gap cannot quietly double the loss you planned.
Holding Through the Weekend Without Thinking
Friday close to Sunday reopen is the widest hole in the trading week. Either accept gap exposure deliberately or trim size before the close.
Judging a Broker on One Trade
Execution quality shows up in samples, never in anecdotes. Compare typical spreads across brokers with our forex spread comparison tool before drawing conclusions.
Quick Reference: Where Slippage Bites Hardest
Keep this table beside your platform. It ranks the moments that matter and what to do about each.
| Moment | Why it happens | What to do |
|---|---|---|
| Sunday reopen | Two days of news with no trading in between | Trim size on Friday, or price the gap into your risk |
| First minute of a major release | Depth withdraws and quotes update many times per second | Wait, or use limit orders where price control matters most |
| Daily rollover hour | Liquidity providers step back around the session change | Avoid new market orders inside that window |
| Exotic pairs at any hour | Fewer participants and thinner depth at every level | Size down and widen your expectations |
| Stops clustered on round numbers | Many orders convert to market orders at the same instant | Place invalidation where structure sits, not on obvious figures |
The Same Weekend, the Other Direction
One example proves little. A second case, on a different pair and jumping the opposite side, shows the pattern properly.
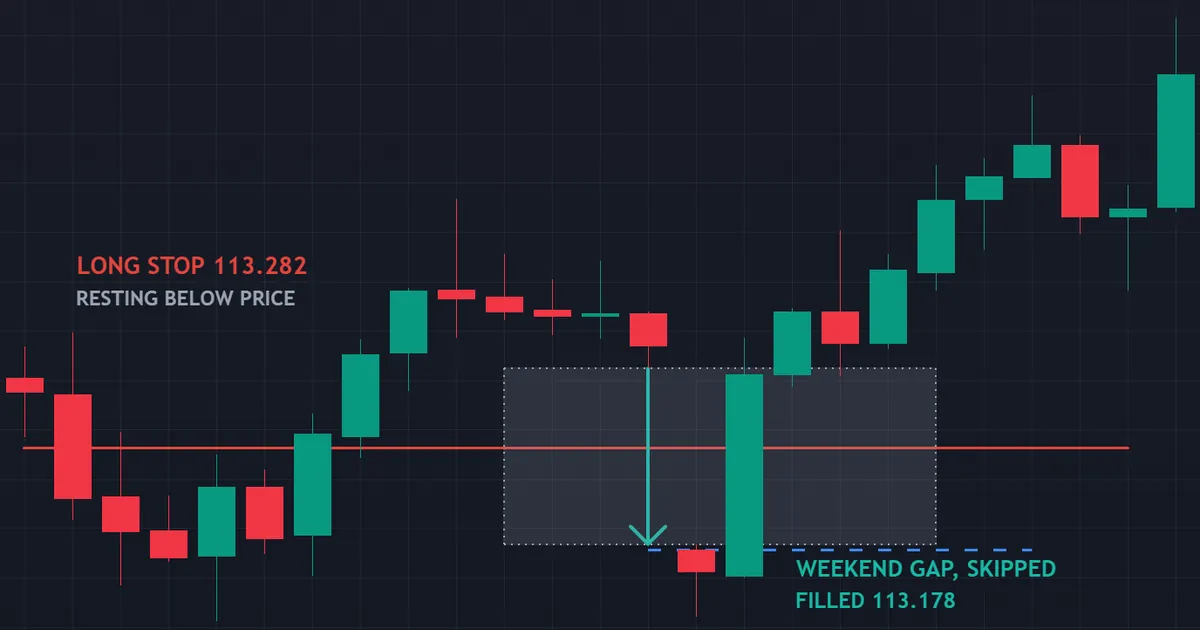
Here are AUDJPY hourly bars at the reopen of 19 July 2026. Price gapped down 0.178, about 1.54 times the average true range of an hourly bar, and the new week opened at 113.178 with a long stop at 113.282 stranded above it.
What the Two Gaps Have in Common
Both gaps opened a weekend, and both measured roughly one and a half average ranges. Neither number counts as extreme by weekend standards.
Their directions differ, though, and so does the victim. The EURUSD gap ran up through a short’s stop; this one ran down through a long’s stop, roughly 10.4 pips below the chosen level.
That symmetry is the lesson. Weekend risk has nothing to do with which way you are positioned.
What It Means for Position Sizing
Plan for the ordinary case rather than the perfect one. If your stop sits half an average range away while weekend gaps run one and a half, your Friday size needs another look.
Our guide to the weekend gap in forex covers the full arithmetic, including which instruments tend to gap widest.
Slippage Inside a Backtest
Historical testing almost always flatters execution. Knowing by how much keeps your expectations honest.
Why Tests Understate It
A backtest fills you at a bar price that existed for an instant. Live orders meet a book, a spread and a queue instead.
Tick data helps, yet even good tick data carries no record of depth. Two orders of very different size fill identically in a test and quite differently in reality.
Building a Realistic Assumption
Take your measured average from live trading and apply it to every entry and exit in the test. Then double it and look again.
If the strategy survives both versions, the edge probably lives outside the noise. If it dies under the doubled figure, the result was always execution-dependent.
What Your Broker Controls and What It Cannot
Blame lands unfairly in both directions here. A short list keeps the argument honest.
Inside the Broker’s Control
Server location, order routing and processing speed all sit with the broker. So does the choice of liquidity providers behind the quote.
A slow bridge adds milliseconds to every order. Over a year, those milliseconds turn into a measurable cost.
Ask where the servers sit and which venues the flow reaches. Good brokers answer plainly and publish figures.
Outside Anyone’s Control
Weekend gaps belong to the market rather than the broker. So do the first seconds after a surprise headline.
No routing arrangement can create a price that nobody quoted. When depth disappears, every participant meets the same empty book.
Regulators in several regions now require execution quality reports. Those documents make useful reading before you open an account.
The Test That Separates Them
Look at your calm-hours fills first. Slippage on a major pair at midday in London says something about routing.
Then look at your release and reopen fills. Slippage there says a great deal about the market and very little about your broker.
Run both samples before you decide anything. The split usually points straight at the answer.
Related Guides in This Cluster
Slippage sits inside a small family of execution topics. Two of them answer the questions this article raises.
Practical controls live in our guide on how to avoid slippage in forex, which stays honest about the fact that you can reduce exposure rather than remove it.
If your platform sometimes refuses a fill and offers a new price instead, your account runs on instant execution. Our explanation of the requote in forex covers that behaviour and why market execution accounts never show it.
For the tools side of the site, our MetaTrader indicators library includes volatility measures that help you judge when conditions have turned thin.
FAQ
Is slippage the same thing as the spread?
No. Spread is the standing difference between bid and ask, visible before you commit. Slippage appears afterwards, as the movement between your request and your fill. Both belong in your cost accounting, and both widen in the same conditions, which is why traders often confuse them.
Can slippage work in my favour?
Yes, and it does so regularly. If price ticks your way during the round trip, your fill arrives better than the quote you clicked. Brokers call that price improvement. A healthy execution record shows both tails, so a stream with negative fills only deserves a closer look.
Does a stop loss protect me from slippage?
Not from slippage, no. A stop loss caps the level at which your exit triggers, then converts to a market order and takes the next available price. Across a weekend gap, that price can sit well beyond your level, exactly as both charts above show. Some brokers offer a fixed-exit stop product for an extra charge, which shifts that risk to them.
Which instruments slip the most?
Thin ones and fast ones. Exotic currency pairs carry fewer participants at every price level, while commodities and indices can move violently on a single headline. Major pairs during London or New York hours sit at the calm end of the range.
Should I change broker after a bad fill?
Not on one trade. Collect fifty fills with the session and conditions noted, then compare the average against what your broker publishes. Poor execution shows up as a persistent one-sided average, not as a single dramatic story.
Do limit orders remove slippage completely?
On price, yes. A limit fills at your level or better and never worse, so the price risk disappears. What replaces it is participation risk. The order can sit untouched while price reaches your level, clears the queue ahead of you and leaves again. You swap one uncertainty for another rather than removing uncertainty altogether.
How much slippage is normal?
It varies by instrument, by session and by broker, so no single figure applies. On major pairs in liquid hours, most retail traders see fractions of a pip in both directions. Around releases and at the weekend reopen, the same accounts see multiples of that. Measure your own stream, review it monthly, and judge your process over a long run of trades rather than any single fill. Results are not guaranteed; past performance is not indicative of future results.
External references
- For background on this concept, see Slippage at Corporate Finance Institute.
- For broader market context, see Implementation Shortfall at Investopedia.

About the author
Written by Dominic Walsh, a Forex trader and MT4/MT5 indicator, Expert Advisor and script developer. Every tool on forexmt4systems.com is tested on live charts before release and ships with ready-to-use compiled MT4 (.ex4) and MT5 (.ex5) files. Learn more about the trader and developer behind this site.
How we build, test and correct every tool: Editorial & Testing Policy. Trading carries risk; see the disclaimer.