
The ichimoku vs moving averages debate pits a full charting system against a single sliding line. Both draw on the price panel, both track the trend, and both help you lean long or short. Yet one shows a whole picture at a glance while the other shows just an average.
So this guide settles the ichimoku vs moving averages choice with plain rules, honest settings, and a worked trade. By the end you will know what each tool reveals, where each one hides detail, and which fits your screen and your pace.
Ichimoku vs Moving Averages: System vs Single Line
A moving average smooths price into one flowing line. It adds up the closes over a set window, divides by the count, and plots the result. So a rising line means recent prices sit above older ones, and a falling line means the reverse.
The Ichimoku Cloud does far more in one view. Goichi Hosoda, a Japanese journalist, spent years refining it before he published it in the late 1960s. The name translates to “one-glance equilibrium chart”, and that glance packs five lines into a single picture.
Those five lines work as a team. Two fast lines track short and medium balance, a shaded cloud marks the trend zone ahead, and a lagging line checks the move against the recent past. So the Ichimoku answers trend, momentum, and support in one look, where a moving average answers only direction.
Look at a concrete frame. The chart shows USDJPY on the four-hour timeframe with a full Ichimoku set to the classic 9, 26, 52 and, beside it, a plain 50-period moving average. Price rides near 162, above both the cloud and the line, so both tools read bullish. Yet the Ichimoku also shows how far the support sits below.
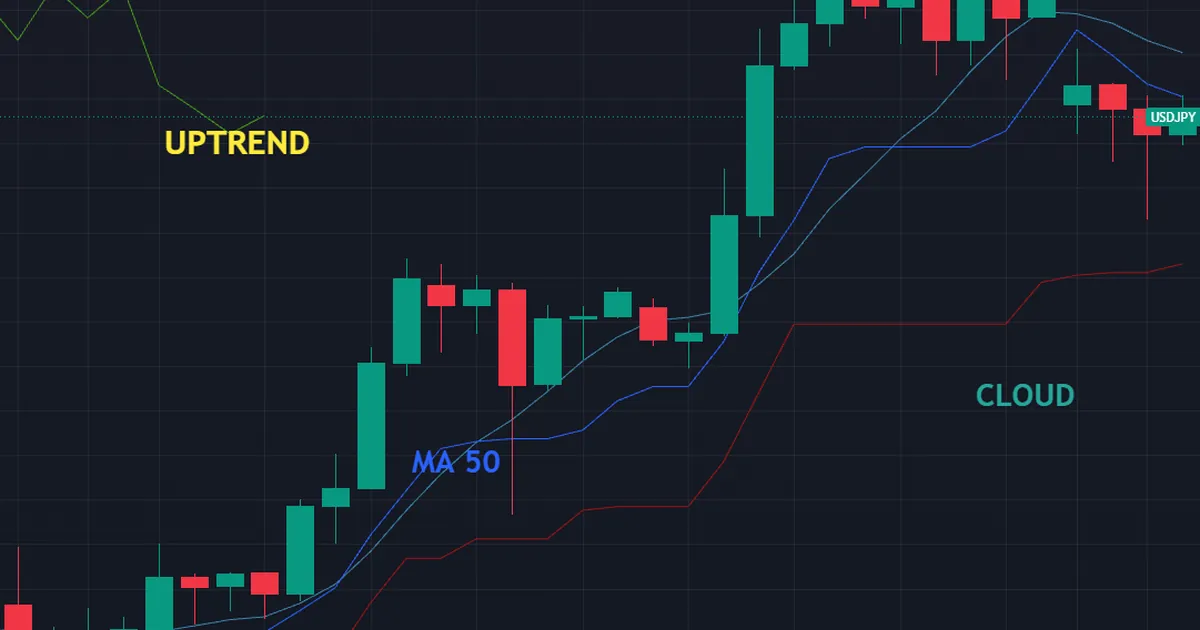
Now trace the difference from left to right. First the moving average bends up as price climbs. Then the Ichimoku cloud thickens beneath, marking a firmer floor, while the lagging line confirms the run from behind. So the single line states the trend, and the system explains it.
Why does that extra detail matter? More information can sharpen a decision or clutter a screen. So the real question is whether you want one clean signal or a fuller map, and that answer differs for every trader.
How Each Tool Is Built
The math behind each approach is small, so learn it once and reuse it forever. A handful of ideas separate them, and the rest follows naturally.
- The moving average. A simple moving average adds the last set of closes and divides by the count, while an exponential version weights recent closes more heavily. Either way, one line results.
- Tenkan-sen. The Ichimoku conversion line averages the highest high and lowest low over nine bars. It reacts fast and acts like a short-term pulse.
- Kijun-sen. The base line does the same over 26 bars. It moves slower and often serves as a trailing support or resistance in a trend.
- The cloud, or Kumo. Senkou Span A averages the two fast lines, and Senkou Span B averages the 52-bar range. Both shift 26 bars ahead, and the space between them shades the cloud.
- Chikou Span. The lagging line plots the current close shifted 26 bars back. It checks whether price now sits above or below where it traded then.
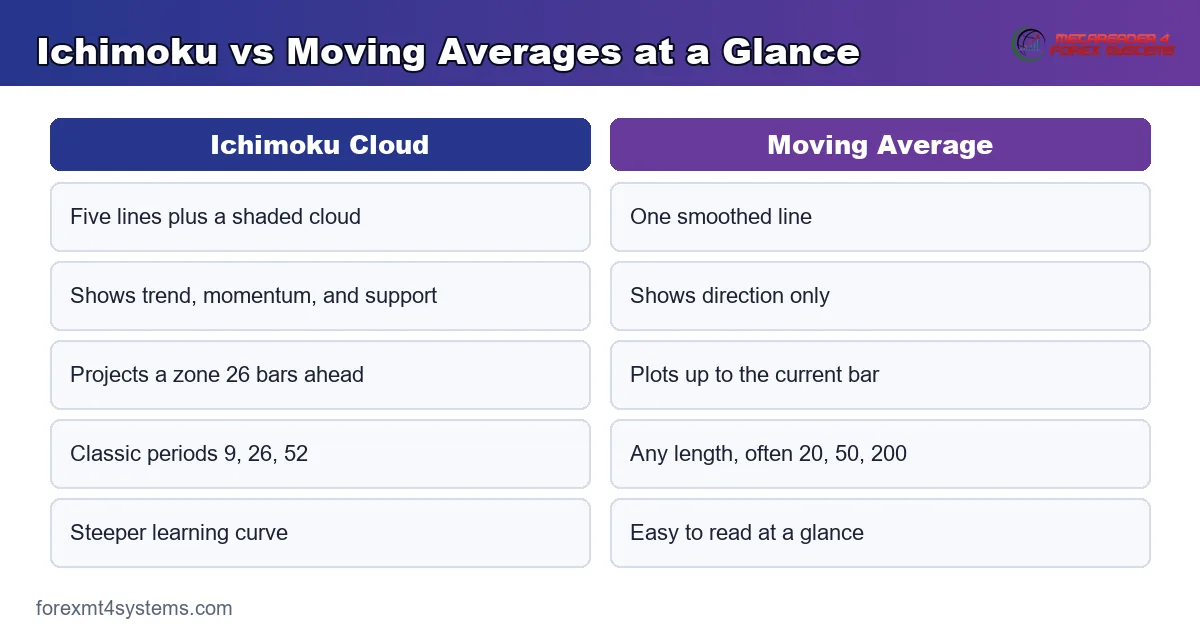
So a moving average uses one window and one line, while the Ichimoku uses three windows and a forward-projected zone. The concept graphic below lines the two builds up side by side.
Reading the Default Periods
The default numbers carry real weight. Hosoda chose 9, 26, and 52 to fit the old six-day trading week, and traders kept them out of habit and shared attention. So those periods still frame most Ichimoku charts today.
A moving average has no single default. Traders reach for 20, 50, 100, or 200, and each length tells a different story. A 20-period line hugs price and turns fast, while a 200-period line barely bends and marks the long trend.
One point often trips up newcomers. Neither tool predicts a turn; each reacts to price that has already moved. So a cross or a cloud break confirms a change rather than forecasting it, and both lag by design.
Why the Cloud Adds Depth
The cloud does something no single line can. It projects support and resistance ahead of price, so you see the zone before candles arrive there. Because the cloud sits 26 bars forward, it gives a rough map of where the trend may find a floor or ceiling.
A moving average offers no such forward view. It plots only up to the current bar, so any support it marks is read in the moment. Hence the Ichimoku hands you a plan for the next bars, while the moving average simply reports the present.
Reading One Line Versus Five
A single moving average is quick to read and hard to misjudge. Price sits above or below, the line rises or falls, and that is the whole message. So beginners grasp it in minutes.
The Ichimoku asks more of your eye. Five elements interact, and a strong signal needs several to agree. So the learning curve is steeper, yet the payoff is a richer read once the pattern clicks.
How the Two Lines Cross
The Ichimoku carries its own crossover, much like a moving-average pair. When the fast Tenkan line cuts above the slower Kijun, momentum leans up; when it cuts below, momentum leans down. So the system folds a cross into a wider context that a lone pair of averages lacks.
Because the cross sits inside the cloud framework, its meaning shifts with location. A bullish cross above the cloud carries far more weight than the same cross below it. So the Ichimoku grades its own signal by where it prints, while a moving-average cross reads the same wherever it lands.
Fitting Each Tool to a Workflow
Standard settings exist because many traders watch the same numbers. That shared attention gives the defaults staying power, so start there before you tweak anything.
Match the tool to your style first. A trader who wants one clean trend filter reaches for a moving average or two. A trader who wants a full framework, complete with support zones and momentum, reaches for the Ichimoku.
Choosing a Timeframe
Timeframe shapes both tools. On a daily chart, a 200-period average marks the long trend, and the Ichimoku cloud maps multi-week zones. On a five-minute chart, both react far faster, so expect more noise and plan tighter risk.
Because higher timeframes smooth price, they smooth both tools too. So a swing trader leans on the four-hour and daily reads, while a scalper accepts the quicker, messier lower-timeframe signals. Pick the timeframe that fits your screen time, then judge each tool there.
Pairing Moving Averages Together
Many traders run two moving averages at once. A faster line and a slower line cross to flag shifts, and the gap between them shows momentum. So a simple pair can mimic a slice of what the Ichimoku shows, though without the cloud or the lagging check.
That pairing keeps the chart clean. Two lines are easy to read, and the cross is a clear trigger. Yet it still lacks the forward zone, so it reports the trend without mapping the road ahead.
Pairing Either Tool With Structure
Neither approach should trade alone. Both read best next to plain price structure, such as a recent swing high or a round number. So map your support and resistance first, then let the tool time the move.
The Ichimoku already folds some structure into the cloud and the base line. A moving average does not, so it leans harder on your own levels. Because of that, a moving-average trader must draw more by hand to match the context the cloud supplies.
Worked Example: A Trend on USDJPY
Picture USDJPY grinding higher on the four-hour chart through the Tokyo and London sessions. Price sits near 161.5, above a rising 50-period moving average and above a thin cloud. So both tools read bullish from the start.
Watch how each tool frames the next move. A pullback drags price toward the moving average, and a single-line trader waits to see if the line holds. The Ichimoku trader sees more, since price is also easing toward the top of the cloud and the base line. The chart below marks that layered support.
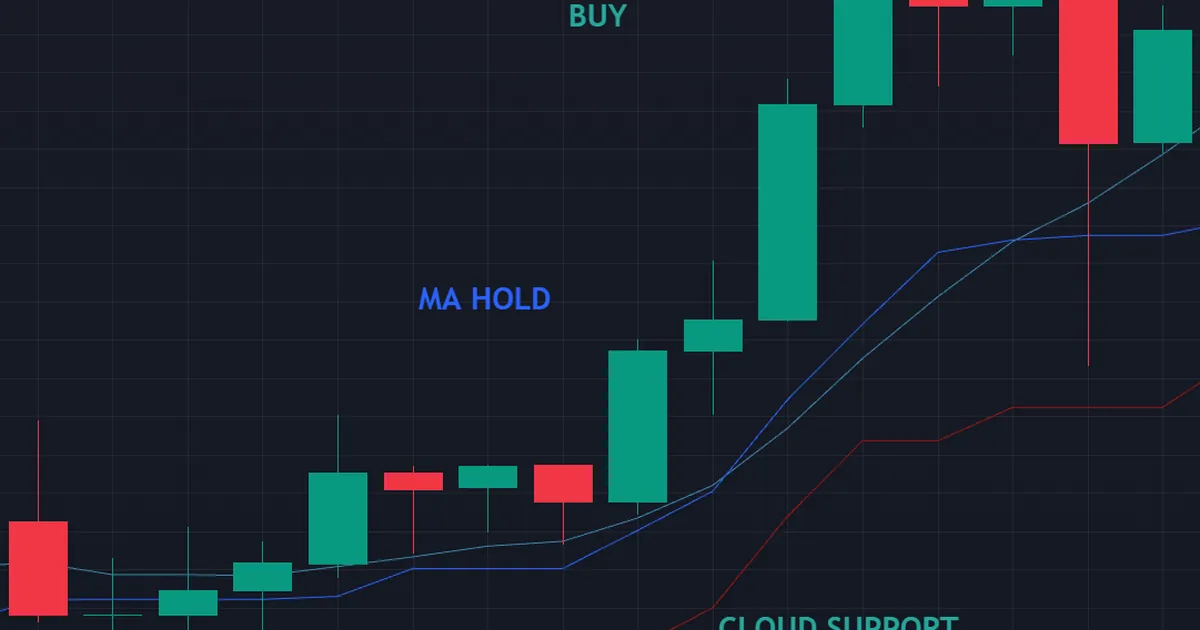
Now the trade builds itself. Price steadies right where the cloud, the base line, and the moving average cluster near 161.4, and a bullish candle closes there. Because three supports stack together, the Ichimoku trader takes the long with more confidence than the line alone would give.
Then the confirmation arrives. The fast Tenkan line curls back above the slower Kijun, and the lagging line stays above the price from 26 bars ago. So the whole system agrees, while the moving average simply shows price bouncing off one line.
The follow-through rewarded the layered read. Price pushed to a fresh high near 163, and the cloud thickened beneath as support firmed. So the Ichimoku trader held with a clear floor in view, while the single-line trader trailed a stop under the one average.
Notice what a single-line trader could not see. The moving average showed a bounce, yet it gave no map of where price might stall next. Meanwhile the Ichimoku trader read the thickening cloud as a growing floor and the forward zone as a rough target. So the same trade offered a richer plan through the system.
Managing the Trade After Entry
A clean signal is only half the job. The exit decides the result. So plan your target before the trade goes live, and let each tool help you hold or fold.
In this USDJPY case, the rising base line offered a natural trailing stop for the Ichimoku trader. A moving-average trader trailed under the 50-period line instead. Because both stops sat below firm structure, either kept the trade alive through minor dips.
Reading the First Warning
Watch for the first real warning too. On the Ichimoku, price closing back inside the cloud hints the trend is tiring. On a moving average, price closing firmly below the line does the same. So use either break as a cue to tighten risk, not as a reason to reverse blindly.
Download the complete indicator database
Put these concepts on your charts. One email unlocks the full library of 1,380+ indicators with compiled MT4 and MT5 files, plus my TradingView scripts. No paywall, no spam, unsubscribe any time.
Get free access to my indicator database
One email unlocks 1,380+ free MT4, MT5 and TradingView indicators — the complete library. No single-tool download; you get the whole database.
Common Mistakes and How to Fix Them
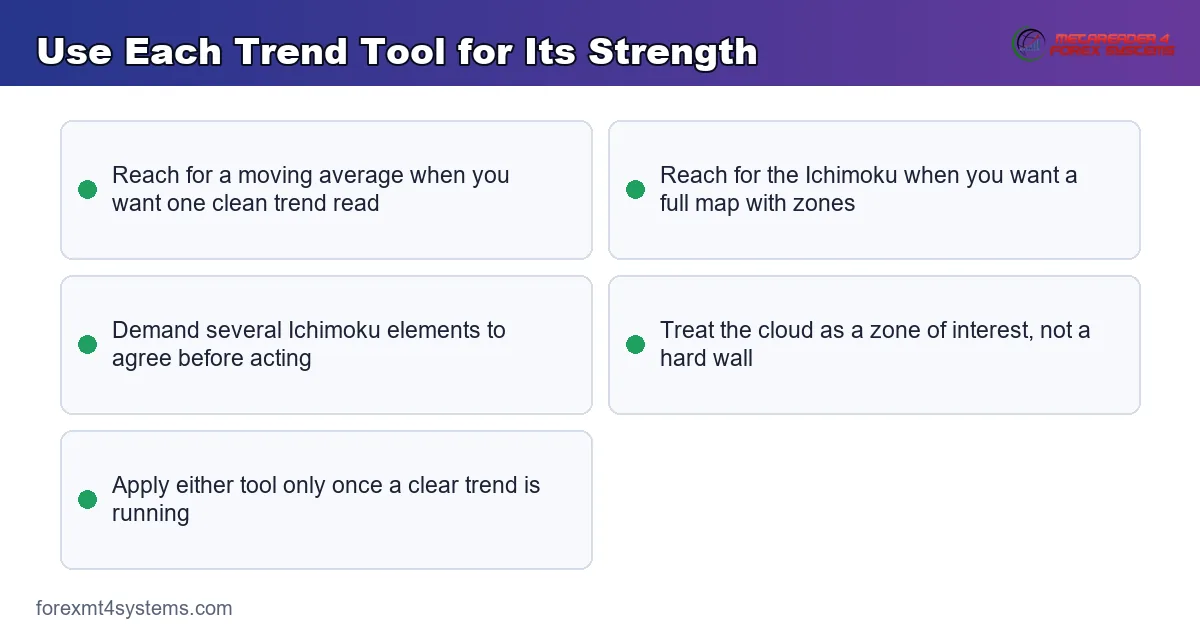
Both tools are simple in theory, yet the same errors repeat on every chart. Most trace back to trusting a single element out of context, and the fixes follow beneath the graphic.
Trading a Moving-Average Cross in a Range
Two averages cross back and forth when price drifts sideways. Trading each cross in a range stacks small losses fast. Instead, confirm a trend exists first, then treat the cross as a trigger.
Reading Only One Ichimoku Line
Some traders watch the cloud alone and ignore the base and lagging lines. That habit throws away the system’s real strength. So wait for several elements to agree before you trust an Ichimoku signal.
Forcing the Wrong Timeframe
The classic 9, 26, 52 periods feel sluggish on a one-minute chart. Cranking them down to force speed usually adds noise. So respect the timeframe the settings suit, or move up to where the defaults breathe.
Treating the Cloud as a Hard Wall
A thick cloud marks strong support or resistance, yet price still cuts through it in a real trend. Trading every touch as a bounce ignores that. So treat the cloud as a zone of interest, not an unbreakable barrier.
Ignoring the Higher Timeframe
A bullish cross on the five-minute means little against a falling daily trend. Truly, the higher timeframe frames every lower signal. So check the daily direction before you trust any intraday read on either tool.
Pre-Trade Trend-Filter Checklist
Run this short list before every entry. A few seconds here saves hours of regret later. So slow down, tick each item, and let a failed check keep you out of a marginal trade.
- Higher-timeframe trend read on the daily and four-hour charts.
- Tool matched to your style, one line for simplicity or the Ichimoku for a full map.
- Trend confirmed, with price on the right side of the cloud or the average.
- Several Ichimoku elements in agreement, if you trade the system.
- Stop distance set from the base line, the average, or a nearby swing.
- An active session, Tokyo, London, or New York, open now.
- Entry, stop, and target planned before the trade goes live.
When Trend Tools Fail
Study the failure case as hard as the winner. Here is a common one. EURUSD chops in a tight range on the fifteen-minute chart, drifting either side of 1.14 with no clear direction.
Then the false signals pile up. The moving average flattens and price crosses it again and again, while the Ichimoku cloud thins to a ribbon that price slices through both ways. A trader who acts on each signal bleeds out through spread and small losses. The chart below shows that whipsaw trap.
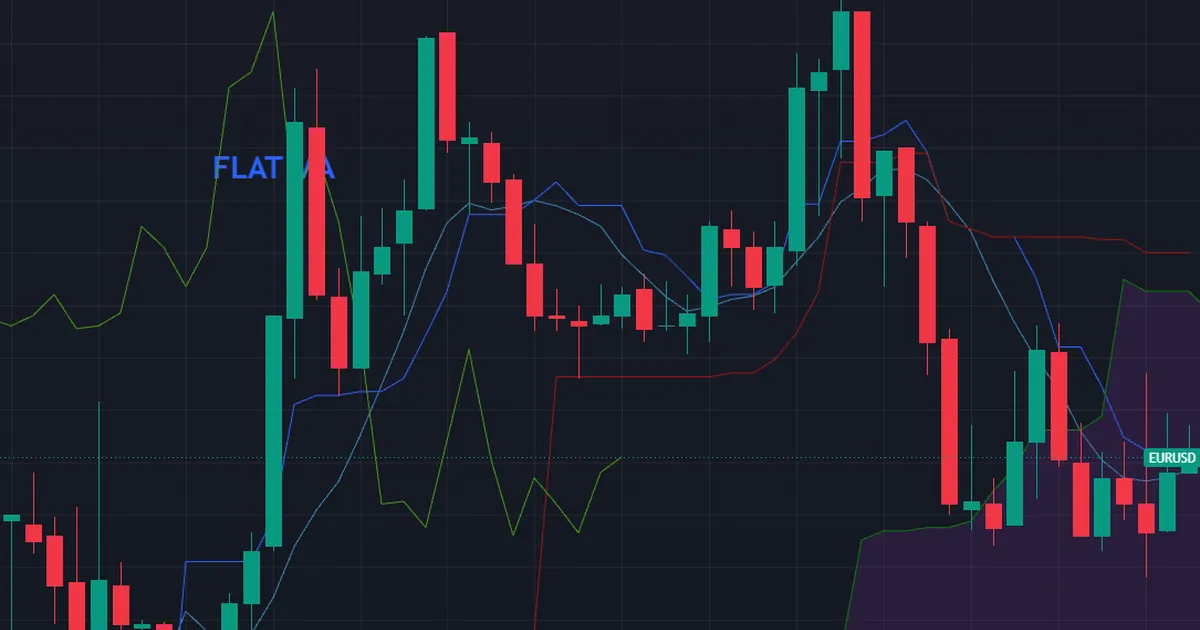
So what went wrong? Both tools assume a trend, and this market had none. In a range, a moving average has nothing to smooth and a thin cloud marks no real zone. Hence the rule that limits the damage: use these tools only once a trend is clearly in play.
There is a deeper lesson in that trap. A trend tool answers one narrow question about direction. It knows nothing about the range, the news, or the session. So a cross or a cloud break that looks decisive can be meaningless in the wider picture.
Then size each trade so a bad read costs little. A sensible stop flows from the structure, and position size flows from that stop. A simple trade journal then records each result, so you learn which signals fail in which markets. Because the risk stayed small, a wrong read stung rather than wounded.
The Ichimoku Can Overwhelm a Beginner
Be honest about the clutter. Five lines and a shaded cloud can freeze a new trader into inaction. So many start with one moving average, learn to read the trend cleanly, then add the Ichimoku once the basics feel automatic.
A Single Average Can Mislead in a News Gap
Be honest about news too. A sharp release can leap past a moving average, so price never trades at the level the line implied. Because both tools react to bars that already printed, neither shields you from a gap. So check the calendar before you lean on either.
Both Tools Lag at the Turn
Be honest about the lag as well. A moving average bends only after enough closes shift, and the Ichimoku cloud reshapes only as new bars build it. So neither catches the exact top or bottom, and both hand back a slice of the move at every reversal.
Accept that cost as the price of confirmation. A tool that waits for proof will always trail the turn. So treat every cross and cloud break as a delayed signal, and never expect either tool to call the high or low in advance.
Related Concepts to Study Next
These two approaches connect to a web of sibling tools, and a few deserve your next reading hour. Start with our guide to what the Ichimoku Cloud is for a full breakdown of its five lines. Then read our notes on moving averages explained to see how the single line is built and used.
One more guide sharpens the choice. Because the type of average changes its feel, compare the two main kinds with our take on the difference between the SMA and the EMA, and you will pick the right line for your pace.
For hands-free charting, the Ichimoku indicators archive plots the full system for you, while the moving average indicators archive gathers the single-line trend tools. Tools speed the work, yet the logic above still carries the trade. So learn the rules first, and let any indicator plot what you already understand.
FAQ
Is the Ichimoku better than a moving average?
Neither is better in the abstract. The Ichimoku shows trend, momentum, and forward support in one view, while a moving average gives a single clean read. Match the tool to how much detail you want on screen.
What are the default Ichimoku settings?
The classic periods are 9, 26, and 52, with the cloud and lagging line shifted 26 bars. Hosoda chose them for an older trading week, and traders kept them for shared attention. Test any change across many charts before you trust it.
Can I use the Ichimoku and a moving average together?
Yes, and some traders do. Let the Ichimoku map the trend and its zones, then use a moving average as a simple extra filter. When both agree, a signal carries more weight.
Which is easier for a beginner to learn?
A single moving average is far easier to start with. Price sits above or below one line, and that is the whole message. Add the Ichimoku once you read a basic trend without effort.
Does the Ichimoku work in forex?
Yes, traders apply it across major pairs, and it grew popular on yen crosses first. It works best in trending markets and struggles in tight ranges, just like a moving average. Test it on your own pairs before you rely on it.
What does the Ichimoku lagging line add?
The lagging line, or Chikou Span, plots the current close 26 bars back. It checks whether price now sits above or below where it traded then, which confirms momentum from a fresh angle. A moving average offers no such backward comparison, so the lagging line is pure extra context.
Do these trend tools work in every market?
They work best in trending markets and struggle in choppy ranges. In a hard range, crosses and cloud breaks mislead. Manage risk on every trade. Results are not guaranteed; past performance is not indicative of future results.
External references
- For background on this concept, see Ichimoku Cloud at Corporate Finance Institute.
- For broader market context, see Simple Moving Average at BabyPips.

About the author
Written by Dominic Walsh, a Forex trader and MT4/MT5 indicator, Expert Advisor and script developer. Every tool on forexmt4systems.com is tested on live charts before release and ships with ready-to-use compiled MT4 (.ex4) and MT5 (.ex5) files. Learn more about the trader and developer behind this site.
How we build, test and correct every tool: Editorial & Testing Policy. Trading carries risk; see the disclaimer.