
The new week opening gap, or NWOG, is the price void between Friday’s 16:59 close and Sunday’s 18:00 open in New York time. Price often returns to fill or respect that gap, so it works as both a magnet and a support-and-resistance zone. This guide shows you how to mark the new week opening gap, trade toward it, and defend it once price arrives.
By the end you will draw the gap in seconds, use it as a weekly draw on liquidity, and avoid the common errors that turn a clean level into a loss. We keep the times exact and the rules simple, so you can test the idea on next weekend’s chart open.
What Is the New Week Opening Gap?
A new week opening gap is the distance between two specific prices. The first is Friday’s close at 16:59 New York time, right before the weekend halt. The second is Sunday’s reopen at 18:00 New York time, when the forex week restarts. Price rarely reopens at the exact Friday close, so a gap appears between the two.
The concept comes from the work of Michael Huddleston, the Inner Circle Trader (ICT), who tracks weekend price voids as engineered reference points rather than random spaces. In that view the algorithm remembers the gap and often returns to it. So the NWOG becomes a level the market tends to revisit.
Read the chart below to see a gap in action. Friday closes near one price, and Sunday opens a little lower, leaving a clean void between them. We shade that void and mark its midpoint. Then across the new week, price drifts back toward the gap, respects its edges, and uses it as a decision zone.
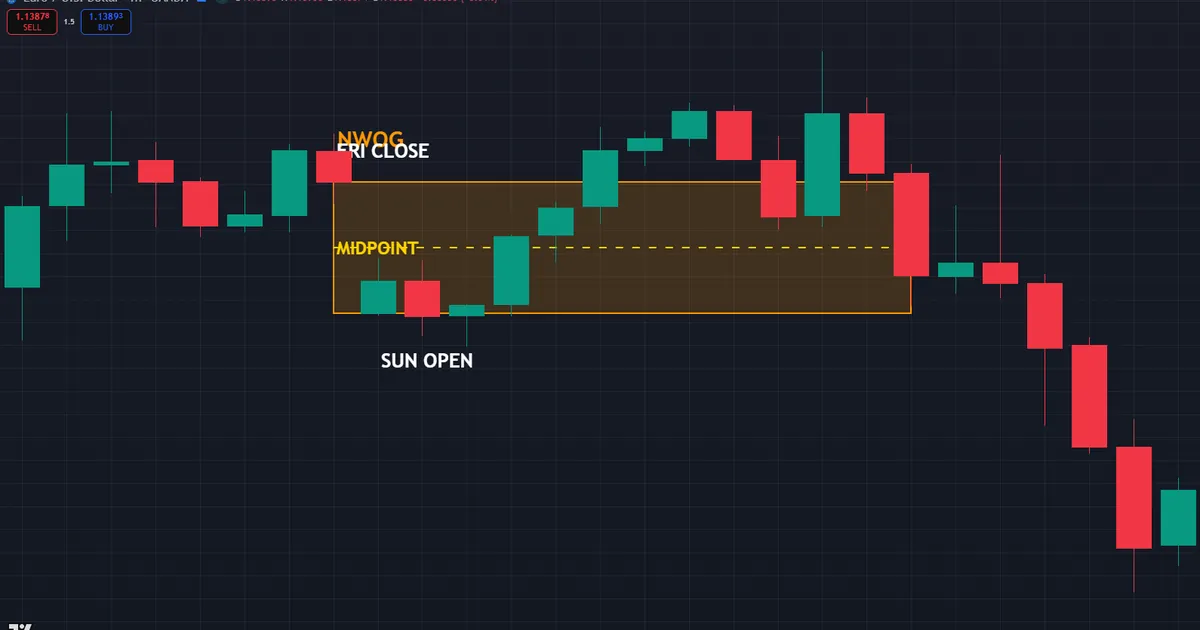
Mark two lines and a middle, and the setup is ready. Draw one line at the Friday 16:59 close and another at the Sunday 18:00 open. The band between them is the NWOG. Its 50 percent line, the consequent encroachment, often acts as the most reactive level inside the gap.
Why the Weekend Gap Matters
Weekend gaps hold meaning because they mark a break in delivery. Over the weekend no trading happens, yet news and positioning still shift sentiment. So Sunday’s open reflects that shift, and the void records it on the chart. Price then treats the gap as unfinished business and often travels back to balance it.
This behavior links to the wider idea of a liquidity void, a thin area that price tends to retrace and fill. A NWOG is simply a liquidity void created by the weekend halt. So the same magnet logic applies, only anchored to a fixed weekly time.
There is a second reason the gap earns respect. Stops and pending orders often cluster around round weekly reference prices. So when price returns to the void, it meets resting liquidity that fuels a reaction. The gap therefore doubles as a liquidity shelf, not just an empty space on the chart.
Gap Up Versus Gap Down
Direction changes the read only a little. A gap up means Sunday opened above Friday’s close, leaving the void below the open. A gap down means Sunday opened lower, leaving the void above the open. So the label tells you where the unfilled space sits relative to the fresh week.
Trade the void, not the label. Whether the gap points up or down, price still tends to travel back toward the untouched band. So focus on which edge remains unfilled and let your higher-timeframe bias decide whether you ride toward it or fade a reaction at it.
How to Mark and Trade the NWOG Step by Step
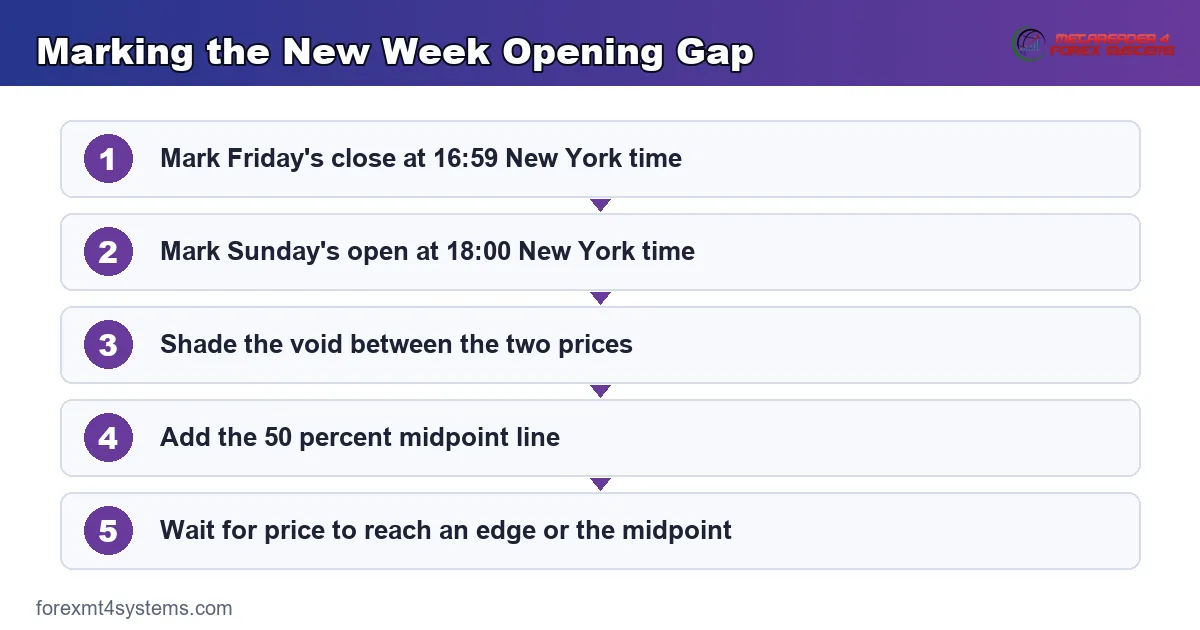
Trading the NWOG follows a fixed routine. Walk the six steps below and the level does the heavy lifting for you.
- Find Friday’s close. Mark the price at 16:59 New York time on the last candle before the weekend.
- Find Sunday’s open. Mark the price at 18:00 New York time on the first candle of the new week.
- Shade the gap. Draw a box between the two prices so the whole void stays visible all week.
- Add the midpoint. Draw the 50 percent line inside the box, since price often reacts there first.
- Set your bias. Decide whether price sits above or below the gap and which edge it should draw toward.
- Wait for the reaction. Let price reach an edge or the midpoint, then look for a lower-timeframe trigger.
The branded graphic below stacks the six steps so you can repeat them every weekend. Notice how the midpoint often reacts before either outer edge. So watch that line closely as price approaches.
Trading Toward the Gap as a Draw
Price often uses an unfilled NWOG as a target. When the gap sits above the current price, it can act as a bullish draw, pulling price up to fill it. When the gap sits below, it can act as a bearish draw instead. So the first way to trade the level is to ride toward it, not to fade it.
Frame the trade with your bias first. If the daily trend points up and an unfilled gap waits overhead, a long toward the gap aligns two ideas at once. Then take profit into the gap rather than beyond it, because the void is where reactions cluster.
Trading the Gap as Support or Resistance
Once price reaches the gap, the level can also flip a move. A filled gap edge often holds as support in an uptrend or as resistance in a downtrend. So the second way to trade the NWOG is to look for a reaction at an edge and enter on the bounce. Wait for a clear rejection, never a naked touch.
The two approaches are not rivals; they run in sequence. First price draws toward the gap, then it reacts at an edge, and the reaction sets up the flip trade. So a single gap can offer a draw entry on the way in and a reversal entry once price arrives. Reading both stages doubles the value of one clean level.
Where the NWOG Fits Your Weekly Workflow
The NWOG earns its keep as a weekly anchor. It answers where price may draw across the week, not which minute to click. So pair it with higher-timeframe bias and session timing before you act on any touch.
First, set direction from the daily and four-hour charts. A rising market with an unfilled gap overhead gives a clean upside target for the week. Our guide to ICT daily bias walks through building that direction before Sunday’s candle even opens. So you enter the week with a plan, not a reaction.
Second, align the gap with the trading clock. Price often approaches the NWOG during the London or New York sessions, when volume can carry it. Those high-probability hours match the windows our ICT kill zones guide maps in detail. A free forex market hours tool keeps them in front of you, so you watch the level when it matters and rest when it does not.
Pairing the NWOG With the Midnight Open
The weekly gap works well beside the daily open. Both fix a reference in time and let price rotate around it. So a NWOG that lines up with the ICT midnight open creates a stacked level with extra pull. When two time-based references agree, price tends to respect the zone more sharply.
Which Timeframe to Draw It On
Draw the gap once, then read it everywhere. The NWOG is a single band, so you mark it on any chart and let lower timeframes handle entries. Swing traders watch it on the four-hour, while intraday traders drop to the five-minute for the reaction. The level stays the same regardless of the chart you view. The wider library of ICT indicators for MT4 and MT5 can plot the weekend gap for you while the routine still feels new.
Worked Example: Trading Toward an Unfilled NWOG
Now make the idea concrete with a long setup. On EURUSD the daily trend points up, and an unfilled NWOG sits overhead, near the 1.1427 to 1.1438 band. So the plan is to buy a dip during the week and target the gap as the weekly draw. The chart below shows the gap, the entry, and the reaction.
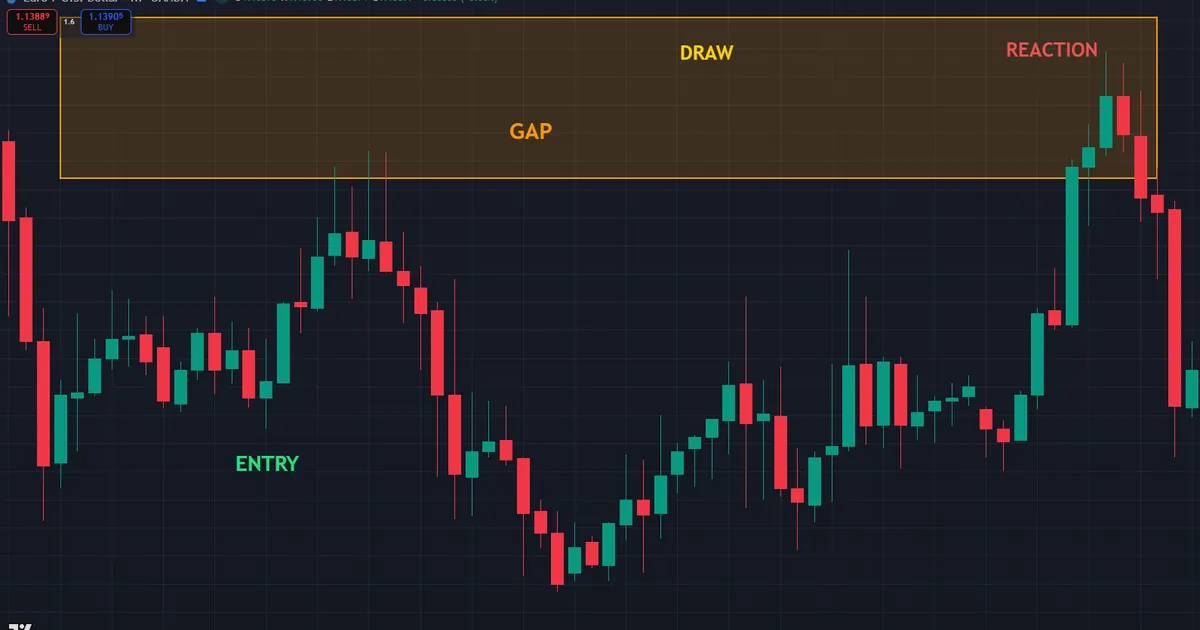
Early in the week, price pulls back into a discount zone below the gap, near the 1.1415 area. There a lower-timeframe shift confirms buyers stepping in. So a long enters on that shift, with a stop below the swing low, roughly 15 pips of risk.
Then price climbs across the week and taps the lower edge of the gap near 1.14268. That first touch delivers a clean reaction, and partial profits come off into the void. Next, price pushes into the midpoint near 1.14325, where the move stalls. So the gap does exactly what it should: it draws price up and then reacts. Notice the sequence never changes: bias up, dip into discount, deliver toward the unfilled gap.
A Bearish NWOG in Brief
Flip every rule for a short and the logic still holds. On GBPUSD the daily trend points down, and an unfilled gap sits below price, near the 1.2650 to 1.2670 band. So the plan is to sell a rally during the week and target the gap as the weekly draw.
Midweek, price rallies into a premium zone above the gap and stalls at a prior high. There a lower-timeframe shift confirms sellers stepping in. So a short enters on that shift, with a stop above the swing high. Then price rolls down toward the gap, taps its upper edge near 1.2670, and reacts. So the mirror setup works exactly like the long, only pointed the other way.
Managing the Trade at the Level
Management matters as much as the entry. When price reaches the first edge of the gap, bank part of the position and lift the stop toward breakeven. So a reaction at the edge can no longer turn a winner into a loser. The remaining size then rides toward the midpoint or the far edge.
Read the reaction candle for a cue. A strong rejection at the edge argues for holding a runner in the trend direction, while a weak stall argues for a full exit. So let the level and the price action decide, rather than a fixed rule that ignores the tape. This flexible exit keeps the reward side healthy without giving back the whole move.
Download the complete indicator database
Put these concepts on your charts. One email unlocks the full library of 1,380+ indicators with compiled MT4 and MT5 files, plus my TradingView scripts. No paywall, no spam, unsubscribe any time.
Get free access to my indicator database
One email unlocks 1,380+ free MT4, MT5 and TradingView indicators — the complete library. No single-tool download; you get the whole database.
Common NWOG Mistakes and How to Fix Them
The level reads cleanly, yet the same errors repeat. The graphic below collects four traps we see most, and the fixes follow beneath it. Each fix costs nothing but attention.

Marking the Wrong Times
A gap drawn from the wrong candles is worthless. Use 16:59 for Friday’s close and 18:00 for Sunday’s open, both in New York time. So set your chart timezone correctly before you draw anything. A one-hour offset ruins the level entirely.
Fading a Strong Trend Into the Gap
An unfilled gap is a target, not a solid wall. Traders often short into a rising gap and get run over. Instead, respect the trend and use the gap as a draw first. Only look for a reversal once price reaches the level and shows a real rejection.
Entering on a Naked Touch
A simple tap of the edge proves nothing. Price can slice straight through a gap on strong momentum. Rather than enter blind, wait for a lower-timeframe trigger, such as a change in state of delivery or a clean rejection candle, right at the edge or midpoint.
Forgetting the Gap After Monday
Some traders erase the level once Monday passes. Yet a NWOG can stay relevant for the whole week or longer. So keep the band on your chart until price fills it fully, then archive it. Old gaps often matter again weeks later.
Chasing the First Touch
The first tap of a gap tempts many traders into a rushed entry. Yet price often pokes an edge, pulls back, and only reacts on a second visit. So let the level prove itself before you commit full size. A patient second-touch entry frequently offers a cleaner stop and a better price than the frantic first one.
Pre-Trade NWOG Checklist
Run this list before you act on any touch. A few seconds here filters most impulsive entries. Treat any unchecked box as a reason to wait for a cleaner read.
- Chart timezone set to New York, with Friday 16:59 and Sunday 18:00 confirmed.
- Gap box drawn between the two prices, with the 50 percent line added.
- Higher-timeframe bias marked on the daily and four-hour charts.
- Gap position noted as an overhead draw or an underlying draw.
- A lower-timeframe trigger present at the edge or midpoint before entry.
- Stop placed beyond the reaction swing, target set at the gap or the next pool.
- Session window checked so the trade runs during active hours.
Honest Limitations: When the NWOG Fails
Study the failure case as hard as the winner. Here is a common one. An unfilled gap sits overhead, price rallies toward it, and everything looks textbook. Then price reaches the lower edge and, instead of reacting, tears straight through the whole band without a pause. The chart below shows that clean break.

What went wrong? Usually strong momentum or news. A powerful trend treats a gap as a speed bump, not a wall, and drives right through it. Hence the rule that keeps you safe. Never assume the gap holds; wait for a reaction before you trade against the move. When price slices through with force, stand aside.
News Can Erase a Gap Instantly
News is a second common trap. A Sunday risk event or a Monday data release can gap price far past the level and never return that week. So a NWOG carries less weight around major scheduled news. Check the calendar before you lean on the gap, and lower your trust when a big release looms.
Small Gaps Carry Less Weight
Not every weekend leaves a meaningful void. Quiet weekends often produce a tiny gap of a few pips, which price fills in minutes and forgets. So weigh the size of the gap before you plan around it. A wide, clean gap after an eventful weekend deserves far more respect than a sliver.
Context around the gap matters too. A NWOG that lands inside a strong daily trend and near a fresh order block carries more pull than one floating in the middle of a range. So read the gap in its setting, not in isolation. When the void agrees with structure, bias, and timing, the level rises from a curiosity to a genuine weekly plan. So weight each gap by its surroundings before you ever place a single order around it.
No Fixed Success Rate Exists
Be blunt here. No reliable success percentage exists for the NWOG, and anyone quoting one is guessing. Outcomes hinge on your bias, your timing, and your discipline at the level. Qualitatively, gaps traded in the direction of the daily trend hold up far better than counter-trend fades. That direction of effect is the only honest claim worth making.
Related SMC Concepts to Study Next
A sensible study order helps here. First, mark the NWOG on a few past weekends and watch how price treated each one. Then add bias and session timing, and only then trade the level live with small size. So build the habit slowly, one weekend at a time, rather than forcing every gap into a trade.
The NWOG sits inside a family of time-based references worth your next reading hour. The weekend void mirrors the daily void, and both draw price back toward balance. A weekly bias frames which edge price should chase, while the session clock tells you when the move is likely to fire. Master the gap, the bias, and the timing together, and each new week starts with a clear map instead of a blank chart.
One more routine cements the skill. Each Sunday, mark the fresh gap before the London open, then note in a journal where price sat relative to it. Over a month you build a record of which gaps drew price back and which broke on momentum. So the level stops feeling abstract and starts guiding your weekly plan with real evidence behind it.
FAQ
What is the new week opening gap in simple terms?
It is the price void between Friday’s close at 16:59 and Sunday’s open at 18:00, both in New York time. Price often returns to fill or respect that gap. So it acts as both a magnet and a support-and-resistance zone.
What times define the NWOG?
The gap runs from Friday’s 16:59 New York close to Sunday’s 18:00 New York open. Set your chart timezone to New York so both candles land correctly. A wrong timezone shifts the level and ruins the read.
How do I trade toward the gap?
Set your bias first, then treat an unfilled gap as a draw in that direction. If the trend points up and a gap sits overhead, a long can target the gap. Take profit into the void rather than beyond it.
Does the gap always get filled?
No, gaps do not always fill, and strong momentum can leave one open for weeks. So treat the fill as a tendency, not a rule. Wait for a reaction at the level rather than assuming price must return.
How is the NWOG different from a regular fair value gap?
A fair value gap forms from a three-candle imbalance during trading. A NWOG forms from the weekend halt between Friday and Sunday. Both act as voids that price tends to revisit, yet the NWOG is fixed to a weekly time.
Can I rely on the NWOG by itself?
No single level should stand alone. Pair the gap with higher-timeframe bias, session timing, and a lower-timeframe trigger. Always manage risk on every trade. Results are not guaranteed; past performance is not indicative of future results.
External references
- For background on this concept, see Weekend Effect at Investopedia.
- For broader market context, see Gap Trading at Corporate Finance Institute.

About the author
Written by Dominic Walsh, a Forex trader and MT4/MT5 indicator, Expert Advisor and script developer. Every tool on forexmt4systems.com is tested on live charts before release and ships with ready-to-use compiled MT4 (.ex4) and MT5 (.ex5) files. Learn more about the trader and developer behind this site.
How we build, test and correct every tool: Editorial & Testing Policy. Trading carries risk; see the disclaimer.