
An order block indicator TradingView traders can actually audit needs two rules: one for structure and one for the block. Also, order Block Mitigation Profiler uses confirmed swing pivots for the first. A close through the last pivot marks a break of structure. Indeed, it then walks back up to ten bars to find the last opposing candle, and turns that candle into a zone with a lifecycle you can track.
It is free and open source. Still, you can add it to any chart from the Order Block Mitigation Profiler script page on TradingView, and the full Pine source is published there for you to read.
What Order Block Mitigation Profiler plots on the price chart
The script draws one live bullish zone and one live bearish zone as shaded boxes. Thus, each box spans the order block candle’s high and low, then extends twenty bars forward. Fresh untouched blocks tint the chart background. Hence, arrows print below or above the bar with OBM text, backed by two softer glow layers. The signal bar takes the buy or sell color. Next, an eight-row dashboard in the top right reports block status, both zone prices, total blocks formed, ATR, position state and bars since the last signal.

How Order Block Mitigation Profiler is built
Structure first, then the block
Pivots come from ta.pivothigh and ta.pivotlow with a length of 8 bars on each side. Then, the script stores the most recent confirmed pivot high and pivot low. A bullish break of structure fires when close clears that stored pivot high while the previous close sat at or below it. Yet, the bearish case mirrors it exactly.
The block itself is the origin candle. On a bullish break, the script scans back up to ten bars for the first bearish candle it meets, then takes that bar’s high and low as the zone. One size filter applies. Truly, the move from the zone low to the breaking close must span at least 1.0 times ATR(14). Small drifting breaks fail it.
Each zone then runs a three-state lifecycle. Plainly, state one means open and untouched. State two means price traded back inside it. Also, state three means mitigated, which by default needs a close through the far edge rather than a wick. The Mitigate on Close toggle switches that to wick-through.
Two entry modes, and which one runs by default
The name says mitigation, but the default entry rule does not fire on the retest. Indeed, a fresh block sets a directional bias instead. That bias holds until price mitigates the block or an opposing block forms. Still, inside a bullish bias, a close crossing above the 9-bar EMA triggers a buy. Inside a bearish bias, a close crossing under it triggers a sell.
Retest-Only Mode switches to the strict version. Thus, turn it on and signals fire only when price trades back into a still-fresh zone, which is the classic reading and a much rarer event. The default leaves it off, because the EMA reclaim keeps signal cadence usable on intraday charts.
Three gates apply in either mode. Hence, a position-state flag blocks a second buy while the last signal was a buy. A five-bar cooldown spaces signals out. Next, and barstate.isconfirmed holds every signal until the bar closes. An optional session filter, off by default, can restrict signals to a window such as 0800-1700.
How to read the signals
Start with the box, not the arrow. Then, the zone marks where the move that broke structure began. The background tint tells you the block is still fresh. Yet, once the dashboard status leaves BULL OB OPEN or BEAR OB OPEN, that zone has already done its work.
Then check which mode you run. On defaults, an arrow means the bias is bullish and price just reclaimed the 9 EMA, and that can happen well away from the box. If you want arrows only at the zone edge, switch on Retest-Only Mode and accept far fewer of them.
Pivots need 8 bars on each side to confirm. Truly, so the structure the script reacts to is always at least 8 bars old by the time it registers, and a zone can appear well after the impulse that formed it. Signals themselves wait for the close and never move afterwards.

Every Order Block Mitigation Profiler setting explained
The script exposes 17 inputs, grouped in the settings panel exactly as shown below. Defaults are the published values.
Structure
| Setting | What it does | Default | Range |
|---|---|---|---|
| Pivot Length | Bars each side for swing pivot confirmation. Larger = stronger structure. | 8 | 2 to 30 |
| OB Search Lookback | Bars scanned back from the BOS to find the last opposing candle. | 10 | 2 to 30 |
| Min Impulse x ATR | The BOS impulse leg must span at least k x ATR to qualify. | 1.0 | 0.2 to 5.0 |
| ATR Length | Sets the atr length used in the calculation. | 14 | 5 to 50 |
| Mitigate on Close | On = block mitigated when close passes through. Off = wick through. | on | on / off |
Signal Logic
| Setting | What it does | Default | Range |
|---|---|---|---|
| Entry Reclaim EMA | Within an active OB bias, signals fire when close reclaims this EMA – keeps cadence high. | 9 | 2 to 50 |
| Retest-Only Mode | On = strict ICT (only the first OB retest fires, rare). Off = regime + EMA reclaim (frequent, default). | off | on / off |
| Cooldown Bars | Sets the cooldown bars used in the calculation. | 5 | 1 to 40 |
Filters
| Setting | What it does | Default | Range |
|---|---|---|---|
| Restrict to Session | Only allow signals inside the session window below. | off | on / off |
| Session Window | Controls session window. | 0800-1700 | |
| One Signal per Block | Fire only on the first retest of each block. | on | on / off |
Visual
| Setting | What it does | Default | Range |
|---|---|---|---|
| Show OB Zones | Toggles show ob zones on the chart. | on | on / off |
| Show Dashboard | Toggles show dashboard on the chart. | on | on / off |
| Show 3-Layer Glow | Toggles show 3-layer glow on the chart. | on | on / off |
| Buy Color (Teal) | Colour used for buy color (teal). | #26a69a | |
| Sell Color (Red) | Colour used for sell color (red). | #ef5350 | |
| Dashboard BG | Colour used for dashboard bg. | color.new(#04141a, 18) |
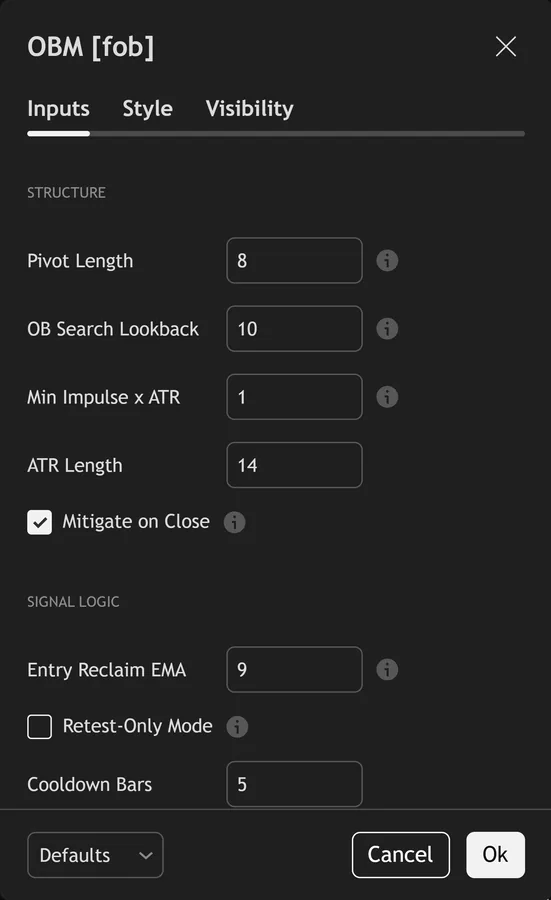
Alerts built into Order Block Mitigation Profiler
The script ships 15 alert conditions. Plainly, open the alert dialog on the chart, pick the indicator as the condition source, then choose the event you want. Alerts fire on the close of the bar, so they follow the same confirmed-bar rule the on-chart signals use.
- OBM Buy
- OBM Sell
- OBM Any Signal
- OBM Bull BOS
- OBM Bear BOS
- OBM Bull OB Formed
- OBM Bear OB Formed
- OBM Bull Mitigated
- OBM Bear Mitigated
- OBM Bull Retest
- OBM Bear Retest
- OBM Structure Break
Other markets and timeframes
The two filters that matter both stay relative. Also, the script measures impulse size in ATR, and the entry trigger is an EMA of the same chart. Nothing reads volume, and nothing assumes a pip value. Indeed, so the defaults transfer to indices, crypto, gold and stocks. Pivot length is the one input worth adjusting. Still, eight bars each side describes a real swing on H1 forex, yet it can read too coarse on a slow daily chart and too fine on a one-minute one.

Limitations worth knowing
The script keeps only one bullish and one bearish zone alive. Thus, each new break deletes the previous box on that side. So you get no history of stacked untested blocks, and an older zone that price returns to weeks later has already gone from the chart.
The One Signal per Block toggle sits in the inputs but changes nothing in this build. Hence, the five-bar cooldown and the position-state flag do the throttling instead. Switching it off leaves the signals exactly as they were.
This marks entries only. Next, it holds no stop, no target, no sizing and no trend context beyond its own structure rules. It also ranks nothing: a block formed inside a tight range and one formed after a violent displacement look identical once drawn.
Get Order Block Mitigation Profiler on TradingView
Open Order Block Mitigation Profiler on TradingView
If you also trade MetaTrader, the MT4 and MT5 indicator library is available below.
Get the complete indicator library
One email unlocks the full MT4 and MT5 indicator library. Then, this TradingView script stays free on TradingView – the button above adds it to your chart.
Using it alongside MetaTrader
Adding a script on TradingView takes one click, so there is no install step here. Yet, if you want the same idea on MetaTrader, the MT4 and MT5 indicator installation guide walks through copying files into the data folder and attaching them to a chart. You can also browse the full MetaTrader indicator library, the MT4 indicators section, or the other free TradingView scripts published on this profile. For related chart tools see the MT5 indicators section and the forex trading strategies guides.
External references
- Price action trading on Wikipedia
- Limitorder at Investopedia
- Support and Resistance at StockCharts ChartSchool
Frequently asked questions
Does the Order Block Mitigation Profiler repaint?
Signals do not. Truly, both fire on barstate.isconfirmed, and the arrows plot from those gated variables, so nothing appears or vanishes mid-bar. Structure works differently. Plainly, swing pivots need 8 bars each side to confirm, so a zone can only appear at least 8 bars after the candle that formed it.
What counts as mitigation here?
By default, a close beyond the far edge of the zone. Also, a bullish block mitigates when close drops under its low, a bearish block when close rises above its high. Switch Mitigate on Close off and a single wick through the edge does it instead.
Why did a signal fire away from the order block?
Because Retest-Only Mode stays off by default. Indeed, the fresh block sets a bias, then the entry fires on a close crossing the 9-bar EMA inside that bias. Turn Retest-Only Mode on if you want signals only at the zone itself.
Which timeframe works best?
Any single one, since the script holds no request.security call and reads only the chart you load it on. Still, h1 and H4 suit the default pivot length of 8. On a one-minute chart, raise pivot length and the cooldown, or the script maps noise as structure.
How much should I rely on this indicator?
Treat it as one input, not a decision. Thus, it is a chart analysis tool, not trading advice. Test it on your own markets and timeframes before relying on it. Results are not guaranteed; past performance is not indicative of future results.

About the author
Written by Dominic Walsh, a Forex trader and MT4/MT5 indicator, Expert Advisor and script developer. Every tool on forexmt4systems.com is tested on live charts before release and ships with ready-to-use compiled MT4 (.ex4) and MT5 (.ex5) files. Learn more about the trader and developer behind this site.
How we build, test and correct every tool: Editorial & Testing Policy. Trading carries risk; see the disclaimer.