
Crude oil TradingView charts come in several symbols that look alike but are built in different ways, and picking the wrong one skews every level you draw. This guide settles which symbol to use for which job. We compare NYMEX:CL1!, the WTI front-month future, with TVC:USOIL, the CFD-style WTI quote, and we add Brent for context. We also show when crude moves most during the day, and what one day of movement is worth per contract.
Crude oil TradingView symbols: what each one is
Four symbols cover almost every need. Two track WTI, the US grade priced at Cushing, Oklahoma. The other two track Brent, the North Sea grade. The West Texas Intermediate entry on Wikipedia covers the history of the WTI benchmark and its delivery point.
- NYMEX:CL1! is the WTI light sweet crude future, front month. TradingView names it “Light Crude Oil Futures”.
- TVC:USOIL is TradingView’s own WTI quote, titled “CFDs on WTI Crude Oil”.
- NYMEX:BZ1! is a Brent future listed on NYMEX, shown as “Brent Last Day Financial Futures”.
- TVC:UKOIL is the Brent twin of USOIL, again a CFD-style quote.
The “1!” suffix means “the nearest contract, rolled forward for you”. So CL1! is not one contract. Instead, it is a chain of monthly contracts stitched into a single line. On our charts, the label next to the price reads CLX2026. That is the November 2026 contract, because X is the exchange code for November.
How the prices are built: futures, rolls and CFD quotes
A single futures contract expires. So a chart that runs for years must switch from one contract to the next. TradingView explains this in its help note on 1! and 2! continuous futures at TradingView. When the front month nears expiry, the 1! series jumps to the next month. If the two months trade at different prices, the chart shows a step that no trader actually paid.
USOIL instead follows its own method to produce one smooth WTI price. As a result, the two lines agree most days but can split around a roll.
The contract maths is simple. One CL contract covers 1,000 barrels. The minimum price step is one cent, so each tick is worth $10:
tick value = 1,000 barrels × $0.01 = $10 per contract
It follows that a $1.00 move is 100 ticks, or $1,000 per contract. Brent works the same way. ICE lists its Brent contract at 1,000 barrels with a one-cent step, as shown on the Brent Crude Futures specs at ICE.
How we tested
We pulled data from the TradingView web chart and ran every figure ourselves. First, we took NYMEX:CL1! and TVC:USOIL on the daily chart from 21 July 2025 to 25 September 2026. That gave 299 daily bars for each symbol. Next, we compared the two closes bar by bar and measured the gap.
Then we took CL1! on the one-hour chart from 9 September to 28 September 2026, again 299 bars. We grouped those bars by UTC hour and averaged the high-to-low range for each hour. We also built a second profile from the Wednesdays alone, because that is when the US weekly oil report comes out.
Finally, we captured seven charts on 28 September 2026: CL1! daily, weekly and hourly, USOIL daily, BZ1! daily, CL1! with ATR(14) and CL1! hourly with volume. ATR used TradingView’s default RMA smoothing. We placed no trades. Our method follows the site’s editorial testing policy.
Symbol and contract settings at a glance
The table sums up the four symbols and the contract facts we use later.
| Item | NYMEX:CL1! | TVC:USOIL | NYMEX:BZ1! / TVC:UKOIL |
|---|---|---|---|
| Grade | WTI | WTI | Brent |
| Type | Exchange future, front month | CFD-style quote | Future / CFD-style quote |
| Rolls between contracts | Yes, can leave steps | Own smoothing method | BZ1! yes, UKOIL own method |
| Contract size | 1,000 barrels | Set by your broker | 1,000 barrels (futures) |
| Tick and value | $0.01 = $10 | Broker specific | $0.01 = $10 (futures) |
| Real volume | Yes, exchange volume | No exchange volume | BZ1! yes, UKOIL no |
| Best use | Volume, sessions, true futures levels | Matching a CFD account | Brent levels and the WTI gap |
The rule is short: chart the symbol that matches what you trade.
Reading the daily and hourly charts
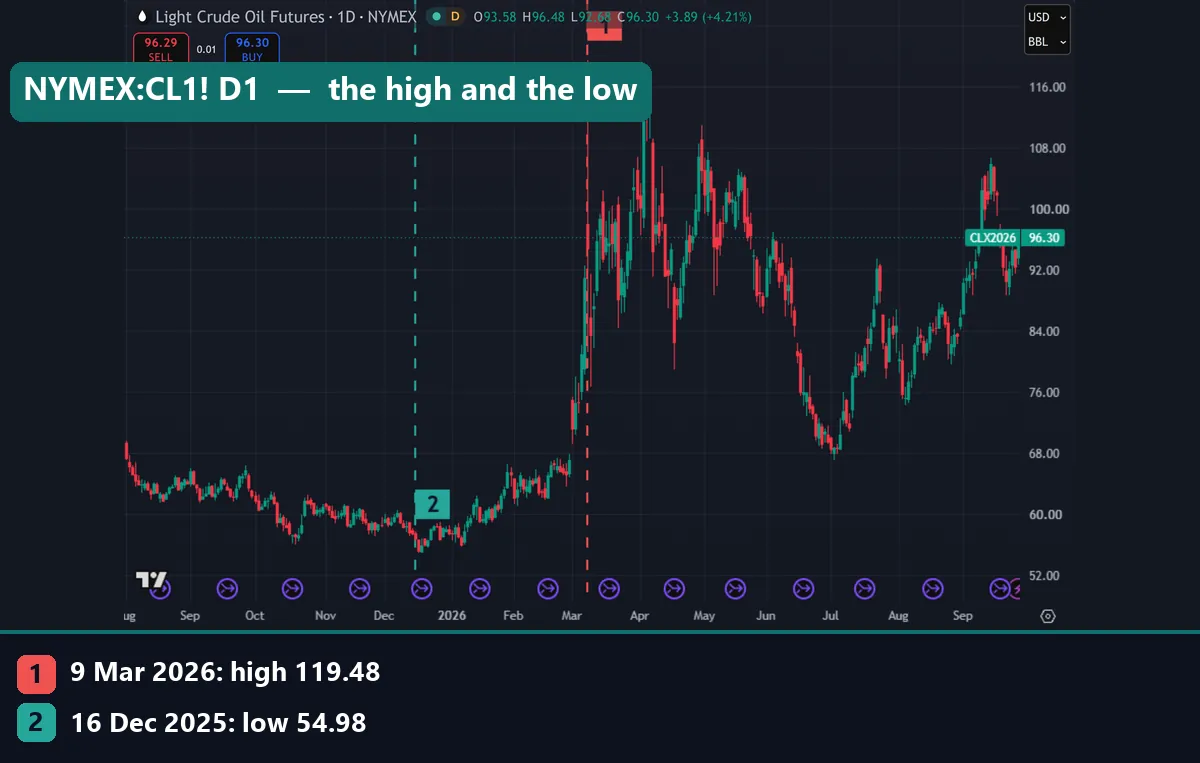
Our first chart shows CL1! daily, about 290 bars. Marker 1 sits on 9 March 2026, the window high at 119.48. Marker 2 sits on 16 December 2025, the low at 54.98. So price more than doubled in under three months, then spent the spring swinging between the high 70s and the 110s.
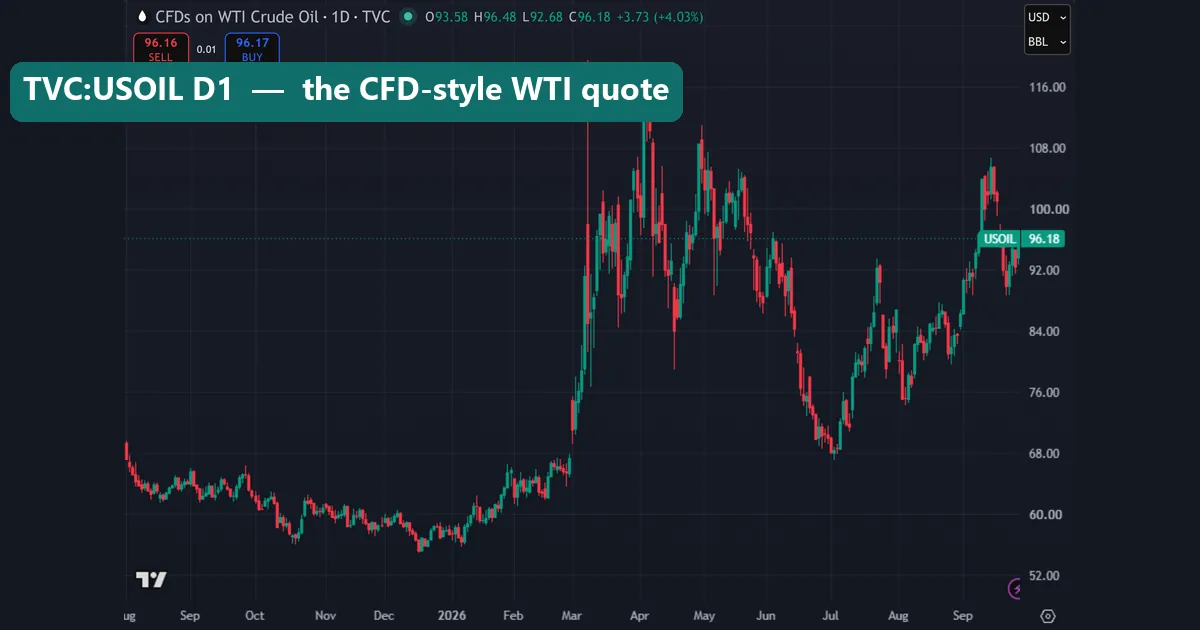
Now compare TVC:USOIL over the same dates. The shape is almost identical, because both lines track WTI. The one clear visual difference is the 9 March bar. On USOIL, that day shows a single tall wick near 119, and it stands out on its own. On the CL1! chart, our marker line runs over the same wick, so it is harder to see there.
The hourly chart gives a very different picture. It covers roughly 21 to 28 September 2026, with prices from about 88.80 to 96.50.
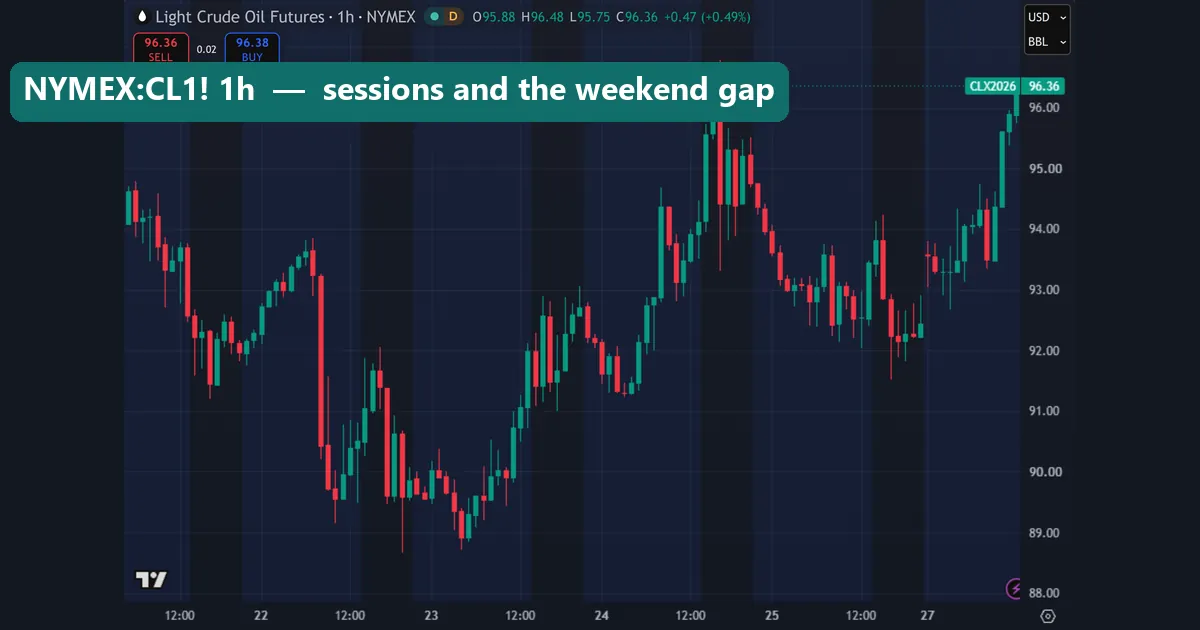
Look at the shaded bands first. TradingView darkens the hours outside the main session, and crude trades nearly around the clock. Then look at the gap before the “27” label. That is the weekend break, and the Sunday reopen follows it. Also note the steep sell-off on 22 September and the rally into 24 September.
Worked example: the future and the CFD side by side
Across 299 bars, CL1! closed on average 0.043 below USOIL, so the mean gap was about four cents. On the last bar, 25 September 2026, CL1! closed at 92.41 and USOIL at 92.45, a gap of 0.04.
However, the largest gap we measured was 9.70. That is most likely a roll: the continuous future stepped from one contract to the next. The CFD quote follows its own method, so it does not take the same step on the same day. For that one bar, a level drawn on one chart would sit almost ten dollars away from the other.
Now turn those gaps into money. A four-cent gap is 4 ticks, or $40 per CL contract. A 9.70 gap is 970 ticks, or $9,700 per contract. The average daily range over our window was $3.57, which is $3,570 per contract. ATR(14) on the last bar read $4.56, or $4,560 per contract.
Finally, the full window spanned $64.50 per barrel, from 54.98 to 119.48. On one contract, that is $64,500.
Brent versus WTI on the same screen
Brent and WTI are two grades of crude from two regions. WTI is priced inland in the US. Brent is a seaborne North Sea blend, and much of the world’s oil trade is priced off it. They usually move together, but the gap between them shifts with shipping, supply and regional demand.
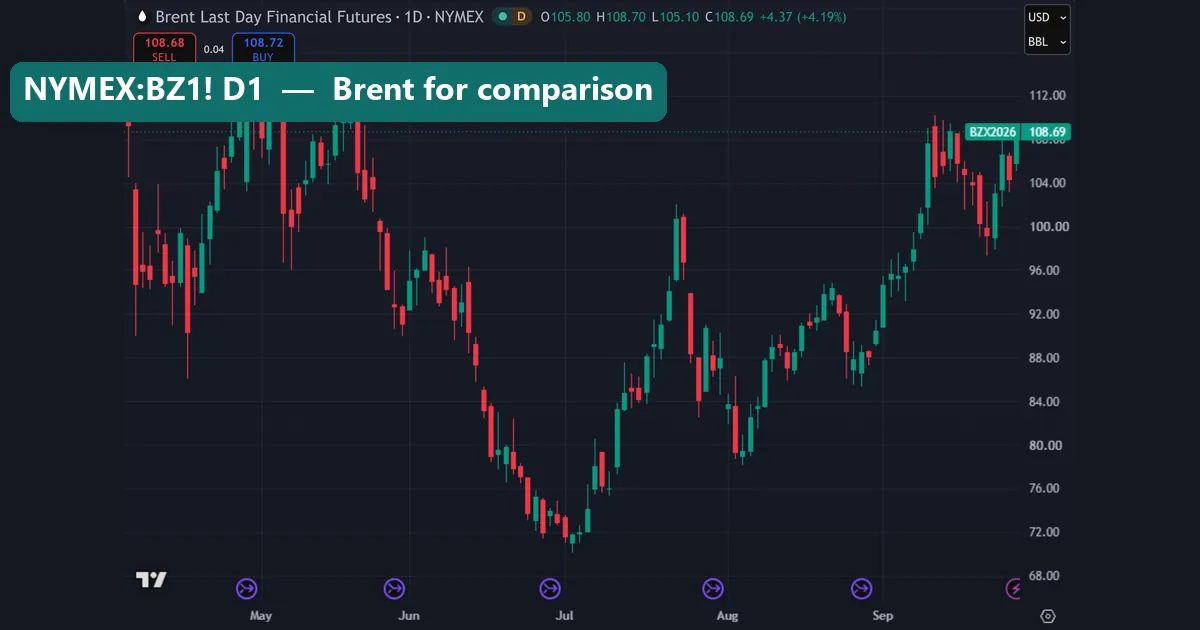
Our Brent chart shows NYMEX:BZ1! on the daily timeframe from May to late September 2026. The contract label reads BZX2026, and the live quote at capture was 108.69. At a similar moment, CL1! showed 96.30. So Brent traded clearly above WTI on our screen. The shape matches WTI closely: a slide into a low near 71 around the start of July, then a climb back above 100 in September.
Use Brent as a cross-check: if WTI breaks a level and Brent does not follow, the move may be local to the US grade. Also, if you trade oil-linked currencies, the guide to commodity currencies and our note on forex and commodity correlations explain how CAD and NOK tend to relate to crude.
Measuring daily movement with ATR
Average true range measures how far price travels per bar, including gaps. Our ATR explainer covers the formula in full. In short, true range is the largest of three values: high minus low, high minus the prior close, and the prior close minus low. ATR(14) then smooths that over 14 bars.
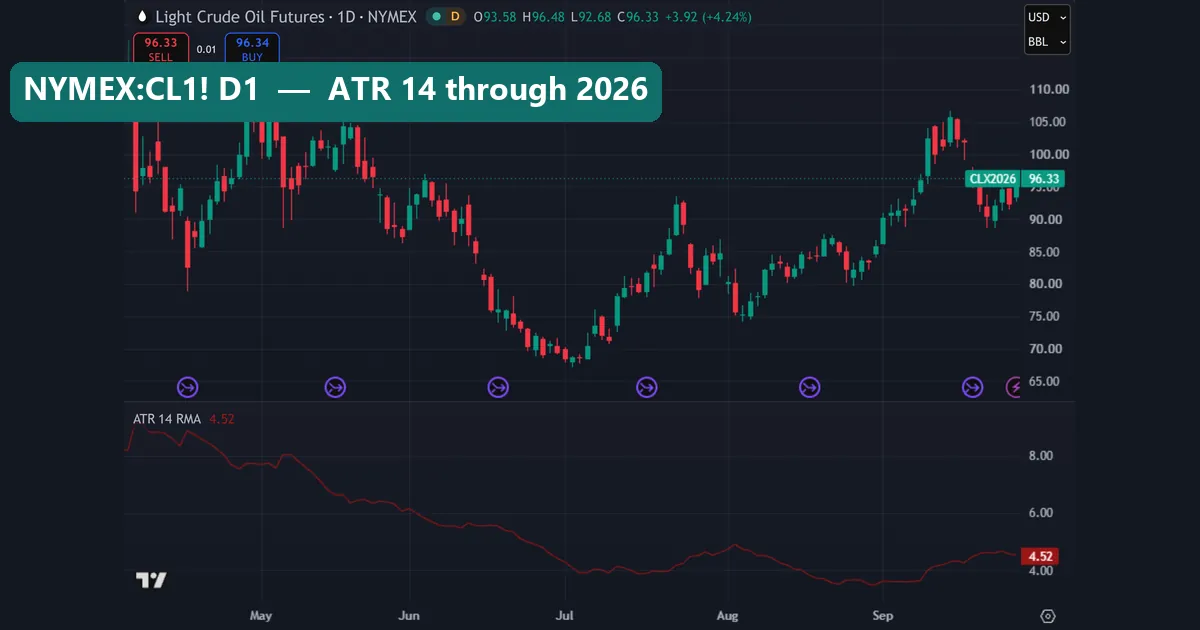
This chart shows CL1! daily with ATR(14) below it. At capture, the ATR panel read 4.52, a touch below our 4.56 figure for the 25 September close, because the live bar was still forming. Now read the line from left to right. In late April, ATR sat above 8. By July it had drifted toward 4, and in late August it dipped below 4. It turned up again in September.
So the same symbol moved about twice as far per day in spring as in late summer. A stop that fit August would be far too tight for April. For a method that scales stops to this reading, see how to use ATR as a stop loss.
Download the complete indicator database
Put these concepts on your charts. One email unlocks the full library of 1,380+ indicators with compiled MT4 and MT5 files, plus my TradingView scripts. No paywall, no spam, unsubscribe any time.
Get free access to my indicator database
One email unlocks 1,380+ free MT4, MT5 and TradingView indicators — the complete library. No single-tool download; you get the whole database.
Where it fails
- Roll steps are not moves. Our 9.70 gap shows how far a continuous future can jump from a contract switch alone. Indicators read that step as price action, so ATR, moving averages and pattern tools can all misfire around a roll. TradingView offers a back-adjust option for continuous futures, but it changes the history you see, so know which mode you are in.
- USOIL has no exchange volume. A CFD-style quote cannot show how many contracts traded. Use CL1! for any volume work.
- Your broker’s feed is not TVC. Your platform may quote a different price, a different spread and different roll dates.
- Our sample is short. The hourly profile covers under three weeks and only three Wednesdays. It shows a pattern for that window, not a rule for every month.
- Averages hide spikes. A $3.57 average daily range includes quiet days and wild ones. March showed how far crude can outrun it.
The busiest hours and the Wednesday report
Crude does not move evenly through the day. Our hourly profile for CL1! shows a clear pattern in UTC. The widest average bar came at 16:00 UTC, about $1.48. The 08:00 UTC hour was also busy, at about $1.31, as Europe opened. By contrast, the 23:00 UTC hour averaged only about $0.41, and 04:00 UTC about $0.48. Also, the data had no 21:00 UTC bar at all, which fits the daily pause in futures trading.
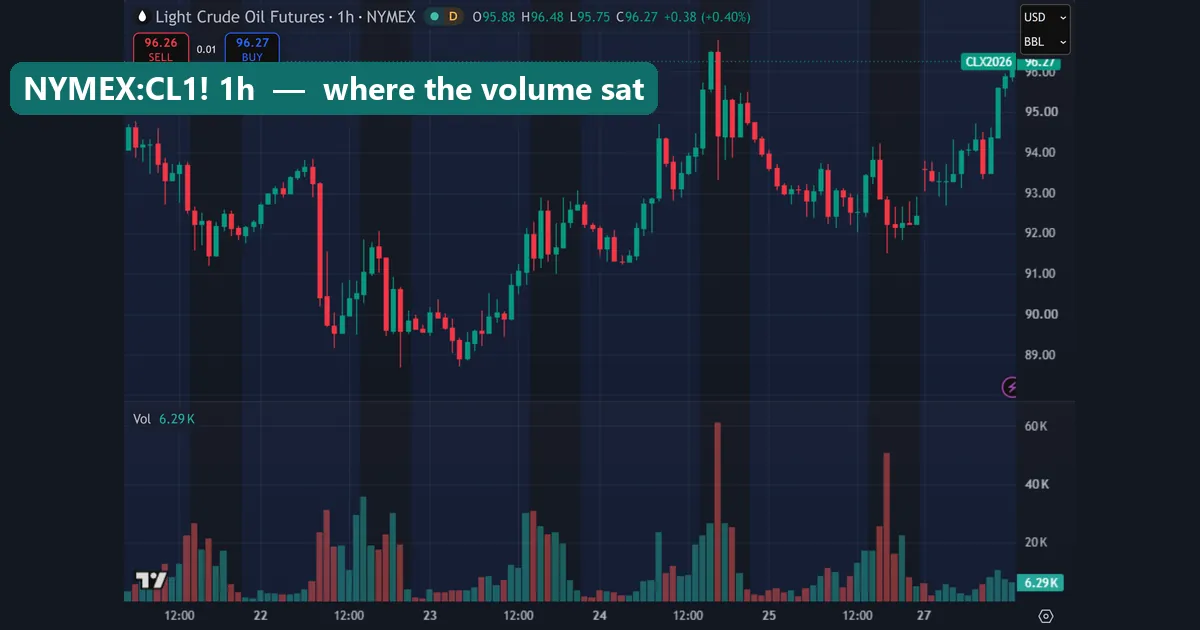
This chart adds volume to the hourly CL1! view from roughly 21 to 28 September. Most bars sit under 20K contracts. The tallest spike, near 60K, lands on 24 September, just after the rally top. A second spike near 50K lands on 25 September. So the big volume came with the big turns, not with the quiet drift.
Next, the Wednesdays. The US Energy Information Administration releases its weekly petroleum report at 10:30 a.m. Eastern on Wednesdays, per the EIA weekly petroleum release schedule. In September that is 14:30 UTC. On our three Wednesdays, the 14:00 UTC bar averaged $1.26 and the 15:00 UTC bar $1.32, the two widest hours of the day. The 13:00 UTC bar averaged only $1.01, so the range bunched up around the report. The New York trading session guide and our forex time zone converter help you map these UTC hours to your own clock.
The weekly chart for context
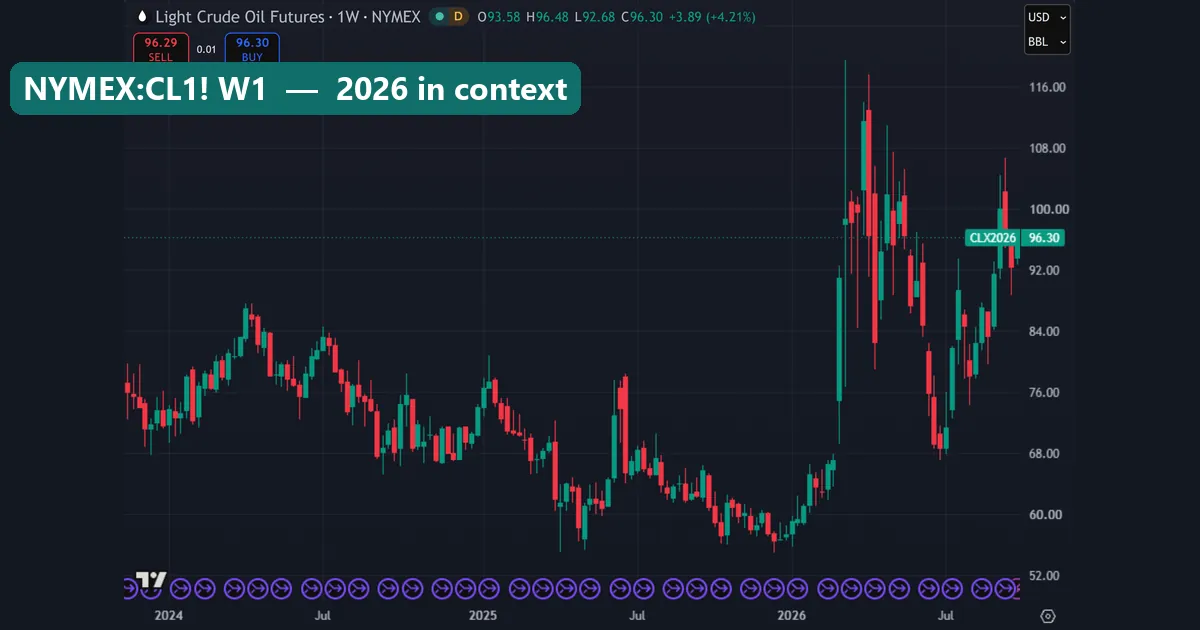
This chart shows CL1! weekly from early 2024 to late September 2026. Through 2024 and 2025, price mostly stayed between about 60 and 88. Then, in early 2026, the weekly bars broke out hard and wicked to near 119 in March. After that, a drop took price back to the high 60s by late June, before the climb to the mid 90s.
For a structured way to stack timeframes, see our guide to multi-timeframe analysis.
Common mistakes
- Mixing symbols on one plan. Traders draw levels on CL1! and then trade a CFD, or the reverse. On most days the gap is a few cents. Around a roll, it can be several dollars. So pick one symbol per plan.
- Reading volume on USOIL. A CFD-style quote has no exchange volume. For real contract counts, use CL1!, and read our note on open interest versus volume.
- Sizing crude like a currency pair. One cent is $10 on a full contract, and an average day covered $3.57. Therefore a stop that feels small in dollars per barrel can be large in account terms. Check the differences between forex and futures before you size a trade.
- Ignoring Wednesday at 10:30 ET. Our Wednesday data showed the widest bars right around the EIA release. Entering just before it, with a tight stop, exposes you to the fastest hour of the week. A quick look at the economic calendar avoids this.
Where to go next
Start with the sessions. Our forex trading sessions guide and the London session guide explain why the 08:00 UTC hour woke up in our data. Next, plan your exits. The risk reward tool on TradingView lets you measure a trade in ticks before you place it. For volume reading on CL1!, try our page on volume spread analysis.
FAQ: crude oil on TradingView
Which crude oil symbol should I use on TradingView?
Use NYMEX:CL1! if you trade WTI futures or want real volume, and use TVC:USOIL if you trade a WTI CFD and want a smooth line.
Why do CL1! and USOIL show different prices?
CL1! is the front-month future and rolls between contracts, while USOIL follows its own method, so they averaged 0.043 apart in our data but split by up to 9.70 once.
What does CLX2026 mean on the chart?
It names the contract CL1! is showing right now: CL for WTI crude, X for November and 2026 for the year.
How much is one tick of crude oil worth?
One CL contract covers 1,000 barrels and moves in one-cent steps, so each tick is worth $10 and a $1.00 move is worth $1,000.
What is the difference between Brent and WTI?
WTI is a US grade priced inland at Cushing, while Brent is a seaborne North Sea blend, and in our capture Brent traded clearly above WTI.
When does crude oil move the most during the day?
In our September sample, the widest hourly bars came at 16:00 UTC and 08:00 UTC, and the quietest came late in the Asian hours.
Why does crude move more on Wednesdays?
The EIA releases its weekly petroleum report at 10:30 a.m. Eastern on Wednesdays, and our three Wednesdays showed the widest bars at 14:00 and 15:00 UTC.
Can I trade from these crude oil charts alone?
No chart setup removes risk, since crude moved $3.57 on an average day in our window and far more around news; results are not guaranteed; past performance is not indicative of future results.
Last updated: 28 September 2026.

About the author
Written by Dominic Walsh, a Forex trader and MT4/MT5 indicator, Expert Advisor and script developer. Every tool on forexmt4systems.com is tested on live charts before release and ships with ready-to-use compiled MT4 (.ex4) and MT5 (.ex5) files. Learn more about the trader and developer behind this site.
How we build, test and correct every tool: Editorial & Testing Policy. Trading carries risk; see the disclaimer.