
CFDs, or contracts for difference, let you trade the price of an index, a metal or a currency pair without owning it. You and a provider agree to settle the change in price between your open and your close, in cash. This guide settles four things: what you hold, what you pay, which rules protect retail traders in the EU and UK, and how far index CFDs jumped over weekends in our data.
What CFDs actually are
A CFD is a contract between two parties, usually you and a broker. If you buy and the price rises, the provider pays you the difference. If it falls, you pay the provider. Selling first works the same way in reverse, so going short takes one click, just like going long.
You own nothing underneath. A gold CFD holds no metal, and a share CFD gives you no vote at the company. The contract for difference article on Wikipedia traces modern CFDs to London in the early 1990s. Hedge funds used them to hold UK shares on a small margin and, with no shares changing hands, to avoid stamp duty. Retail firms picked them up in the late 1990s.
Most CFDs trade over the counter, not on an exchange. Your provider sets the quotes and may take the other side of your trade, as our guide to A-book and B-book brokers explains. The same Wikipedia article notes that US regulators do not allow CFDs.
Many MT4 and MT5 brokers list gold, stock indices and even currency pairs as CFDs. So on MetaTrader, you may already hold CFDs without calling them that.
How a CFD works: margin, spread and financing
Three numbers decide what a CFD costs you. The first is margin, the deposit the provider locks while the trade runs. MetaQuotes gives the formula for leveraged contracts in its MetaTrader 5 help page on margin calculation:
margin = lots x contract size x open price / leverage
profit or loss (long) = (close price - open price) x contract size x lots
So at 20:1 you post 5% of the position’s value, and a 1% price move changes your equity by 20% of that margin. Our pages on leverage in forex and margin in forex walk through the same maths.
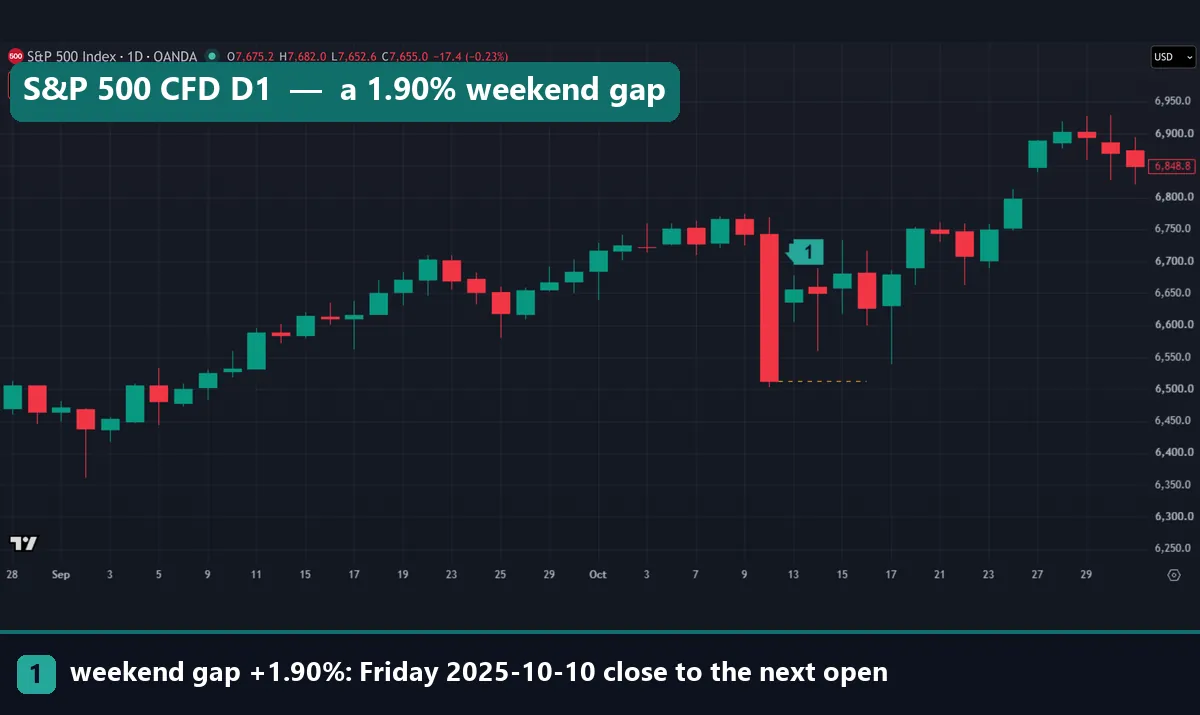
The second number is the spread, the gap between the sell and the buy price. You pay it as soon as you enter. Our first chart shows it in the two boxes at the top left. At capture the S&P 500 CFD read 7,654.7 to sell and 7,655.2 to buy, a spread of 0.5 index points. Some providers add a commission as well. Our page on spread in forex shows why it shifts during the day.
The third is overnight financing. Hold a CFD past the provider’s daily cut-off and you pay, or sometimes receive, a charge on the full position value, not just the margin. For index and commodity CFDs it usually tracks a benchmark interest rate plus a markup. On currency pairs it reflects the two interest rates, and MT4 calls it the swap, as our swap in forex guide explains.
Who regulates CFDs, and the leverage limits
In the EU, the European Securities and Markets Authority set the baseline. In March 2018, ESMA’s press release on restricting CFDs listed five measures for retail clients:
- leverage limits from 30:1 down to 2:1, set by how volatile the underlying is;
- a margin close-out rule: the provider must close positions when your margin falls to 50% of the minimum required;
- negative balance protection on a per-account basis;
- a restriction on incentives to trade;
- a standard risk warning that states the share of the provider’s retail accounts that lose money.
The same release gives the reason. National regulators’ analyses found that “74-89% of retail accounts typically lose money on their investments”. That range is the regulators’ finding, not ours.
ESMA could only impose temporary measures, three months at a time. In the UK, the FCA’s July 2019 press release made the same limits permanent from 1 August 2019. It also says a client cannot lose more than the total funds in their CFD account. Its notes add that the rules cover spread bets and rolling spot forex, so a retail MT4 forex account with a UK firm falls under them.
Two limits apply. The rules protect retail clients only, so a client classed as professional falls outside them. They also bind only authorised firms, and an offshore company under the same brand can offer far higher leverage and none of these protections. Our pages on negative balance protection and forex regulatory bodies show how to check which firm holds your account.
How we tested
We pulled daily OANDA bars on a TradingView web chart for five index CFDs: S&P 500 (SPX500USD), US Nas 100 (NAS100USD), US Wall St 30 (US30USD), Germany 30 (DE30EUR) and UK 100 (UK100GBP). For comparison we added gold (XAUUSD), EUR/USD and GBP/USD. Each series starts between 19 and 28 August 2025 and ends on 23 October 2026. That gives about 300 daily bars and 62 weekends per symbol. We took the screenshots on 23 October 2026.
Two numbers came out of each series. The daily range is the high minus the low, as a percent of price. The weekend gap is the move from Friday’s close to the next open, also in percent. We report medians, so one wild week does not skew the picture, and we add the single largest gap.
For a longer FX view, we used MetaTrader 4, build 1471, with Capital Point Trading history: 23 currency pairs on daily bars, from 12 June 2018 to 24 August 2026. Start dates differ by pair, so each pair has between 59 and 420 weekends, 7,646 in total. There we sized each gap in units of the pair’s daily ATR(14), so quiet and busy pairs compare fairly. Every figure is a price measurement before spread, swap and commission. Our editorial testing policy sets out how we pull and check data.
CFD contract terms and the leverage caps
Every CFD has a specification sheet. In MetaTrader 4, right-click the symbol in Market Watch and choose Specification. Check the contract size, the swap for long and short trades, the day the swap counts triple, and the trading sessions. Then check the margin against the ESMA tiers below.
The last column turns our data into margin terms. It shows a median day’s range as a share of the margin you post at the cap.
| ESMA tier (retail) | Max leverage | Minimum margin | Median day as a share of margin (our data) |
|---|---|---|---|
| Major currency pairs | 30:1 | 3.33% | EUR/USD 14.7%, GBP/USD 16.2% |
| Non-major pairs, gold, major indices | 20:1 | 5% | gold 40.4%; index CFDs 20.2% to 31.8% |
| Other commodities, non-major indices | 10:1 | 10% | not measured |
| Individual shares, other | 5:1 | 20% | not measured |
| Cryptocurrencies | 2:1 | 50% | not measured |
The maths is simple: median range times leverage. For example, the US Nas 100 CFD moved 1.59% on a median day, and 1.59 x 20 gives 31.8% of margin. Your provider may set a lower cap than ESMA’s, so the margin your platform shows is the final word.
Reading a weekend gap on a CFD chart
Each price chart here marks one weekend. The yellow dashed line is Friday’s close, carried to the right, and the numbered marker sits on the first bar after the weekend. The space between that bar’s open and the line is the gap. Note that the price header and the sell and buy boxes show the live quote on 23 October 2026, not the bars in view.
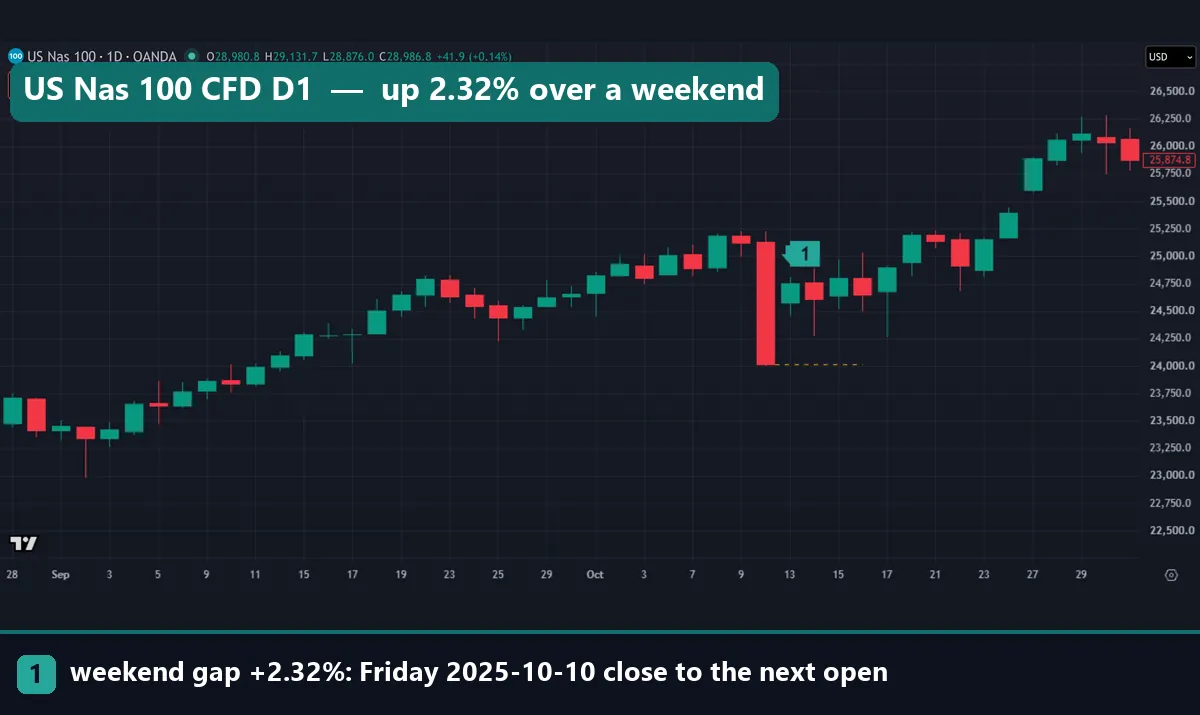
On the US Nas 100 CFD, Friday 10 October 2025 closed at 24,018.5 after a long red day. The next bar opened at 24,575.8, so the price jumped 2.32% while the market slept. That was the largest of its 62 weekends in our window. The S&P 500 CFD in the first image shows the same weekend: 6,513 to 6,636.7, up 1.90%.
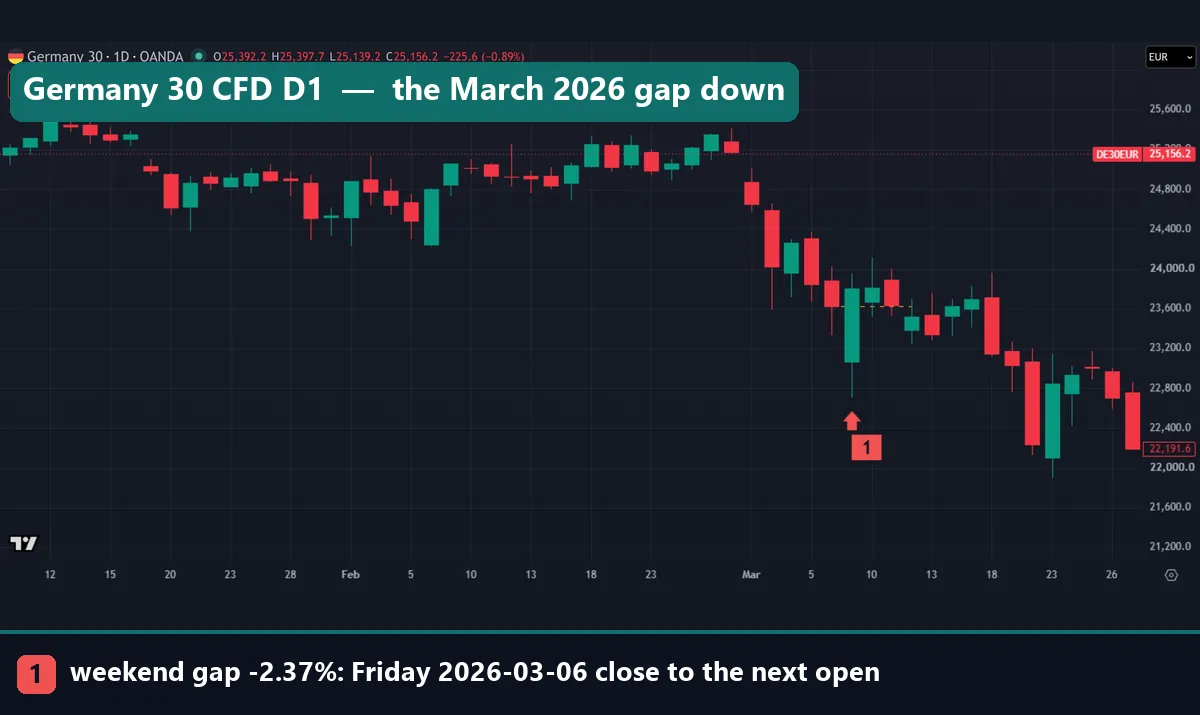
The Germany 30 CFD shows the other side. Friday 6 March 2026 closed at 23,628.2, and the next bar opened at 23,068.1, 2.37% lower. Then the Monday candle rallied and closed back above the dashed line. So the gap filled within a day, yet anyone long over the weekend still took the full drop at the open.
Worked example: the Germany 30 gap at 20:1
Here is the arithmetic for a long position of one euro per point, opened at that Friday close. If your provider treats the index as major, the retail cap is 20:1.
- Position value: 23,628.2 points x 1 euro = 23,628.20 euros.
- Margin at 20:1: 23,628.20 / 20 = 1,181.41 euros.
- Gap: 23,628.2 – 23,068.1 = 560.1 points, so 560.10 euros gone at the open.
- Share of margin: 560.10 / 1,181.41 = 47.4%. The shortcut gives the same answer: 2.37 x 20.
- Equity left if the account held only that margin: 1,181.41 – 560.10 = 621.31 euros, or 52.6% of the margin.
That last line sits just above ESMA’s 50% close-out level. A slightly bigger gap would have closed the position at the open, at whatever price the market offered. Even a stop-loss would not have helped. A sell stop placed between the two prices triggers at the first price after the weekend, and here that price was near 23,068.1.
Now compare a normal day. The median Germany 30 range of 1.19% equals 23.8% of the margin at 20:1. On EUR/USD at 30:1, the median range of 0.49% equals 14.7%. In other words, a quiet day on an index CFD moves your margin more than a quiet day on EUR/USD, even with lower leverage. Our margin calculator runs the same sums for your own size.
How index CFDs compare with gold and FX
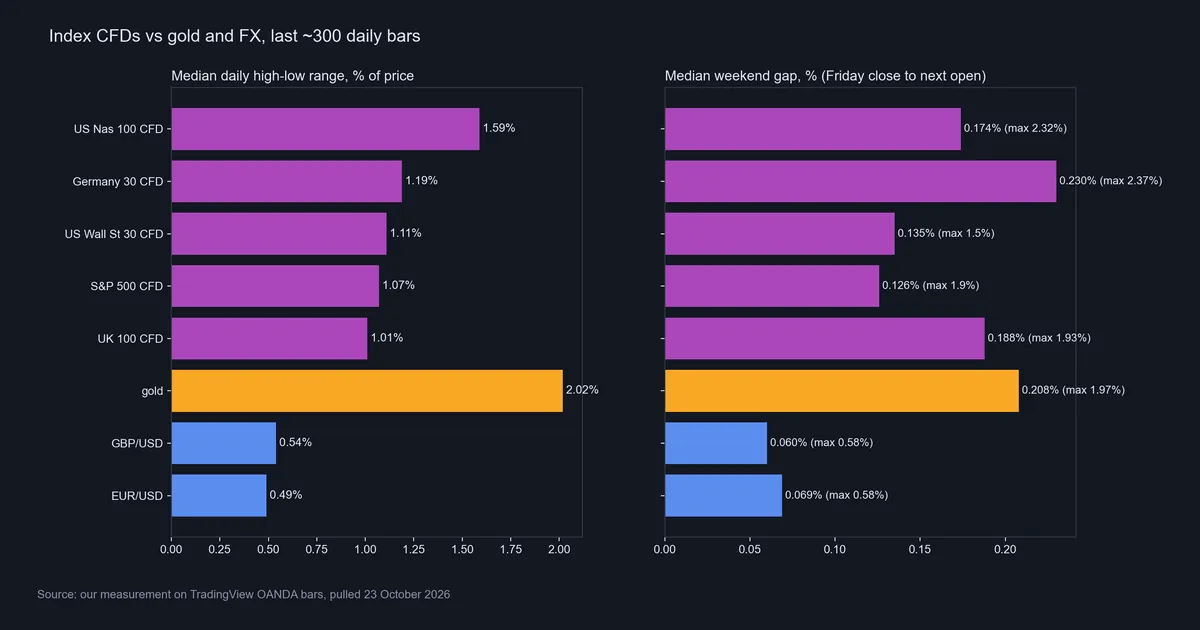
The bar chart above sums up our TradingView measurement. Index CFDs moved 1.01% to 1.59% on a median day, against about 0.5% for EUR/USD and GBP/USD. Gold moved most, at 2.02%. Median weekend gaps ran from 0.126% on the S&P 500 to 0.230% on the Germany 30, while the two FX pairs sat near 0.06% to 0.07%.
Scaled by each market’s own daily range, the US indices gapped by an eighth to a ninth of a median day, much like the FX pairs. The two European indices gapped by close to a fifth. We did not test why.
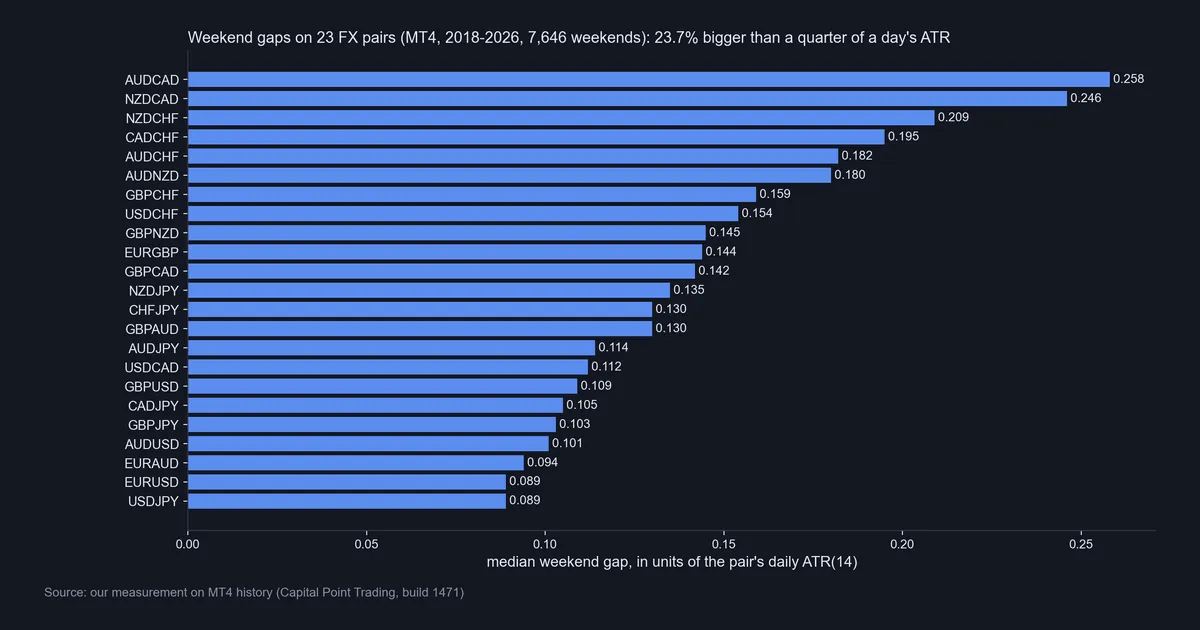
The MT4 chart goes back further, on 23 currency pairs. Across 7,646 weekends, the median gap was 0.132 of a day’s ATR. In all, 23.7% of gaps beat a quarter of a day’s ATR, and 6.4% beat half. EUR/USD and USD/JPY gapped least, at 0.089. AUD/CAD and NZD/CAD topped the list at 0.258 and 0.246, but on only 64 and 59 weekends. Our page on the weekend gap in forex shows how to spot them.
Download the complete indicator database
Put these concepts on your charts. One email unlocks the full library of 1,380+ indicators with compiled MT4 and MT5 files, plus my TradingView scripts. No paywall, no spam, unsubscribe any time.
Get free access to my indicator database
One email unlocks 1,380+ free MT4, MT5 and TradingView indicators — the complete library. No single-tool download; you get the whole database.
Where it fails: what CFDs do badly
First, a stop-loss does not cap your loss over a weekend or a news gap. It turns into a market order at the first price, as the Germany 30 example showed. With 20:1 leverage, the largest index gaps in our window took 30% to 47% of the posted margin in one jump.
Second, financing makes CFDs a poor tool for long holds. The charge runs on the full position value every night. Over months, it can cost more than the spread you paid to get in.
Third, the price is your provider’s price. An index CFD tracks a benchmark but is not the benchmark, and hours, quotes and ranges differ from firm to firm. Our numbers come from one feed, OANDA on TradingView, and may not match yours.
Fourth, your contract sits with one firm, not a clearing house. That firm’s health and its rules matter as much as the chart.
Finally, the odds favour the house in practice. ESMA’s own figure says 74-89% of retail accounts lose money. Our own test has limits too: about 14 months, 62 weekends per symbol, so the largest gaps rest on a handful of events.
One weekend can hit every index at once
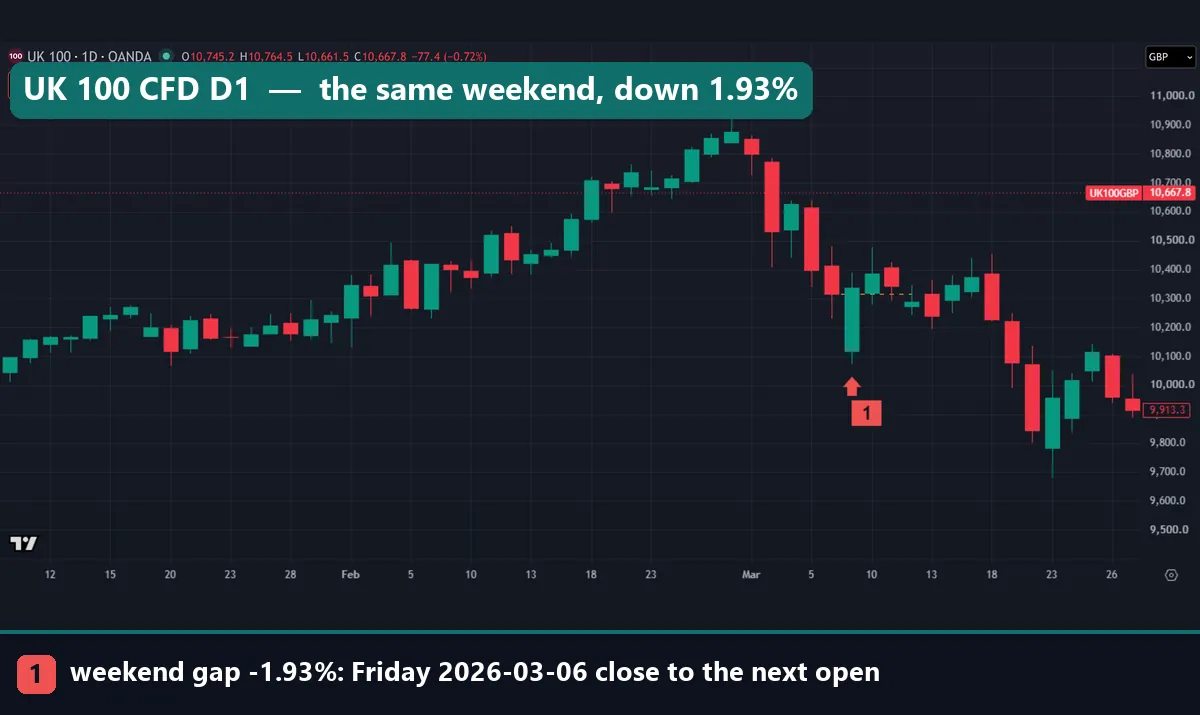
The UK 100 CFD shows the same March 2026 weekend as the Germany 30. Friday 6 March closed at 10,316.6 and the next bar opened at 10,118, down 1.93%. Like the German index, it closed back above the dashed line that Monday, then fell further later in March. That weekend the S&P 500 CFD also opened 1.19% lower and the Wall St 30 CFD 1.24% lower. EUR/USD printed its largest weekend gap of our window then too, at 0.58%.
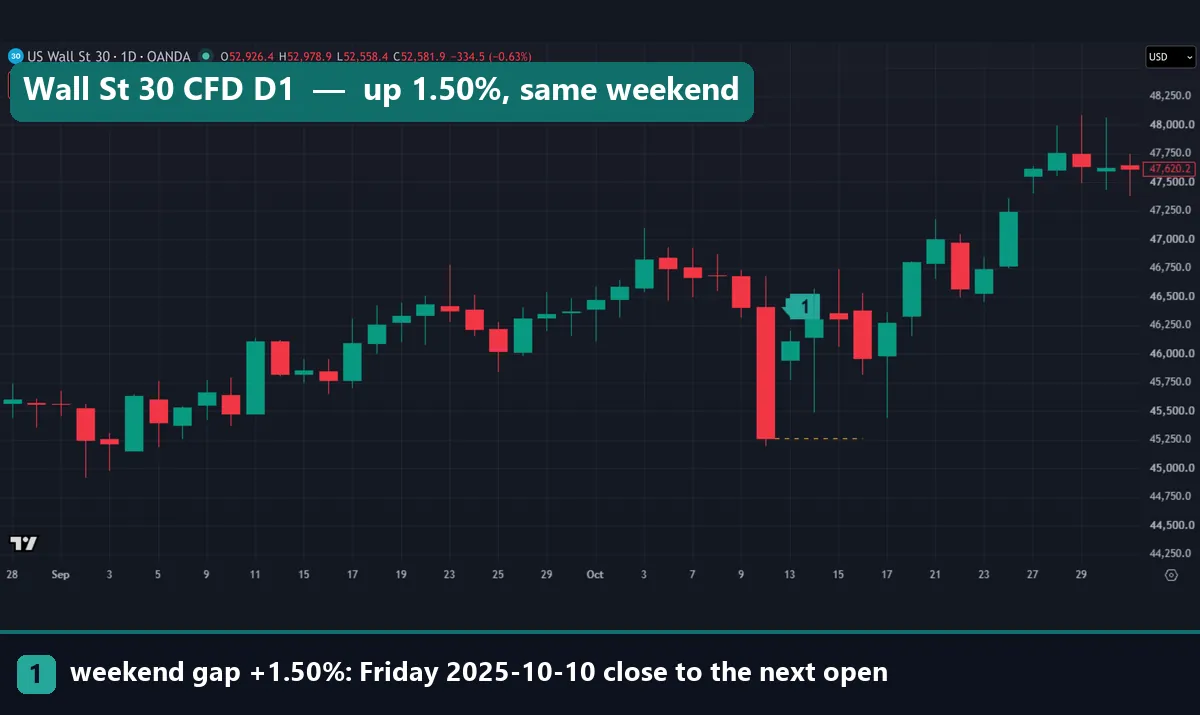
October 2025 ran the other way. The Wall St 30 CFD closed Friday 10 October at 45,263.5 and opened at 45,944.5, up 1.50%, while the S&P 500 and Nas 100 jumped 1.90% and 2.32%. So five index CFDs held over a weekend are closer to one bet than five. Our guide to forex trading on the weekend explains why prices stop and restart.
Common mistakes with CFDs
1. Treating the leverage cap as a target. A 20:1 cap is a ceiling, not a size. Set size from your stop distance and the cash you are ready to lose, as our page on position size vs leverage shows.
2. Ignoring financing on slow trades. A swing trade held for weeks pays a charge every night. Check the swap rates in the symbol specification before you enter.
3. Trusting a tight stop over the weekend. Gaps of 1.5% to 2.4% hit all five index CFDs in our window. A stop inside that distance fills at the open, not at its level.
4. Giving up retail protection for more leverage. Opting up to professional status, or moving to an offshore entity, can remove negative balance protection and the 50% close-out rule.
Where to go next
Before your first CFD trade, learn what a margin call and stop-out mean on your account. Then price a multi-week hold with our swap calculator, and size the trade with the margin calculator above.
For the rules, go to the source. The ESMA and FCA releases linked above set out the limits and protections in the regulators’ own words. The MetaTrader 5 help page lists every margin formula, and the Wikipedia article covers the history and the country-by-country picture.
FAQ about CFDs
What is a CFD in simple terms?
It is a cash bet on a price change, made with a provider. You gain the difference if the price moves your way and pay it if the price moves against you.
Do you own the asset when you trade CFDs?
No. A gold CFD holds no gold, and a share CFD carries no vote. You hold a contract with your provider and nothing else.
Are CFDs allowed in the United States?
No. US regulators do not allow CFDs for retail trading, as the Wikipedia article on contracts for difference notes.
What leverage can retail traders use on CFDs in the EU and UK?
From 30:1 on major currency pairs down to 2:1 on cryptocurrencies. Gold and major indices sit at 20:1, and individual shares at 5:1.
Can you lose more than your deposit with CFDs?
Retail clients of EU and UK firms have negative balance protection, so the loss stops at the funds in the account. Professional clients and offshore accounts may not have it.
Is forex on MT4 a CFD?
Often, yes. Many brokers list currency pairs as CFDs, and the FCA’s rules count rolling spot forex as a CFD.
How big are weekend gaps on index CFDs?
In our OANDA data from August 2025 to October 2026, the median gap ran from 0.126% to 0.230%. The largest was 2.37%, on the Germany 30 in March 2026.
Do most CFD traders lose money?
Regulators say so. ESMA cited national analyses in which 74-89% of retail accounts typically lost money, and UK firms must tell clients their own share. Trade small, with money you can afford to lose; results are not guaranteed; past performance is not indicative of future results.
Last updated: 23 October 2026.

About the author
Written by Dominic Walsh, a Forex trader and MT4/MT5 indicator, Expert Advisor and script developer. Every tool on forexmt4systems.com is tested on live charts before release and ships with ready-to-use compiled MT4 (.ex4) and MT5 (.ex5) files. Learn more about the trader and developer behind this site.
How we build, test and correct every tool: Editorial & Testing Policy. Trading carries risk; see the disclaimer.