
Futures contract vs forward comes down to where the deal lives and who carries the risk. A future trades on an exchange with standard terms and a clearing organization behind it. A forward is a private deal with terms you choose and a counterparty you must trust. Yet both take their price from the same interest rate logic. This guide settles the contract differences from primary sources, then shows that logic on about 7,600 hours of CME currency futures against spot. One limit comes first: we have no forward prices, because forwards trade over the counter. So every gap below is a future against spot.
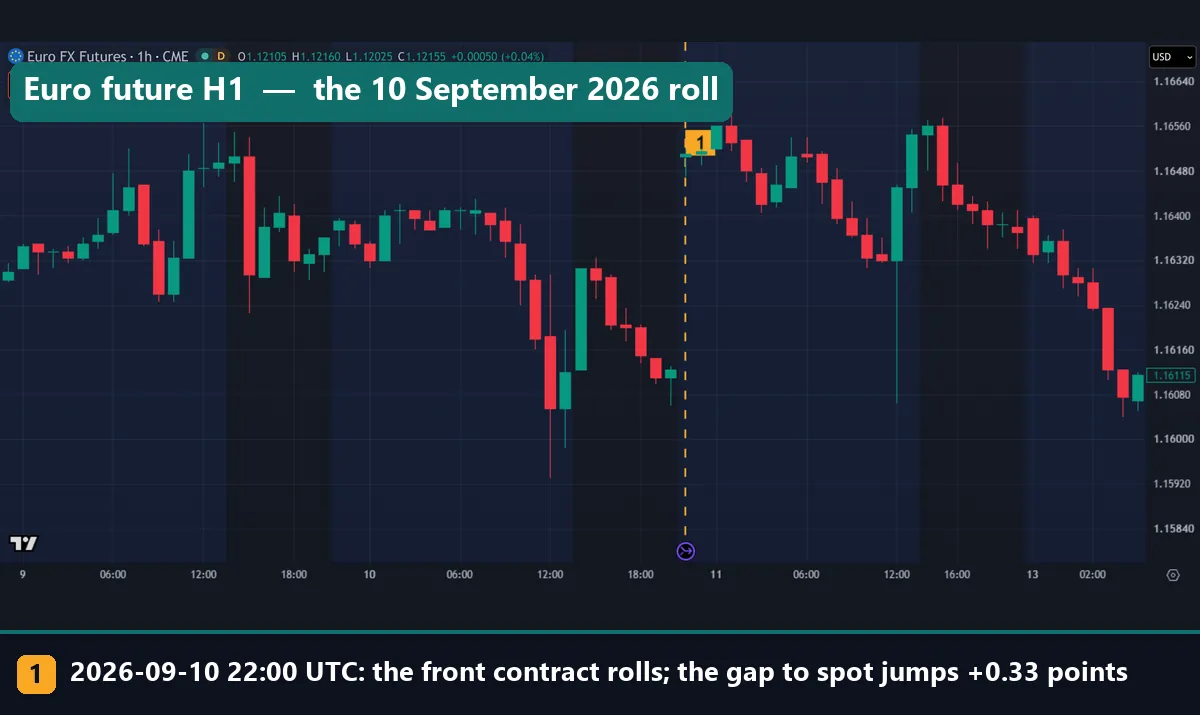
Marker 1 is the hour the continuous euro future moved to its next contract. The price stepped up about 39 pips, yet nothing happened to the euro. That one step holds most of this guide.
What a futures contract and a forward actually are
The CFTC glossary defines both, so we follow its wording. A futures contract is an agreement to buy or sell for later delivery, at a price set at the start. Each side must honor that price. You can end the position by delivery or by offset, and offset just means closing with an equal and opposite trade.
A forward is also a deal for later delivery. However, buyer and seller set the terms themselves, so the CFTC calls them more “personalized” than standard futures. It also has an entry for currencies. A foreign exchange forward swaps two currencies on a set future date, at a fixed rate agreed at the start.
Spot is the third price in this story, and it means immediate delivery and payment. So a future or a forward is a spot price moved ahead in time, and that move has a cost. For the wider comparison, read our guide on the difference between forex and futures.
Four differences that change how you use them
Venue. Futures trade on an exchange. Forwards trade over the counter, which the CFTC defines as not listed on any exchange.
Terms. A future comes in fixed sizes and fixed dates. A forward can match an exact amount and an exact day. So a firm that must pay a bill on one date may prefer it. Our page on hedging in forex covers the general idea.
Cash flow. Futures mark to market. The CFTC describes this as a daily cash flow system, where each session’s gain or loss goes into or out of your account. A plain forward has no such routine in its definition, so the gain or loss can build until the agreed date.
Default risk. Forwards leave each side exposed to the other side failing, in the CFTC’s own account. By contrast, the clearing organization backs futures on a designated contract market against default. In short, a forward swaps daily cash calls for trust in one named party.
How the price is set: covered interest parity
The rule behind the price is covered interest parity. The BIS Quarterly Review article on covered interest parity states it plainly: the rate gap between two currencies should equal the gap between the forward and spot prices. If it did not, a trader could borrow one currency, swap it, lock in the way back and keep the difference.
later price = spot x (1 + quote rate x T) / (1 + base rate x T)
gap to spot (%) is roughly (quote rate - base rate) x T
T = time to delivery, in years
For EUR/USD the base is the euro and the quote is the dollar. So a higher dollar rate puts the later price above spot. In plain words, the currency with the lower rate trades above spot for later delivery. You earn less while you hold it, and the higher later price evens that out.
Our interest rate differential guide covers the rate gap itself, and the carry trade shows it from the other side. A broker’s overnight swap passes it on in daily slices. The BIS states the rule for forwards, and we apply it to futures because the same cost of carry sits behind both. That step is theory, not a measurement.
Why the gap shrinks and then resets
Look at T in the formula. Each day a contract lives, T gets smaller, so the gap gets smaller too. Near delivery the future and spot nearly meet, and the CFTC calls this convergence.
Then the chart changes contract. A continuous symbol such as 6E1! shows the front contract, so near expiry it switches to the next one. That new contract has about three months left. So T jumps back up, and the gap jumps with it. In our data these switches fell in mid-September, December, March and June, each one 91 days after the last.
So the sawtooth is built in. The slow slide is time passing, and the jump is the chart changing contract. Neither one tells you where the euro is heading.
How we tested
We pulled hourly bars from the TradingView web chart on 3 November 2026. For each hour where both bars exist, we took the future’s close, divided it by the spot close, subtracted 1 and multiplied by 100. The yen needs one more step. CME quotes dollars per yen and USD/JPY is yen per dollar, so we flipped spot first.
| Currency | Future | Spot | Window (UTC) | Hours |
|---|---|---|---|---|
| Euro | CME:6E1! | OANDA:EURUSD | 22 July 2025 01:00 to 3 November 2026 09:00 | 7,639 |
| Yen | CME:6J1! | OANDA:USDJPY | 30 June 2025 09:00 to 3 November 2026 09:00 | 7,995 |
| Pound | CME:6B1! | OANDA:GBPUSD | 22 July 2025 06:00 to 3 November 2026 14:00 | 7,639 |
Our five chart captures use H1 and D1 on these symbols, and we drew the two data charts from the same bars. We placed no trades, so every figure is a price gap before spread, swap, financing and commission. Our editorial testing policy explains how we collect and report numbers like these.
Futures contract vs forward: the terms side by side
This table holds the terms that change a decision.
| Term | Futures contract | Forward |
|---|---|---|
| Where it trades | On an exchange | Over the counter, between two parties |
| Size and date | Standard | Set by the two parties |
| Price | Set at the start | A currency forward uses a fixed rate set at the start |
| Gains and losses | Marked to market each session | Build until the agreed date, unless the deal says otherwise |
| Default risk | Clearing organization stands behind it | Each side faces the other |
| Ending early | Offset with an opposite trade | By agreement with the other party |
| Public prices | Yes, from the exchange | Private, so we have none to test |
Exchange data is a real gain for chart users. Futures also feed the COT report, while a private forward leaves no public record we could use.
Reading the gap on a chart
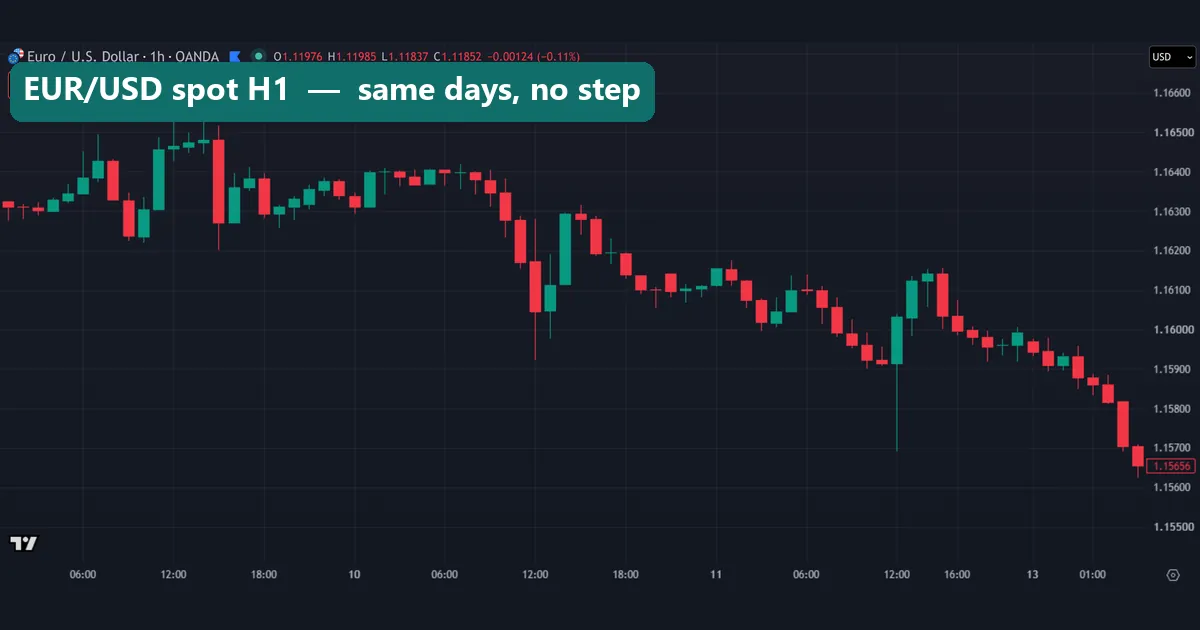
Put the two euro charts side by side. The first image above is the future, and the next one is spot over the same stretch of days. The swings match, and only the level changes. At 12:00 UTC on 10 September, before the roll, the lows were 1.1593 on the future and 1.15923 on spot. At 12:00 UTC on 11 September, after it, the same long wick reached 1.16065 and 1.15692. That is about 37 pips apart.
A daily chart hides the hours but still shows the steps. The yen future below quotes dollars per yen, so it rises when USD/JPY falls. Each purple marker is a roll, and the red tag names the contract in use, 6JZ2026. The June 2026 step is the clearest. The 11 June bar closed at 0.0062485, then the next bar opened at 0.006298. That is a contract change, not a yen rally.
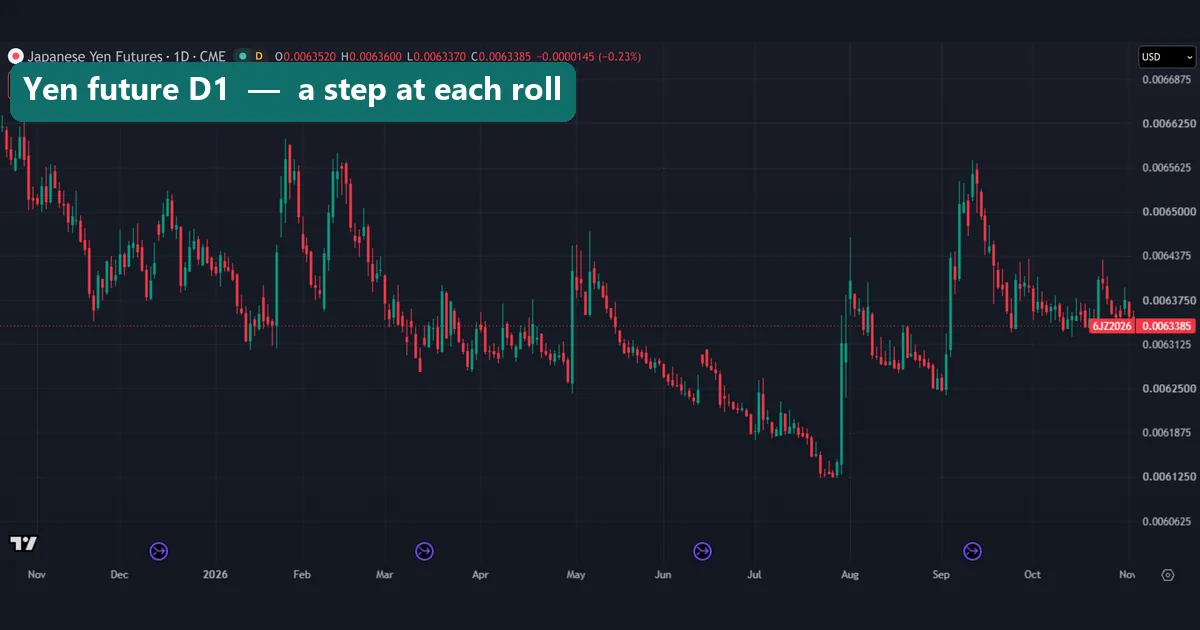
So find the roll markers before you read any sudden step. Also, compare a future with spot at the same hour, never across sessions.
Worked example: the euro roll of 10 September 2026
These are real closes from our bars. The future has no 21:00 bar that day, so 20:00 is the last shared hour before the roll.
| Hour (UTC) | Euro future | EUR/USD spot | Gap |
|---|---|---|---|
| 10 Sep 2026, 20:00 | 1.16125 | 1.16100 | +0.022% |
| 10 Sep 2026, 22:00 | 1.16510 | 1.16104 | +0.350% |
| 14 Sep 2026, 04:00 | 1.16075 | 1.15656 | +0.362% |
First, the step. The future rose from 1.16125 to 1.16510, which is 38.5 pips. Meanwhile spot rose from 1.16100 to 1.16104, which is 0.4 of a pip. So the gap moved +0.33 points, and the euro itself did almost nothing.
Next, turn the gap into a yearly rate. The last two rolls were 91 days apart, so 0.350 x 365 / 91 gives about 1.4 points a year. That day the Federal Reserve’s table of target range changes showed 3.50-3.75%. Also, the ECB’s table of key interest rates showed a deposit rate of 2.25%. The difference is 1.25 to 1.50 points, which is a close fit.
Last, watch what spot did next. By 14 September it had fallen to 1.15656, yet the gap still stood at +0.362%. So the premium did not point to a rise. The same roll took the yen from +0.011% to +0.725%, but the pound only from -0.004% to +0.009%.
Sixteen months of gaps in three currencies
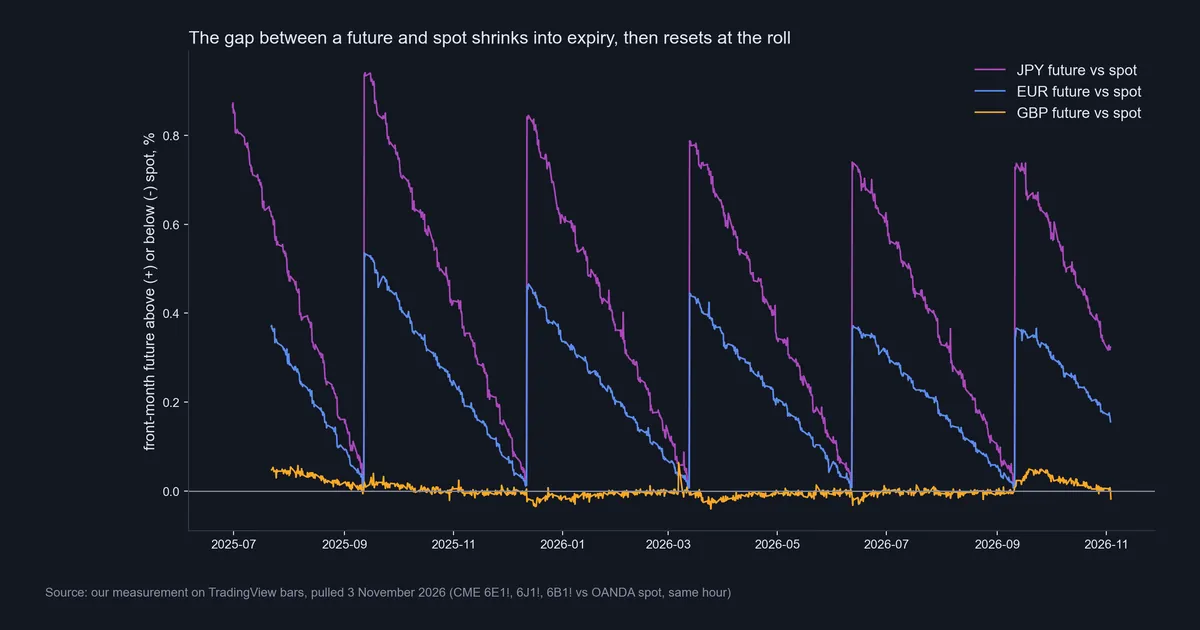
The median gap was +0.436% for the yen, +0.230% for the euro and -0.001% for the pound. Euro jumps ran from +0.33 to +0.52 points, and yen jumps from +0.71 to +0.93, across five rolls. Outside the rolls, the largest hourly change in the euro gap was only -0.053 points.
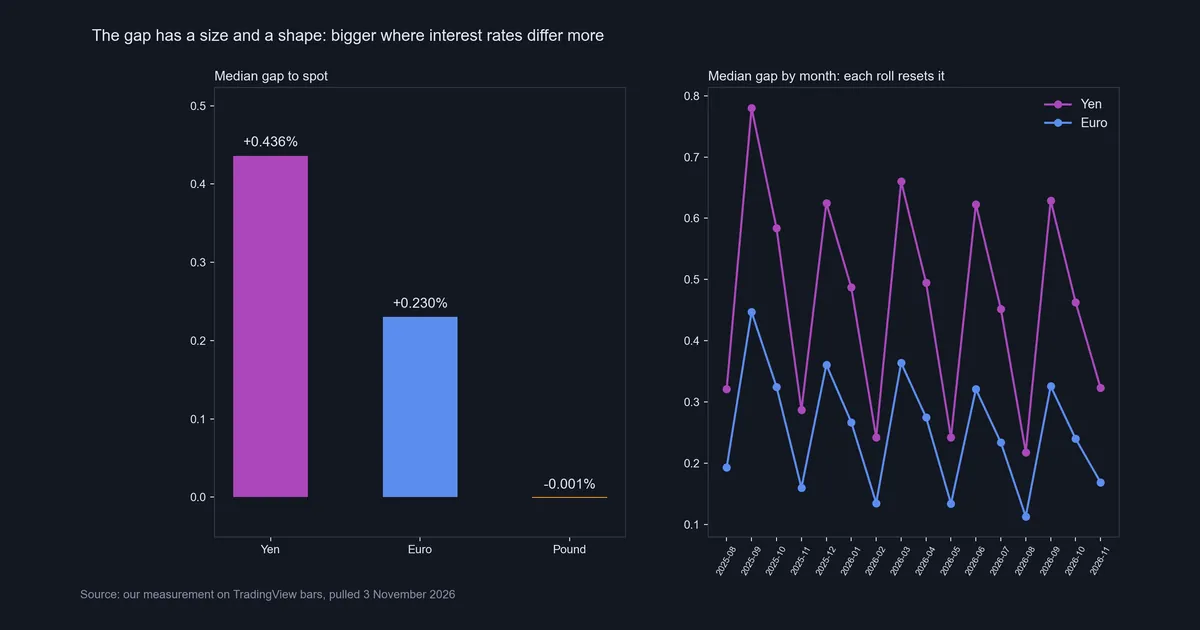
The sizes line up with the rates. As of 3 November 2026 the Fed’s range is 3.75-4.00% and the ECB’s deposit rate is 2.50%. In words, the Bank of Japan’s rate is the lowest of the four, and the Bank of England’s sits level with the bottom of the Fed’s range. So the yen shows the widest gap and the pound almost none. We print only the two rates we link, and tying the other two to these gaps is our inference.
The jumps also shrank. The euro’s was +0.523 points in September 2025 and +0.328 in September 2026. Over that year the Fed’s range fell from 4.25-4.50% to 3.50-3.75%, while the ECB’s deposit rate rose from 2.00% to 2.25%. That narrower rate gap fits the smaller jump, but it does not prove the cause. To follow those moves, see central bank rate decisions and the Fed dot plot.
Download the complete indicator database
Put these concepts on your charts. One email unlocks the full library of 1,380+ indicators with compiled MT4 and MT5 files, plus my TradingView scripts. No paywall, no spam, unsubscribe any time.
Get free access to my indicator database
One email unlocks 1,380+ free MT4, MT5 and TradingView indicators — the complete library. No single-tool download; you get the whole database.
Where it fails
We did not measure a forward. Forward prices are private, so we tested futures against spot. The claim that forwards follow the same logic rests on theory and on the BIS, not on our data.
The rule itself leaks. The BIS article, from September 2016, says covered interest parity has failed to hold since the global financial crisis. It adds that the breaks lasted after the strains faded. So a real forward can drift from the formula, and we cannot tell you by how much.
Spot here is one feed. OANDA’s chart is one broker’s quote, so another feed will differ a little. Hourly closes also do not print at the same instant.
Policy rates are rough. The formula wants market rates for the contract’s whole life, and those include what traders expect next. So our yearly figure is a sanity check, nothing more.
The window is short. We have five rolls, three currencies and sixteen months. The dollar rate stayed above the euro and yen rates throughout, so we never saw those gaps turn clearly negative.
It is not a trade signal. The gap shrinks on schedule because of interest, not because of a free gain. Also, spread, financing and commission sit on top, and we counted none of them.
The pound: when the gap nearly vanishes
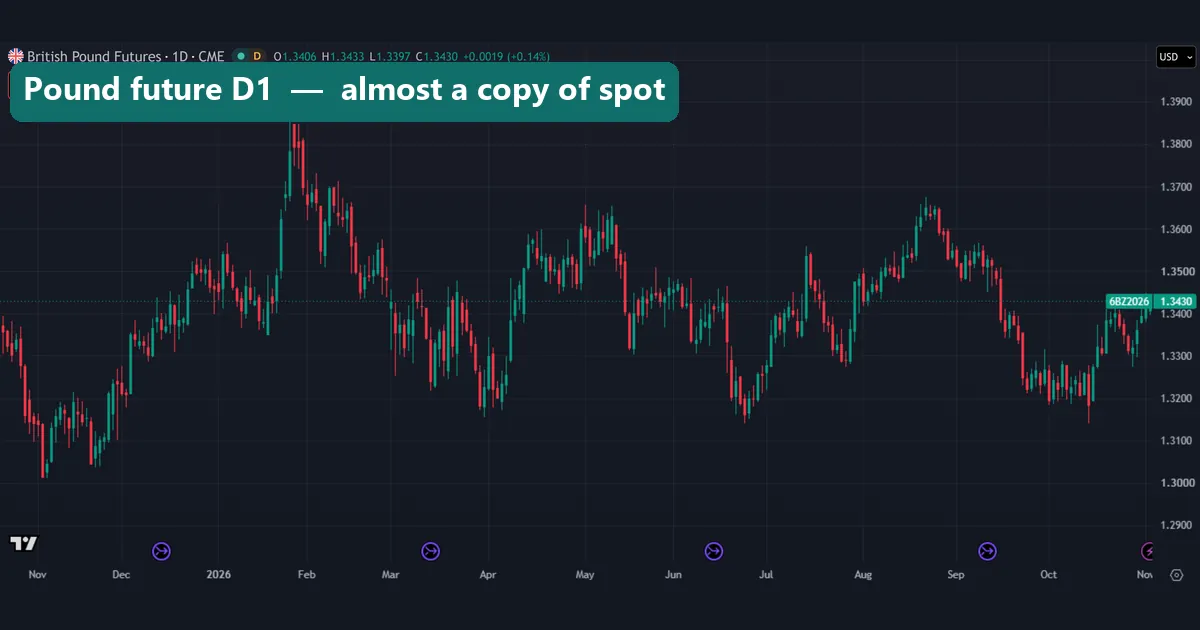
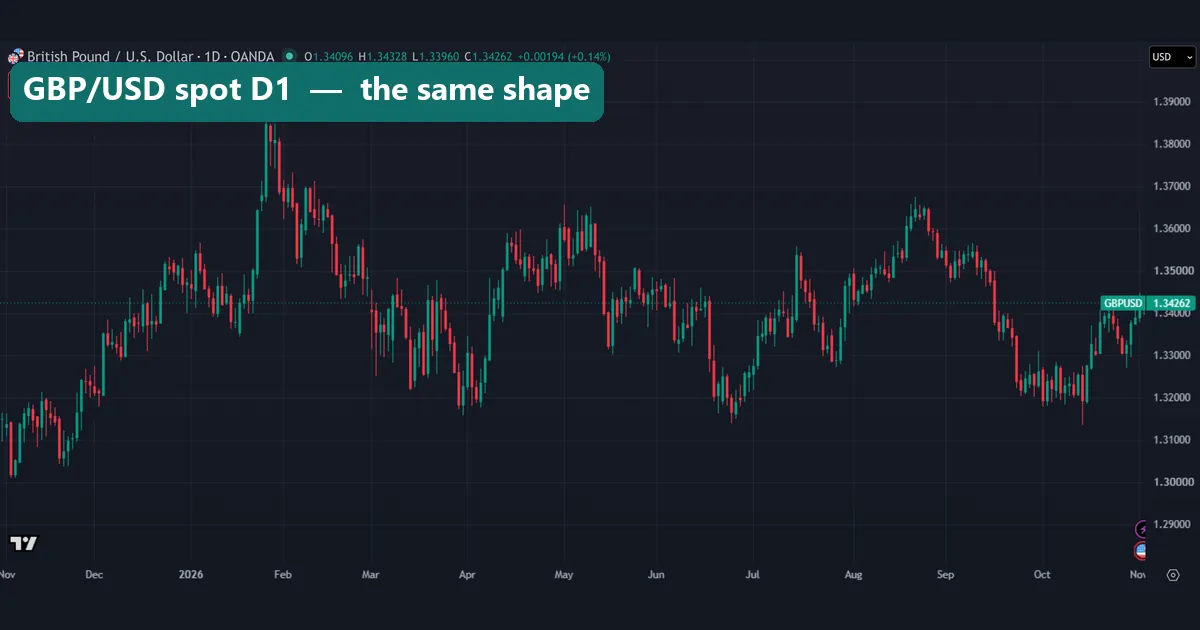
The pound is our control, and these two daily charts look like copies. The future’s high was 1.3869 on 27 January 2026, and spot’s was 1.3870. The lows were 1.3011 and 1.30102 on 4 November 2025. Across the whole window the hourly gap stayed between -0.054% and +0.063%, and none of its six largest hourly changes came at a roll. The widest print came in the last bar before the weekend on 6 March 2026, and it had gone when trading reopened. That looks like timing noise.
The sign follows the rates, but only faintly. From December 2025 the Fed’s range sat at or under the UK rate, and the monthly median ran from -0.012% to -0.001%. Then the Fed raised its range on 17 September 2026, and the median turned positive: +0.026% that month and +0.017% in October. These numbers are tiny, so treat them as a hint.
These charts also carry a warning. On 27 January 2026 the future’s daily bar closed at 1.3783 and spot’s at 1.38482, which looks like a 65-pip gap. Yet at 19:00 UTC the two hourly closes were 1.3782 and 1.37832. The pound ran up late that day, and the two daily bars appear to stop at different hours. That is why we measured by the hour.
Common mistakes
- Reading the gap as a forecast. A future above spot does not mean the market expects a rise. In our euro example, spot fell about 45 pips by 14 September while the gap held.
- Treating a roll as a price move. A continuous chart steps at each roll. So an indicator or a backtest on that chart can read the step as a breakout.
- Treating the gap as free money. The gap closes on schedule, so selling a future above spot can look easy. But holding the other side costs about the same interest difference, and that cost is why the gap exists.
- Assuming the same price means the same risk. A forward can follow the same formula as a future and still leave you exposed to one party failing.
Where to go next
Our four outside sources sit above, next to the claims they support: the CFTC glossary, the BIS article, the Fed’s table and the ECB’s table. On this site, try these next.
- Nikkei futures: the same basis idea on a stock index, where a future sits away from the cash level.
- Carry trade unwinds: what can happen when a rate gap stops paying.
- Futures position size calculator: size a contract before you think about the gap.
FAQ: futures contract vs forward
What is the main difference between a futures contract and a forward?
A future is a standard contract on an exchange, with daily settlement and a clearing organization behind it. A forward is a private deal with custom terms and direct exposure to the other party.
Do forwards and futures have the same price?
Both follow the same cost of carry logic, so they should sit close for the same date. However, we cannot show how close, because we have no forward price data.
Why does a currency future trade above spot?
It does so when that currency pays a lower rate than the dollar. In our window the median gap was +0.436% for the yen future and +0.230% for the euro future.
Why does the gap jump on a continuous chart?
The symbol moves to the next contract, which has about three months left. So the gap resets at each quarterly roll, even though spot barely moves.
Why does the pound future sit so close to spot?
UK and US rates sit close together, so the formula leaves little gap. The median was -0.001%. That cause is our inference, not a separate measurement.
Does a futures premium predict the exchange rate?
Not on this evidence. The premium reflects interest, and spot can move either way. In the days after the September 2026 roll, EUR/USD fell while the euro gap stayed near +0.36%.
Which one can a retail trader use?
Exchange futures need a futures account. Forwards usually need a bank or dealer, so ask your provider what it offers.
Can you profit from the gap between futures and spot?
The gap is mostly interest, so holding the other side tends to cost about what the gap pays. We placed no trades and counted no costs, so read our figures as a description of price. In any market, results are not guaranteed; past performance is not indicative of future results.
Last updated: 3 November 2026.

About the author
Written by Dominic Walsh, a Forex trader and MT4/MT5 indicator, Expert Advisor and script developer. Every tool on forexmt4systems.com is tested on live charts before release and ships with ready-to-use compiled MT4 (.ex4) and MT5 (.ex5) files. Learn more about the trader and developer behind this site.
How we build, test and correct every tool: Editorial & Testing Policy. Trading carries risk; see the disclaimer.