
What does OTC mean? It stands for over the counter. At a pharmacy, it means medicine you can buy without a prescription, and the FDA’s guide to over-the-counter medicine covers that sense. In finance, it means a trade agreed directly between two parties rather than on an exchange. This guide stays with finance. It settles what OTC means in spot forex and in stocks, how it differs from exchange trading, and how far OTC prices really drift apart. To answer that last point, we compared EUR/USD from five chart feeds over about 7,900 hours.
What does OTC mean in finance?
The CFTC’s glossary of trading terms defines over the counter as the trading of commodities, contracts or other instruments not listed on any exchange. It adds that these trades can happen electronically or by telephone, and it gives off-exchange as the other name. The same glossary describes forex as the over-the-counter market for foreign exchange.
So the term describes where a trade happens, not what gets traded. An exchange runs one venue with one order book and one set of contract rules. An OTC market has no such centre. Instead, banks, dealers and brokers quote their own prices, to each other and to clients. As a result, no screen anywhere shows the one true price of the euro.
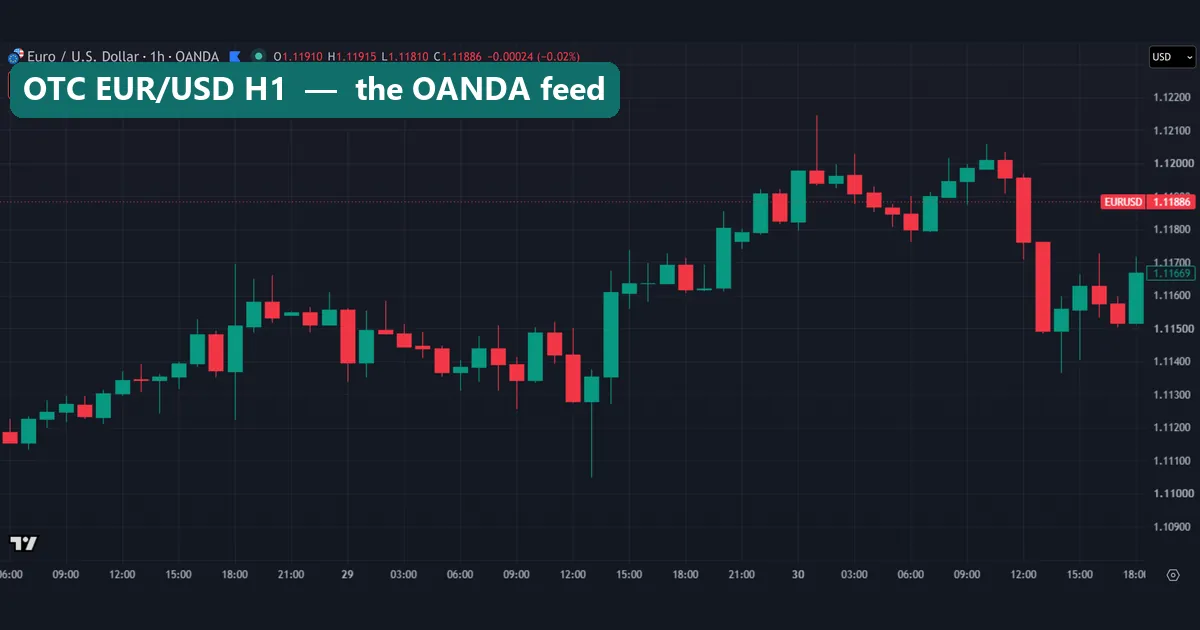
The chart above is one view of that market: EUR/USD from OANDA’s feed on TradingView, 60 hourly candles ending 30 October 2026. Later charts show the same hours from other sources.
How an OTC trade works, compared with an exchange
A retail forex trade usually follows three steps.
- Your broker streams a bid and an ask price, built from its own sources and pricing.
- You click buy or sell. Then the broker either takes the other side or passes the risk on to a bank or other provider.
- Your position stays with that firm, so you close it there too.
Our guides on how forex brokers work and ECN brokers versus market makers explain step two. This table shows what changes when the same currency pair trades on an exchange.
| Point | OTC spot forex | Exchange future |
|---|---|---|
| Where the price forms | Each firm’s own quotes | One central order book |
| Who stands behind the trade | The firm you dealt with | A clearing organization |
| Contract terms | The firm’s account rules | Standard size and expiry |
| EUR/USD price | Near spot | Spot plus forward points to expiry |
The CFTC glossary ties counterparty risk to the financial stability of the party you contract with. Futures on a designated contract market differ, because the clearing organization covers a default. Our comparison of forex and futures covers the wider differences.
OTC in forex: the largest numbers
The Bank for International Settlements surveys this market every three years. The BIS release on its 2025 Triennial Survey puts FX trading at $9.6 trillion per day in April 2025, up 28% from 2022. OTC interest rate derivatives reached $7.9 trillion per day in the same survey. The data comes from more than 1,100 banks and other dealers.
Most of that flow isn’t spot trading, though. FX swaps led at $4 trillion per day, while spot held a 31% share. The US dollar sat on one side of 89% of trades, and the euro came second at 28.9%. So EUR/USD pairs the two most traded currencies.
That depth helps explain how the pair can carry a tight forex spread with no exchange at all. It also makes EUR/USD a fair test: if OTC feeds agree anywhere, they should agree here.
OTC stocks: same words, different risks
The term also covers stocks that don’t trade on a national securities exchange. We did not test these, so this section rests on the SEC. Its Investor.gov page on microcap fraud says microcap stocks often get their quotes on OTC systems. It names alternative trading systems such as OTC Link ATS, Global OTC ATS and DBOT ATS.
The same page explains why that matters. Public information about the smallest companies is often scarce, and that makes false claims easier to spread. These stocks have also traded less liquidly than larger ones, so fraudsters often find their prices easier to manipulate. The SEC adds that it doesn’t endorse what those venues post.
So the label can point to very different markets. OTC EUR/USD pairs the two most traded currencies, while an OTC penny stock may be far less liquid and far harder to research.
How we tested
We pulled hourly EUR/USD bars from the TradingView web chart on 3 November 2026. The five OTC feeds were OANDA, FOREXCOM, SAXO, PEPPERSTONE and the FX:EURUSD feed (labelled FXCM on the chart). The window runs from late July 2025 to that pull date, which gives about 7,900 hours per feed. For contrast, we added the CME Euro FX future (CME:6E1!) from 30 June 2025, with 7,639 hours compared.
Each hour, we compared a feed’s high, low and close with OANDA’s, then measured the gap in pips:
gap in pips = |feed price - OANDA price| / 0.0001
OANDA is only our yardstick. It isn’t the true price, because an OTC market has no such thing. Also, these are chart feeds on TradingView, not the prices your broker would fill you at. We placed no trades, so the test says nothing about spreads, slippage or fills at any firm. Our editorial testing policy sets out how we run and report tests like this.
What we compared: feeds and results
Each row compares one feed with OANDA. A median of 0.1 means half the hours showed a gap smaller than 0.1 pips.
| Feed | Hours | Median high gap (pips) | Median low gap (pips) | Median close gap (pips) | Highs and lows over 1 pip | Over 3 pips | Largest high gap (pips) |
|---|---|---|---|---|---|---|---|
| FX:EURUSD (labelled FXCM) | 7,913 | 0.10 | 0.10 | 0.10 | 3.8% | 1.1% | 7.5 |
| FOREXCOM | 7,933 | 0.10 | 0.05 | 0.10 | 0.9% | 0.1% | 6.9 |
| SAXO | 7,913 | 0.15 | 0.15 | 0.15 | 0.6% | 0.1% | 7.2 |
| PEPPERSTONE | 7,929 | 0.10 | 0.10 | 0.10 | 3.5% | 1.3% | 6.0 |
Every median sits between 0.05 and 0.15 pips. So in a typical hour, these feeds agree to a fraction of a pip. The tails differ more. Two feeds printed over 3% of their highs and lows more than 1 pip from OANDA, and the other two stayed under 1%. That doesn’t make any feed better, and we aren’t ranking them. It only shows that OTC feeds aren’t copies of one another.
Reading OTC prices on a chart
Start with a second source. This chart covers the same 60 hours as the first one, from FOREXCOM instead of OANDA.
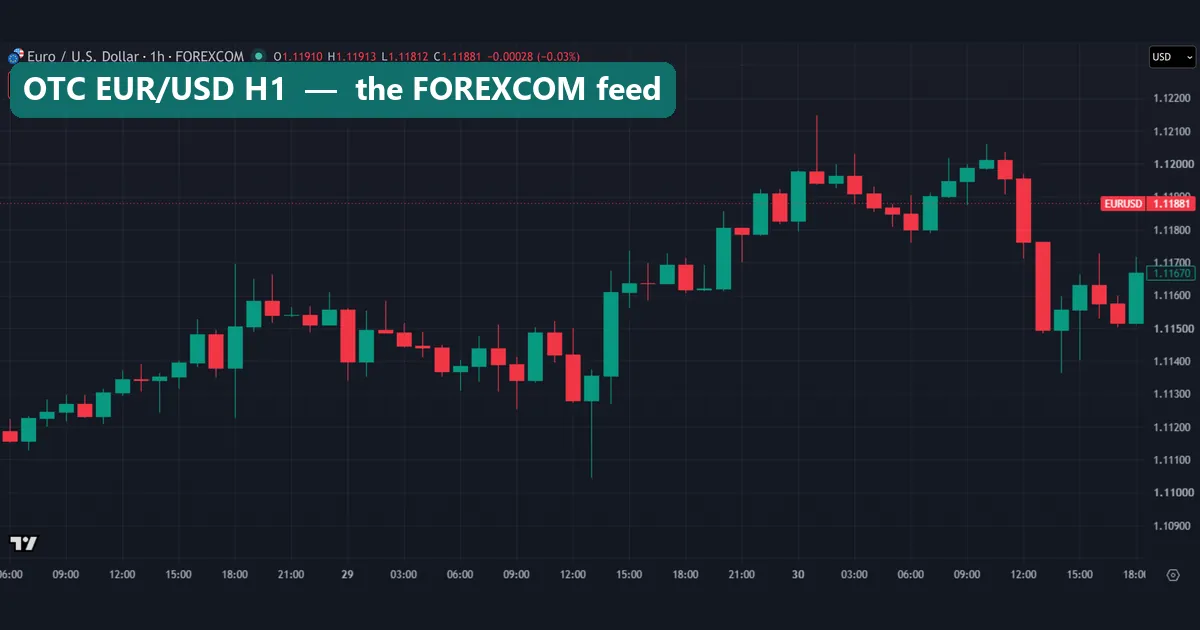
The candles look almost identical. Both charts show the spike above 1.1210 on the 30th and the long wick near 1.1105 on the 29th. However, two parts of the screen can mislead you. The open, high, low and close figures at the top belong to the hour when we took the shot, not to the candles you see. The SELL and BUY boxes are a live snapshot as well. They show a gap of 1.5 on the OANDA chart and 0.0 on this one. We took these shots minutes apart, and they show feed quotes, so don’t read them as trading costs.
Next, look at the exchange product over the same hours.
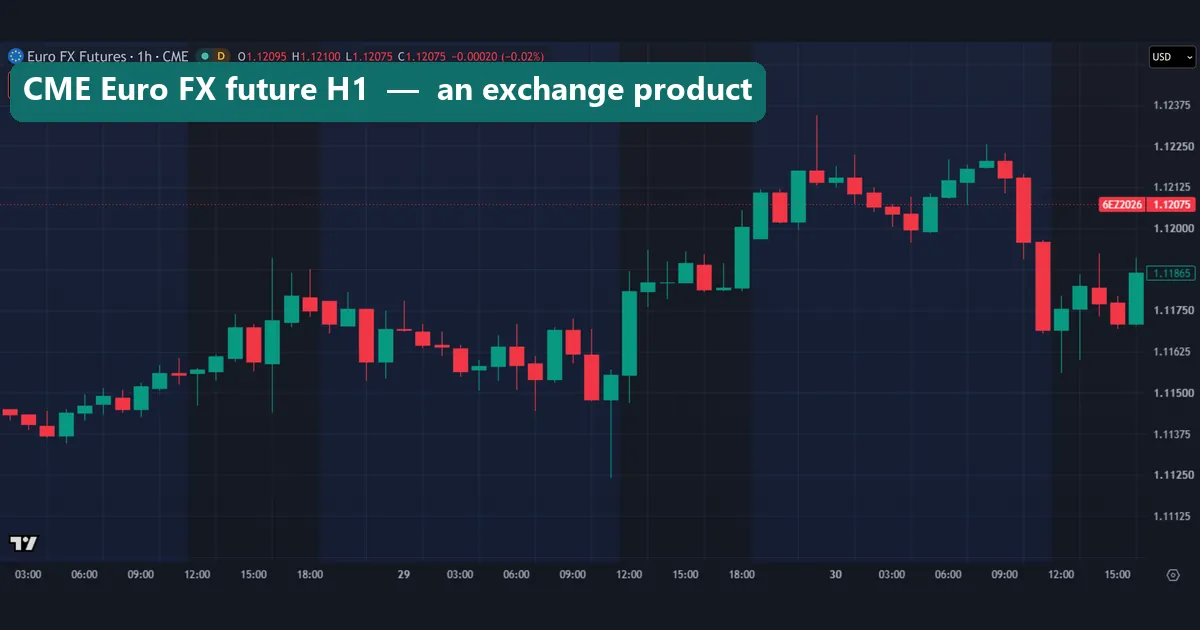
The swings match, but the whole chart sits higher on the price axis. The label on the right shows the contract behind the series: 6EZ2026, which has an expiry date. Its price includes the forward points to that date, so it sits away from spot on purpose. This chart also has shaded session bands, which the OTC charts lack.
Worked example: one candle, four prices
Take the last candle on each chart, the final hour of the window on 30 October 2026. Its close appears in the green box on the right-hand axis. Saxo’s chart comes further down.
- OANDA: 1.11669
- FOREXCOM: 1.11670
- Saxo: 1.11668
- CME 6EZ2026 future: 1.11865
First, take the three OTC feeds. The highest close minus the lowest is 0.00002, or 0.2 pips. That fits the medians in our table. Then take the future. Its close minus OANDA’s is 1.11865 – 1.11669 = 0.00196, or 19.6 pips.
That gap is smaller than the 26.6-pip median we measured, in a full range from -1.1 to +63.2 pips. It moves because forward points shrink as a contract nears expiry, and they reset when the series rolls to the next contract. So neither price is wrong, and the gap is not a signal.
What the numbers showed, hour by hour
This chart draws our table, with median gaps on the left and the tails on the right.
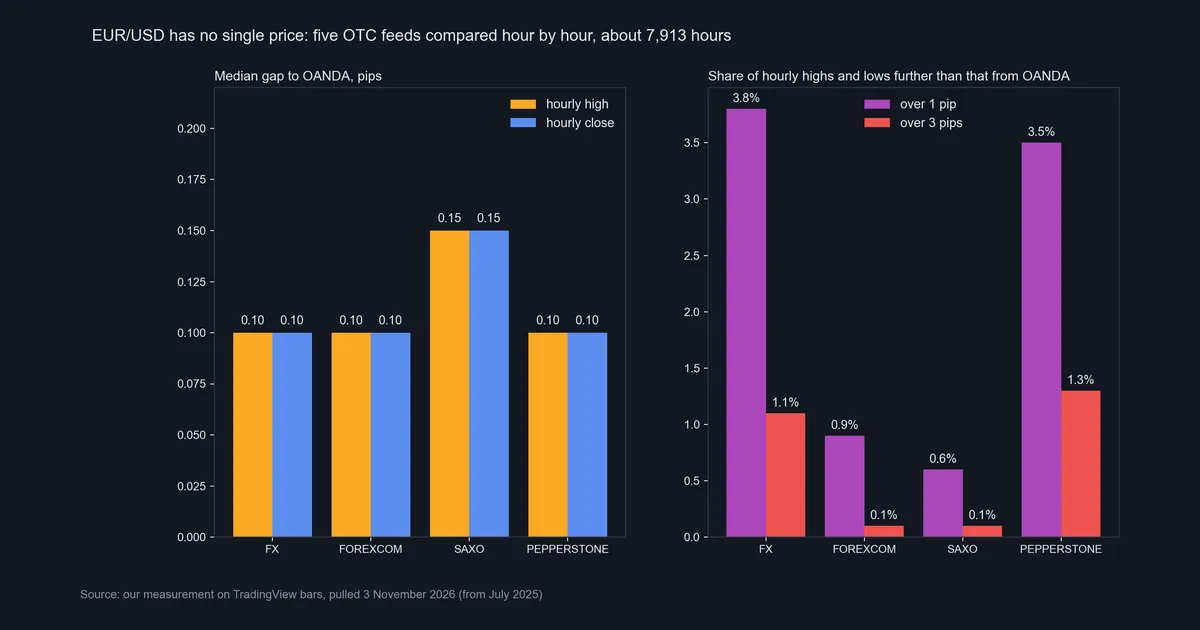
So where do those tails come from? We split the gaps by New York hour, pooled all four feeds, and one answer stood out.
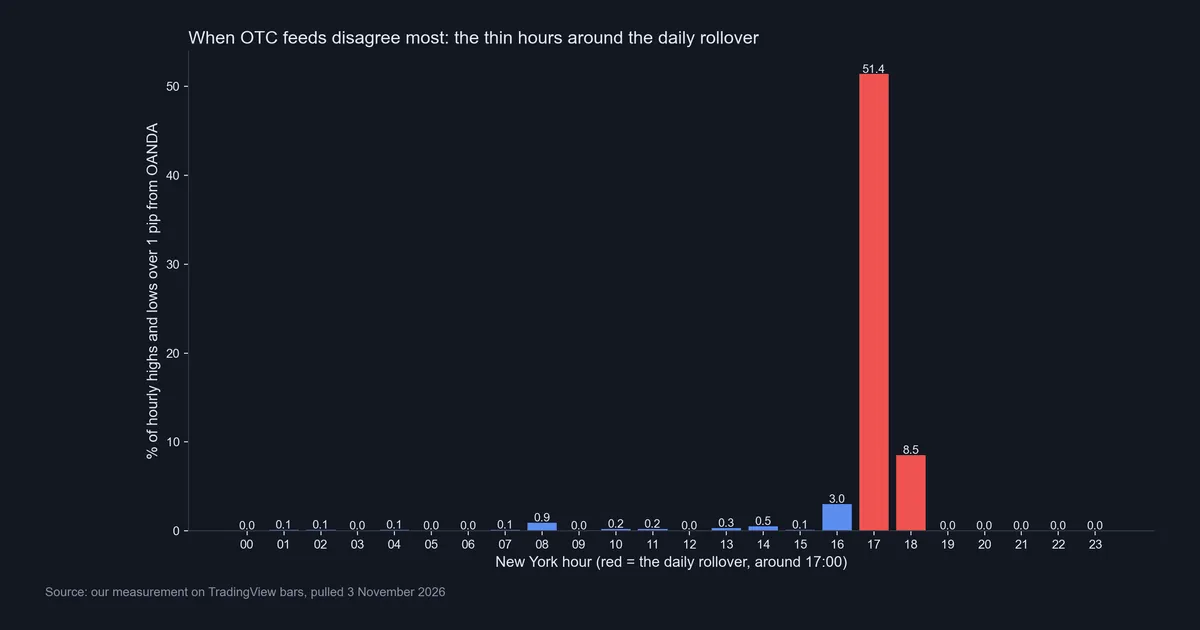
In the 17:00 hour, 51.4% of highs and lows sat more than 1 pip from OANDA. At 18:00 the share was 8.5%, and at 16:00 it was 3.0%. Every other hour stayed under 1%. That stretch is the daily rollover, and our guide to why spreads widen explains how quotes thin out around it. So OTC prices differ little in liquid hours and a lot in thin ones. Our forex market hours tool shows where that window falls on your own clock.
Download the complete indicator database
Put these concepts on your charts. One email unlocks the full library of 1,380+ indicators with compiled MT4 and MT5 files, plus my TradingView scripts. No paywall, no spam, unsubscribe any time.
Get free access to my indicator database
One email unlocks 1,380+ free MT4, MT5 and TradingView indicators — the complete library. No single-tool download; you get the whole database.
Where it fails
Our test has clear limits, and OTC trading carries a risk that a cleared exchange trade avoids: you rely on the firm that holds your position.
- Chart feeds are not fills. A TradingView feed can differ from what your account receives.
- Hourly bars hide detail. A small gap in an hourly high says nothing about the quote at the second you click.
- A gap does not name a culprit. It tells you two feeds differ, not which one was right. Our yardstick could be the odd one out.
- We tested one pair. Thinner pairs may show wider gaps, but we didn’t measure them.
- Volume stays local. Spot forex has no central record of trades, so volume on a spot chart reflects only that feed.
So the test shows that OTC prices sit close together most of the time. It doesn’t show that any firm’s prices are fair, or that your fills will match a chart.
A third feed and the widest gap
Here are the same 60 hours once more, this time from Saxo.
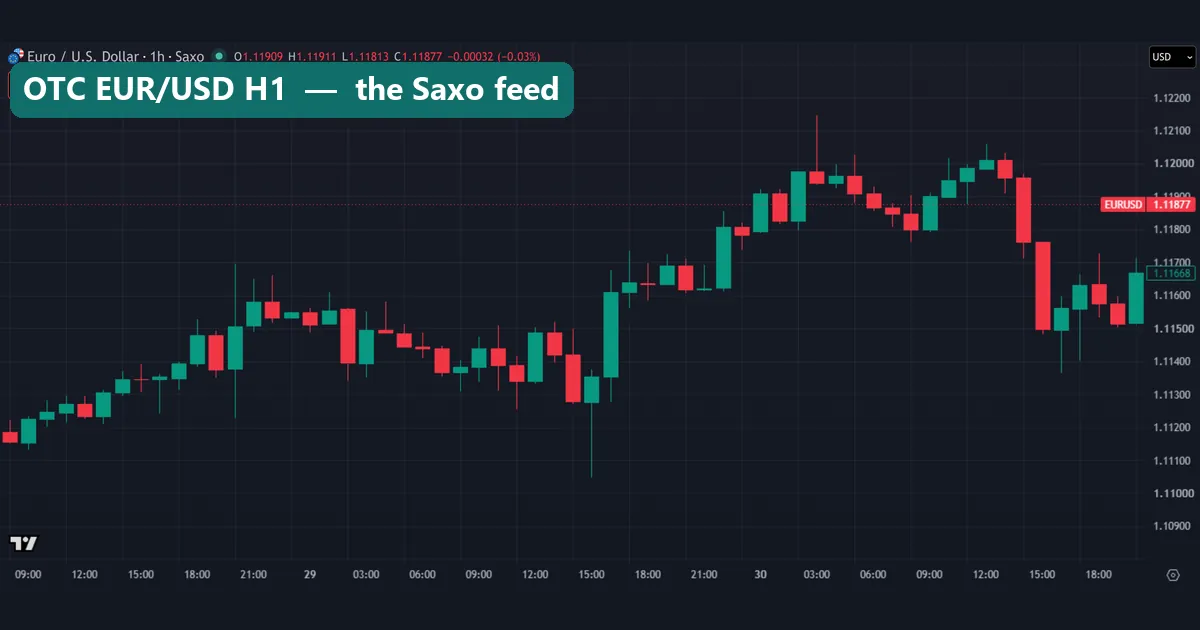
Again, the candles look nearly identical to OANDA’s. Yet the clock labels run about two hours later than on the first chart, even though the bars line up in our data. The CME chart’s labels differ as well. So trust the date and the candle shape, not the printed time.
Next comes the hour with the widest gap we found.
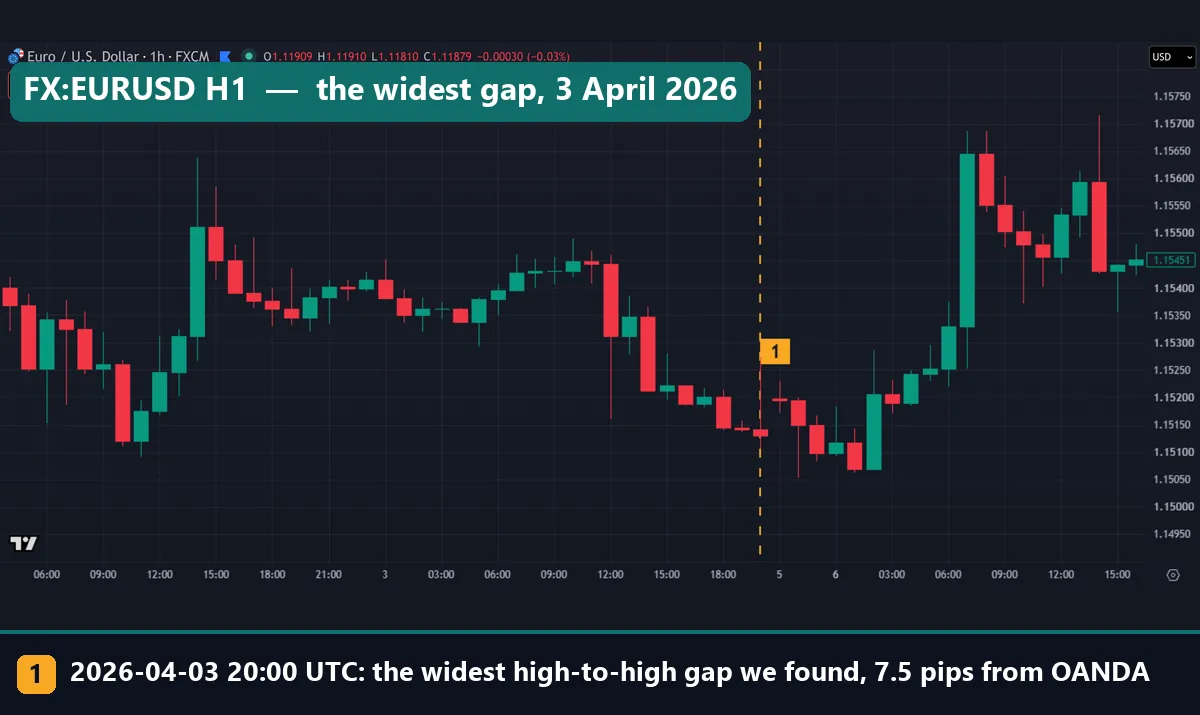
This is the FX:EURUSD feed (labelled FXCM on the chart), marked at 20:00 UTC on 3 April 2026. That hour, OANDA printed a high 7.5 pips above this feed’s. The chart shows one feed, so you can see where the gap happened but not the gap itself. Ignore the 1.119 figures in the header too, because they come from the capture day, not from April.
In New York, that hour was 16:00 on a Friday, the last one before the close that sets the weekend gap. It was also Good Friday. We measured the gap, not its cause. Still, the other extremes landed in the same thin stretch: FOREXCOM’s 6.9 pips and SAXO’s 7.2 pips at 18:00 New York on Sunday 15 March 2026, and PEPPERSTONE’s 6.0 pips at 17:00 on 12 August 2025.
Common mistakes with OTC prices
Treating your chart as the market. Your chart shows one quote stream. A level that one feed touched to the pip may not print on another, so give your levels some room.
Setting tight stops through the rollover. Our 51.4% figure sits in the 17:00 New York hour. Quotes can drift apart there, and swap charges land around the same time. So review any tight stop before that hour arrives.
Reading the futures gap as an error. A future 19.6 pips above spot isn’t mispriced. It carries forward points. If you compare the two, compare their changes, not their levels.
Assuming off-exchange means outside the rules. The CFTC glossary says the firm that takes a US retail customer’s forex funds must be one of the types the Commodity Exchange Act lists. Rules differ by country, so start with our overview of forex regulatory bodies.
Where to go next
Pick the path that matches your question.
- To see what your broker does with an order, read A-book vs B-book brokers.
- To look at quoted costs across firms, try our forex spread comparison.
- To learn another off-exchange product, read what CFDs are.
FAQ: OTC in plain terms
What does OTC stand for?
OTC stands for over the counter. In finance, it means a trade made off-exchange, directly between two parties. In medicine, it means a drug sold without a prescription.
Is forex traded over the counter?
Yes, spot forex is. The CFTC glossary describes forex as the over-the-counter market for foreign exchange. Currency futures differ, because they trade on an exchange such as CME.
Why do forex prices differ between brokers?
No central order book sets one price, so each firm quotes its own. In our test, the median gap to OANDA ran from 0.05 to 0.15 pips. However, the largest high-to-high gaps reached 6.0 to 7.5 pips.
When do OTC prices differ most?
They differ most around the daily rollover. In the 17:00 New York hour, 51.4% of hourly highs and lows sat over 1 pip from OANDA. Outside 16:00 to 18:00, that share stayed under 1%.
Why is the EUR/USD future priced above spot?
The future includes forward points to expiry. Over our window, it sat a median 26.6 pips above OANDA, in a range from -1.1 to +63.2 pips. So the gap is normal.
What are OTC stocks?
They are stocks quoted away from a national exchange, often on alternative trading systems. The SEC says information on the smallest companies is often scarce. We did not test them.
Is OTC trading riskier than exchange trading?
It carries one risk that cleared exchange trades avoid: you depend on the firm on the other side. So check who holds your funds and which regulator oversees that firm.
Can I trade the gaps between OTC feeds?
We did not test that, and our figures come from chart feeds, not fills. A gap of a fraction of a pip would also have to beat your spread and commission first. As with any trading, results are not guaranteed; past performance is not indicative of future results.
Last updated: 3 November 2026.

About the author
Written by Dominic Walsh, a Forex trader and MT4/MT5 indicator, Expert Advisor and script developer. Every tool on forexmt4systems.com is tested on live charts before release and ships with ready-to-use compiled MT4 (.ex4) and MT5 (.ex5) files. Learn more about the trader and developer behind this site.
How we build, test and correct every tool: Editorial & Testing Policy. Trading carries risk; see the disclaimer.